
記住我


The study used data from three different cohorts, the first one including participants in the 2005 National Health Interview Survey (NHIS), and the other two consisting of subjects resident in Turin and participating in the censuses 2001 or 2011, respectively.
The NHIS 2005 was conducted on a representative sample of the Italian population, including 50,474 families and 128,040 individuals, with 83% participation. The survey provides detailed information on individual and household socioeconomic status, employment, occupation, lifestyles, and health conditions. Follow-up of the sample for mortality and CVD incidence was conducted by means of record-linkage with the National Registry of Mortality of the National Institute of Statistics (Istat) and with the National Hospital Discharge Database of the Italian Health’s Ministry, respectively. The follow-up of this sample, together with that of the NHIS 2000, also going until 2014, is known as the Italian Longitudinal Study (ILS) (Sebastiani et al. 2019). NHIS 2000 data were not included in the study, because the job classification used in that survey was a previous one (CP1991), for which a crosswalk to translate job codes into those used in the job classification on which the JEM has been constructed (CP2011) is not available.
The second and third datasets are part of the Turin Longitudinal Study (TLS), which is a system of archives containing socio-demographic (data from censuses and civil registries) and health information (hospitalizations, drug prescriptions, mortality, etc.), record-linked at the individual level. 832,106 subjects participated in the 2001 census (TLS 2001 cohort) and 849,686 subjects in the 2011 census (TLS 2011 cohort).
In the national cohort (ILS 2005) and in TLS 2001 cohort, only subjects reporting to work as employees at baseline, and with information on job title, were selected. Regarding the TLS 2011 cohort, as only very crude information was collected on occupation at 2011 census (10 types of occupations in total), the job held was assigned through individual record-linkage to another administrative data source, the regional archive of Compulsory Communications (CC) of start/end job contracts. In this dataset are present all communications sent by employers from 2009 to 2018 to the Regional Employment Office, to report any change occurred in a work contract (hiring, firing, retirement), together with the code of the job held and its date of start and end. Therefore, these data allow the reconstruction of employees’ careers along many years for all subjects who started working, changed job or retired during 2009–2018, with retrospective information going back in many cases until the ‘80 s. Only workers who started a new job after 1995 were included in the study, as the JEM used to assign exposure to OPA was based on data collected in 2013, so it was not considered to represent reliably exposure in jobs held before mid- ‘90 s, when work intensity was generally lower than in later periods in most industries and workplaces, especially in terms of work pace and effort (Green et al. 2001).
In all cohorts, workers had to be between 25 years and the minimum age for pension seniority in the year of enrolment (56 years in 2001, 57 years in 2004, 60 years in 2011): the exclusion of older workers was meant to reduce the possible health selection into retirement of subjects with high exposure to ergonomic factors, which could have caused an underestimation of the true association between OPA and the outcomes.
In the ILS 2005 and the TLS 2001 cohorts, information on the job held at baseline was coded according to the 4-digit Istat 2001 classification of occupations (CP 2001), which includes 519 jobs, while no information was present on previous work history. Job codes of employed subjects in the ILS 2005 cohort were assigned automatically by Istat based on self-reported job title, and revised by one of the authors (R.C.). For TLS 2001, job codes were also assigned automatically by Istat and underwent, a decade ago, a thorough process of revision, funded by Istat, in which one of the authors was also involved (A.D). In contrast, for the TLS 2011 cohort job codes used had been assigned directly by the Regional Employment Office, with no possibility for us to review them, and were based on the 5-digit Istat 2011 classification of occupations (CP 2011), consisting of 796 occupations.
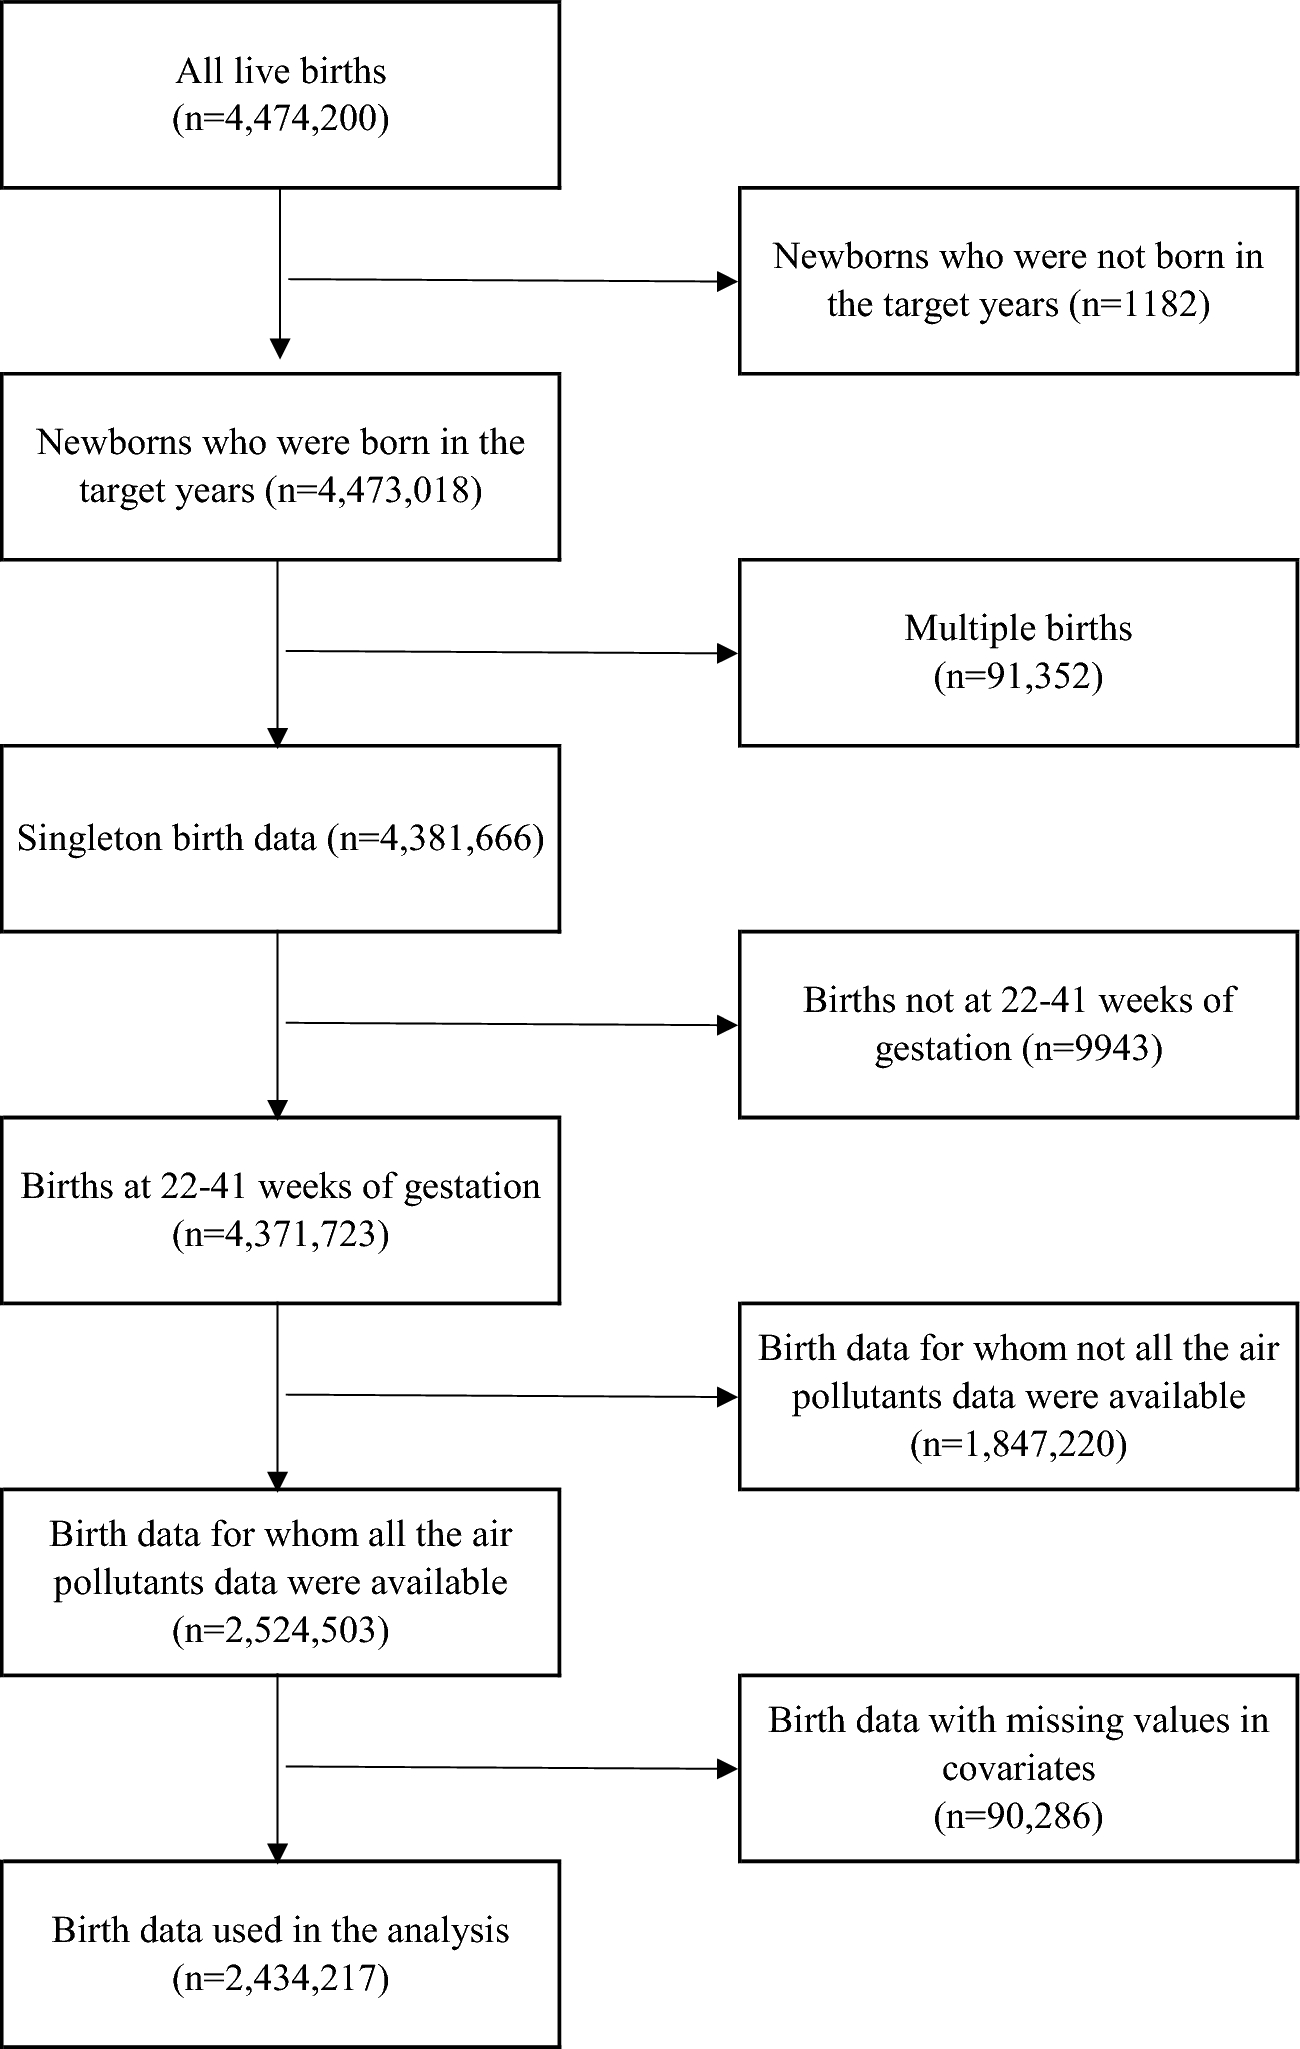
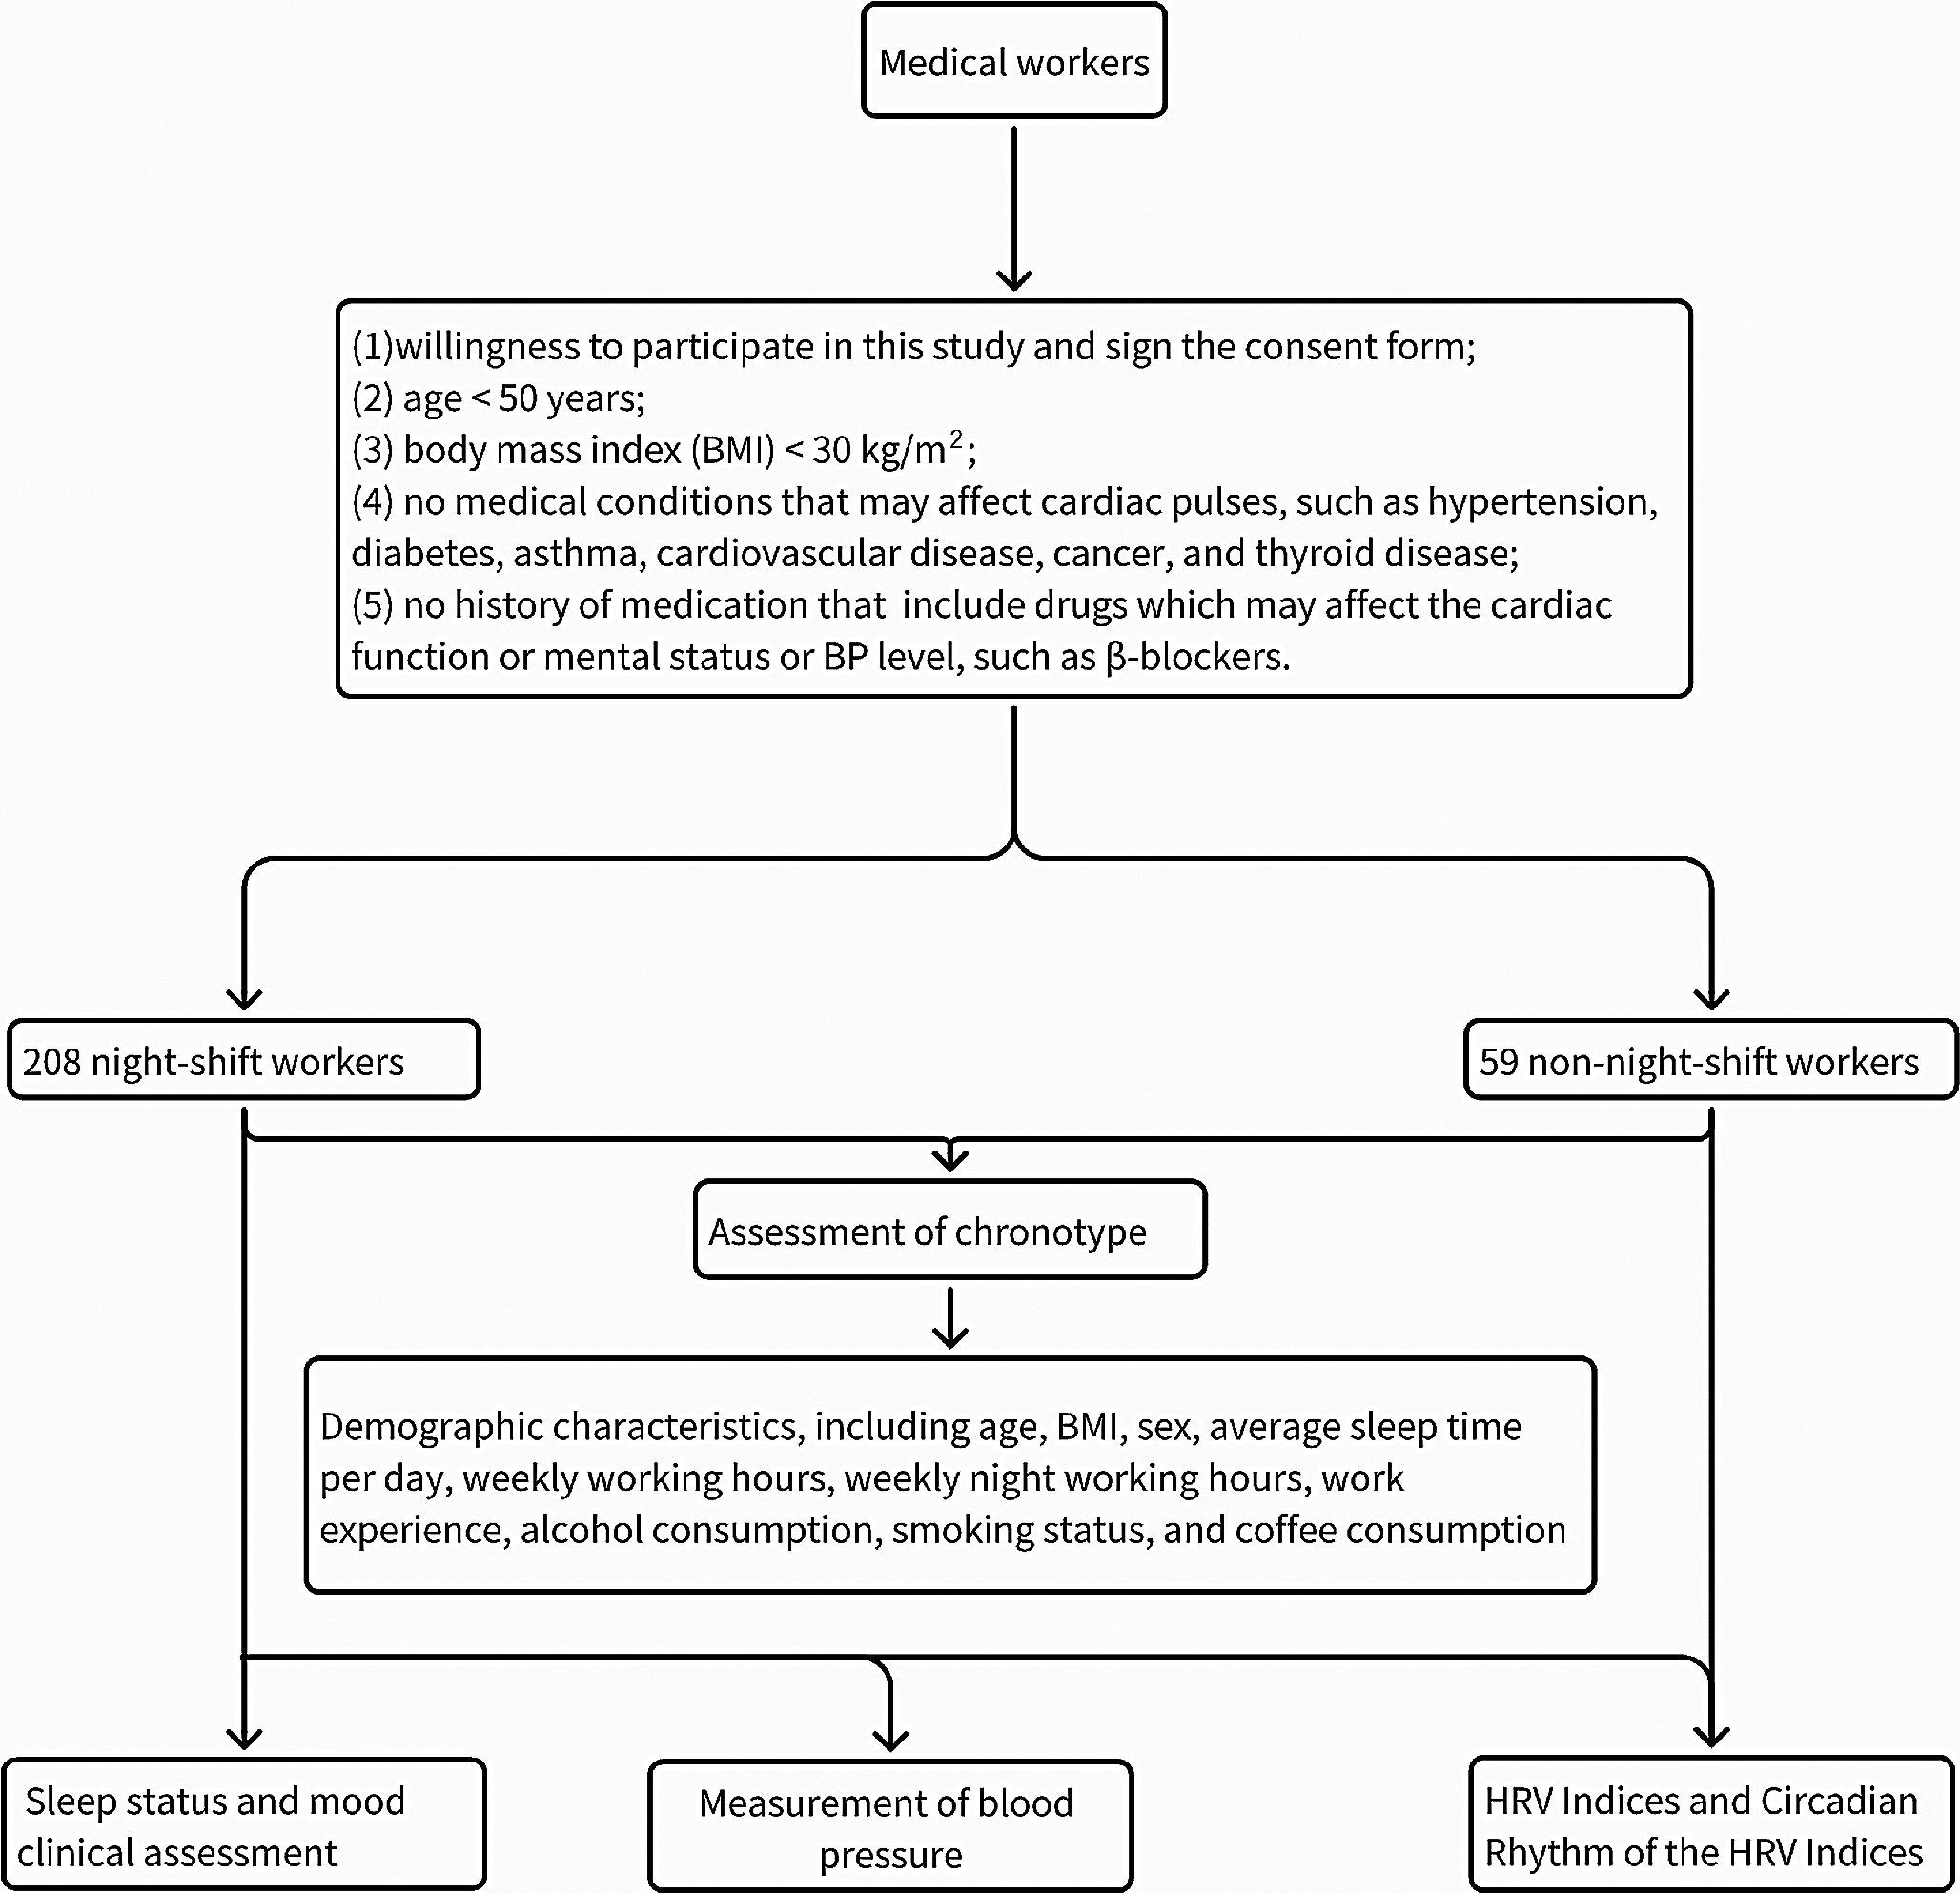
Based on these inclusion criteria, 31,520 subjects were enrolled in the 2005 ILS cohort, 157,868 in the TLS 2001 cohort, and 156,674 in the TLS 2011 cohort. A flowchart showing the steps of the selection of the study population of the three cohorts is presented in Fig. 1.
Fig. 1
Flowchart of the enrolment of the study population in each cohort
Subjects in the three cohorts were followed-up for overall mortality and for incidence of CVD, based on hospitalizations and death records. Incidence of CVD was assessed through a first hospital admission (identified by ICD-IX codes 390-459) or mortality for CVD (identified by ICD-X codes I00-I99) during follow-up. In the analyses on CVD, prevalent cases occurred before baseline were excluded. In TLS 2001 and TLS 2011, CVD prevalent cases were excluded based on previous hospital admissions for this disease group from 1995 to start of follow-up (5562 subjects in TLS 2001; 8417 subjects in TLS 2011). In ILS 2005, subjects were identified as CVD prevalent cases and excluded if they reported at baseline to have been diagnosed by a physician with myocardial infarction, angina pectoris, other cardiac diseases, or stroke (n = 790).
For the ILS cohort, follow-up started on the date of the baseline interview and ended at the end of 2014, or earlier in case of death or first hospitalization for CVD (for analyses on CVD); for the TLS 2001 and the TLS 2011 cohorts, it started at the beginning of 2002 and 2012, respectively, and ended at the end of 2018, or at the date of death, emigration out of town, or first hospitalization for CVD, if earlier. The TLS 2001 and 2011 cohorts partially overlapped, with 31,448 subjects present in both cohorts.
Exposure assessmentExposure to OPA was assigned to workers in the study through a job-exposure matrix (JEM) constructed from the Italian O*NET database, that contains information on hundreds of physical and mental descriptors, in terms of skills, knowledge, activities, work context, etc., aggregated at the job level (http://www.onetcenter.org). The Italian O*NET database is constructed from workers’ self-reports, based on interviews of approximately 20 workers of any gender for each of the 796 jobs of the Italian classification (CP2011, 5-digit level). For each job, the O*NET database contains scores for each descriptor, rated by importance, frequency, or intensity of a certain workplace characteristic. Answers to these questions are collected on 5-point or 7-point level, depending on the item, and averaged for each of the 796 occupations, with the mean representing the exposure score of a certain job.
From the 100 variables available in O*NET, a JEM was constructed for 21 physical factors, which were further reduced through Principal Component Analysis to 17 factors potentially involving high physical workload. For all 17 factors, good concordance against the same items of a corresponding O*NET JEM created in the United States has been shown (d’Errico et al. 2022a). Of the 17 items, 3 focused on force exertion (static strength; dynamic strength; trunk strength), 6 on activity level and repetitive movements of the upper limb (manual dexterity; fingers dexterity; wrist-finger speed; handling and moving objects; time spent making repetitive motions; time spent using hands to handle, control, or feel objects, tools or controls), 4 on postures (awkward positions; standing; kneeling, crouching, stooping, or crawling; bending and twisting the body), 2 items on activities involving the whole body (performing generalized physical activity; walking and running), 2 items on exposure to vibration (whole-body vibration, driving vehicles or other types of moving machinery). Scores of each item were standardized on a 0–100 scale and averaged, to compute a composite ergonomic exposure index (Ergo-index) (Cronbach alpha = 0.90), which is the measure of exposure to OPA used in this study. Further details on the construction of the JEM and the Ergo-index can be found elsewhere (Fontana et al. 2022; d’Errico et al. 2023).
As job codes in the JEM and in the regional archive of Compulsory Communications (CC) corresponded, being both based on the 2011 classification of occupations (CP 2011), it was possible to assign directly the Ergo-index computed for each 5-digit occupation to subjects in the TLS 2011 cohort. In contrast, job codes in the ILS 2005 and TLS 2001 cohorts were based on a previous job classification (CP 2001), which had to be translated by one of the authors (D.F.) into the CP 2011 one, to be able to assign the Ergo-index to subjects in these cohorts.
For ILS 2005 and TLS 2001, the Ergo-index scores were assigned to the job performed at baseline, as this was the only job known, while for the TLS 2011 cohort the Ergo-index was computed cumulatively from 1995 and over the years of follow-up, summing exposure scores across days of employment for each job held.
Data analysisThe association of OPA with mortality and CVD incidence was examined both treating the Ergo-index as a continuous measure and dividing it in quartiles (the baseline Ergo-index, for the ILS 2005 and the TLS 2001 cohorts, and the cumulative Ergo-index, for TLS 2011).
Incidence Rate Ratios (IRR) of mortality and CVD incidence associated with exposure quartile were estimated through Poisson regression models stratified by gender. All the analyses were adjusted for age, health, and household typology (single, coupled with children, coupled without children, single parent). In the ILS 2005 study, there was also information on geographical area, economic situation, lifestyles and biological risk factors for CVD, which allowed to perform analyses adjusted also for area of residence (North–West, North–East, Center, South), household economic resources (two categories: excellent or adequate, scarce or absolutely insufficient), smoking (0, 0.1–10, 10.1–20, 20.1–30, > 30 pack-years), BMI (normal or underweight, overweight, obese), leisure time physical activity (LTPA) (no activity, light, regular, intense activity), hypertension (yes/no), and diabetes (yes/no) at baseline. In TLS 2001 and 2011, information on behavioural and biological risk factors for CVD was lacking, but it was possible to further control the analyses for an area deprivation index at the census tract level (Rosano et al. 2021). The health indicator used as a covariate in the analyses on ILS 2005 was the Physical Component Summary, obtained from the SF-12 questionnaire (Ware et al. 1996; Apolone et al. 2001), whereas that used for the analyses on TLS 2001 and TLS 2011 was the Charlson index (Quan et al. 2005), constructed at baseline from cause-specific hospitalizations of the cohorts during the years 1997–2001 and 2007–2011, respectively.
In the analysis of the TLS 2011 cohort, cumulative exposure was treated as a time-varying variable, for which it was estimated the risk of developing the outcome in a certain year of follow-up according to the cumulative exposure occurred until the end of the previous year. In this cohort there was also information about part-time work, which was used to weight cumulative exposure, as well as on having multiple jobs simultaneously, for which exposure was averaged across the different jobs. Periods of unemployment were assigned zero exposure.
Because, especially in ILS 2005 and TLS 2001 data, there was a strong correlation between educational level and exposure to the Ergo-index (ILS 2005: men Spearman rho = 0.55, women rho = 0.51; TLS 2001: men rho = 0.58, women rho = 0.43), there was concern that including both of them in a single regression model could have produced risk estimates affected by multicollinearity, with the possible consequence of an artificial underestimation of the coefficients and of an overestimation of their standard errors (Vatcheva et al. 2016). Therefore, in a first analysis (Model 1) education was not included among covariates, but an adjustment for this variable was performed only in a subsequent analysis (Model 2). Only for ILS 2005, a further analysis included among covariates also the lifestyles and the biological risk factors for CVD described above (Model 3). Trends in risks across Ergo-index quartiles were estimated treating quartiles as continuous variables.
All models were adjusted for health status at baseline, assuming a confounder’s role of health rather than a mediator one on the association between OPA and mortality or CVD, to keep a conservative approach on the possible impact of OPA on the health outcomes. However, a preliminary analysis of the correlation between exposure to OPA and health scores (PCS or Charlson Index) showed that it was quite low (Sperman rho < 0.10 in all cohorts in both genders), so it was expected that the adjustment for health had little influence on the associations investigated.
A Directed Acyclic Graph (DAG) on the hypothesized relationships among the variables included in the analyses on OPA and CVD in ILS 2005 (as this is the cohort for which more covariates were available), is presented in Supplementary Fig. 1.
In the light of the reported effect modification by LTPA of the association between OPA and mortality or CVD risk in the literature, in the ILS 2005 cohort we also tested the interaction between OPA and LTPA dichotomized (no physical activity; light, regular or intense physical activity) in fully adjusted models and performed analyses stratified by LTPA.
Given that the two TLS cohorts were partially overlapping, a sensitivity analysis was also performed on the TLS 2001 cohort after excluding subjects present also in the TLS 2011 cohort.
For all analyses, associations with p values below 0.05 (two-tails) were considered statistically significant.
留言 (0)