
記住我
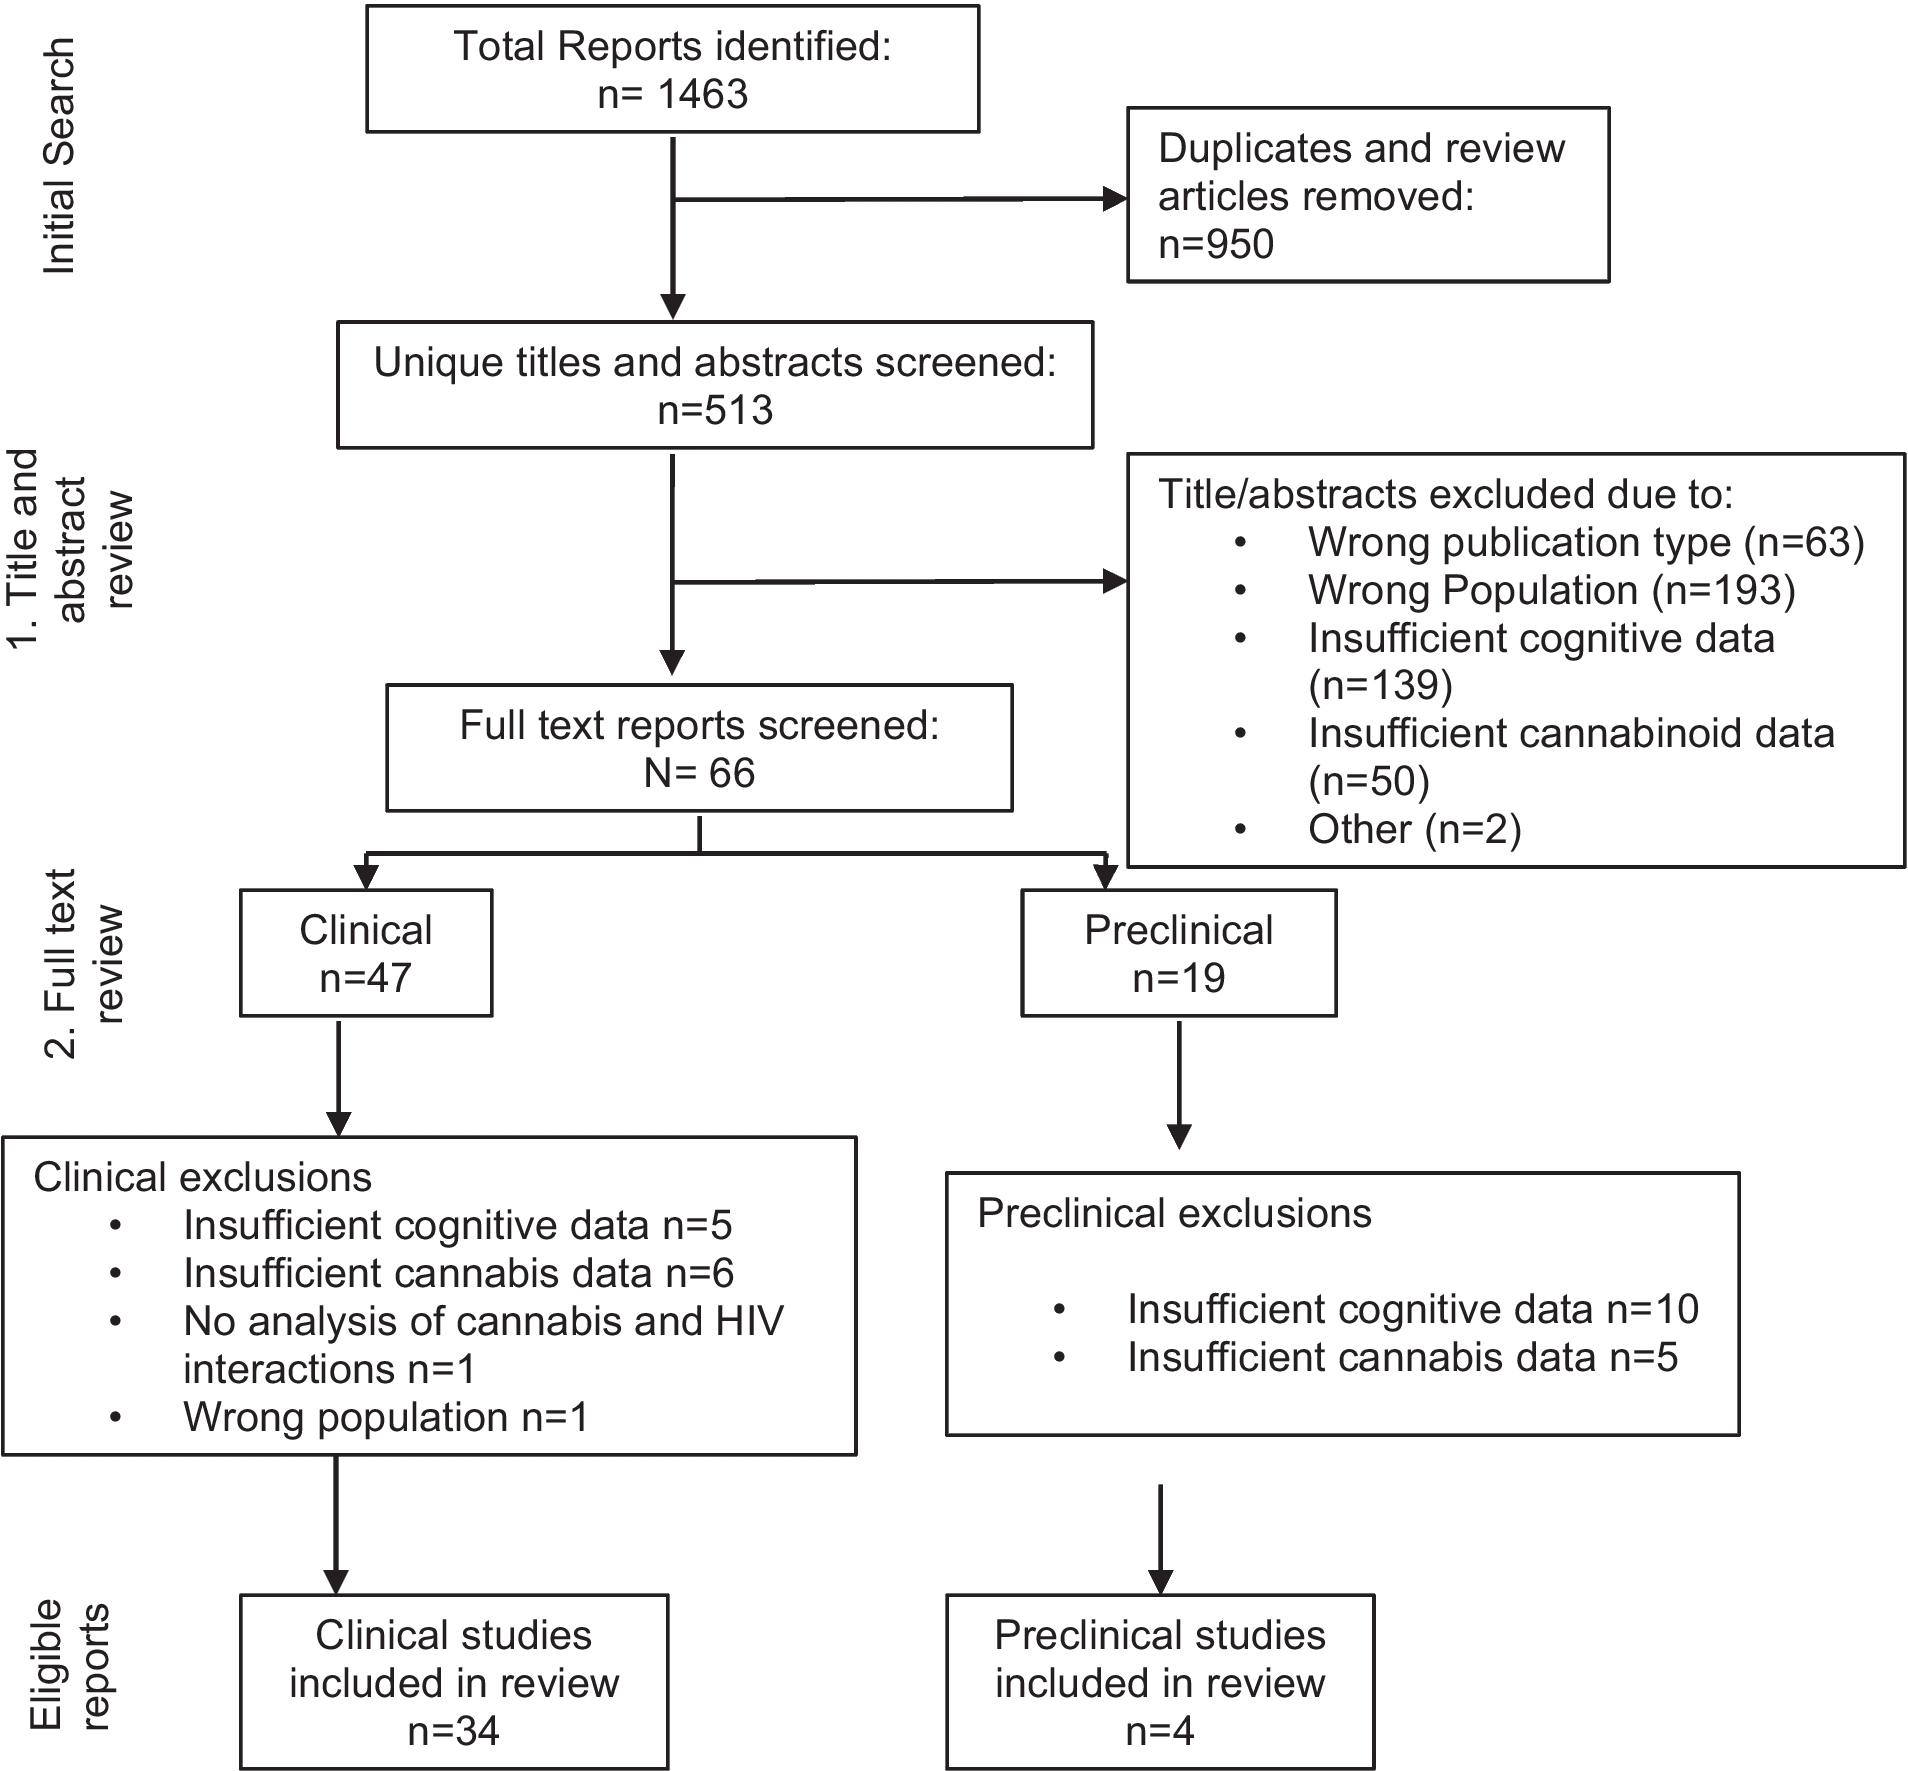
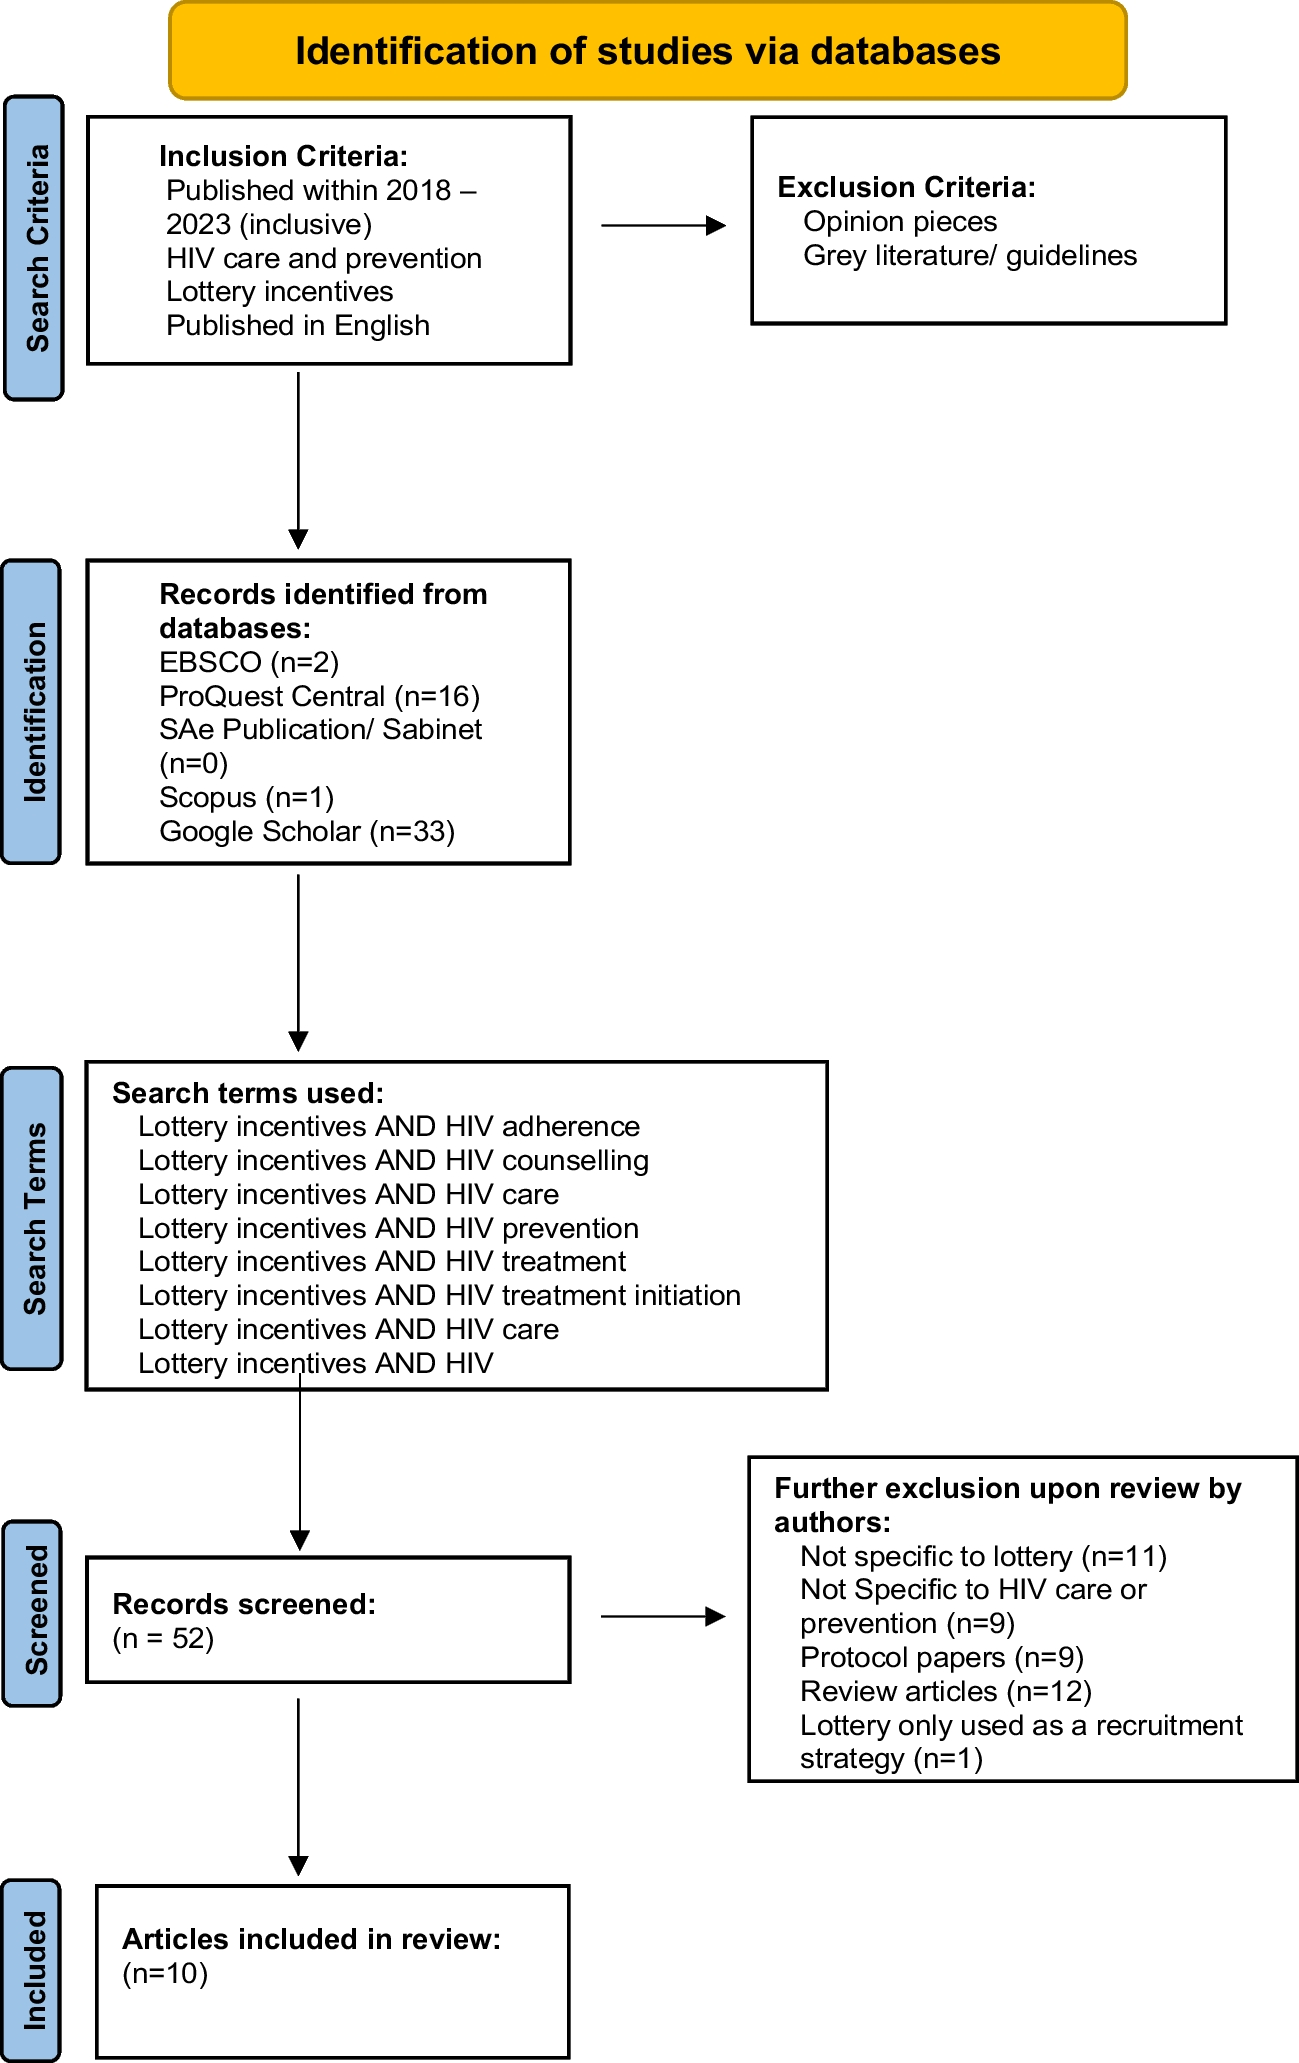

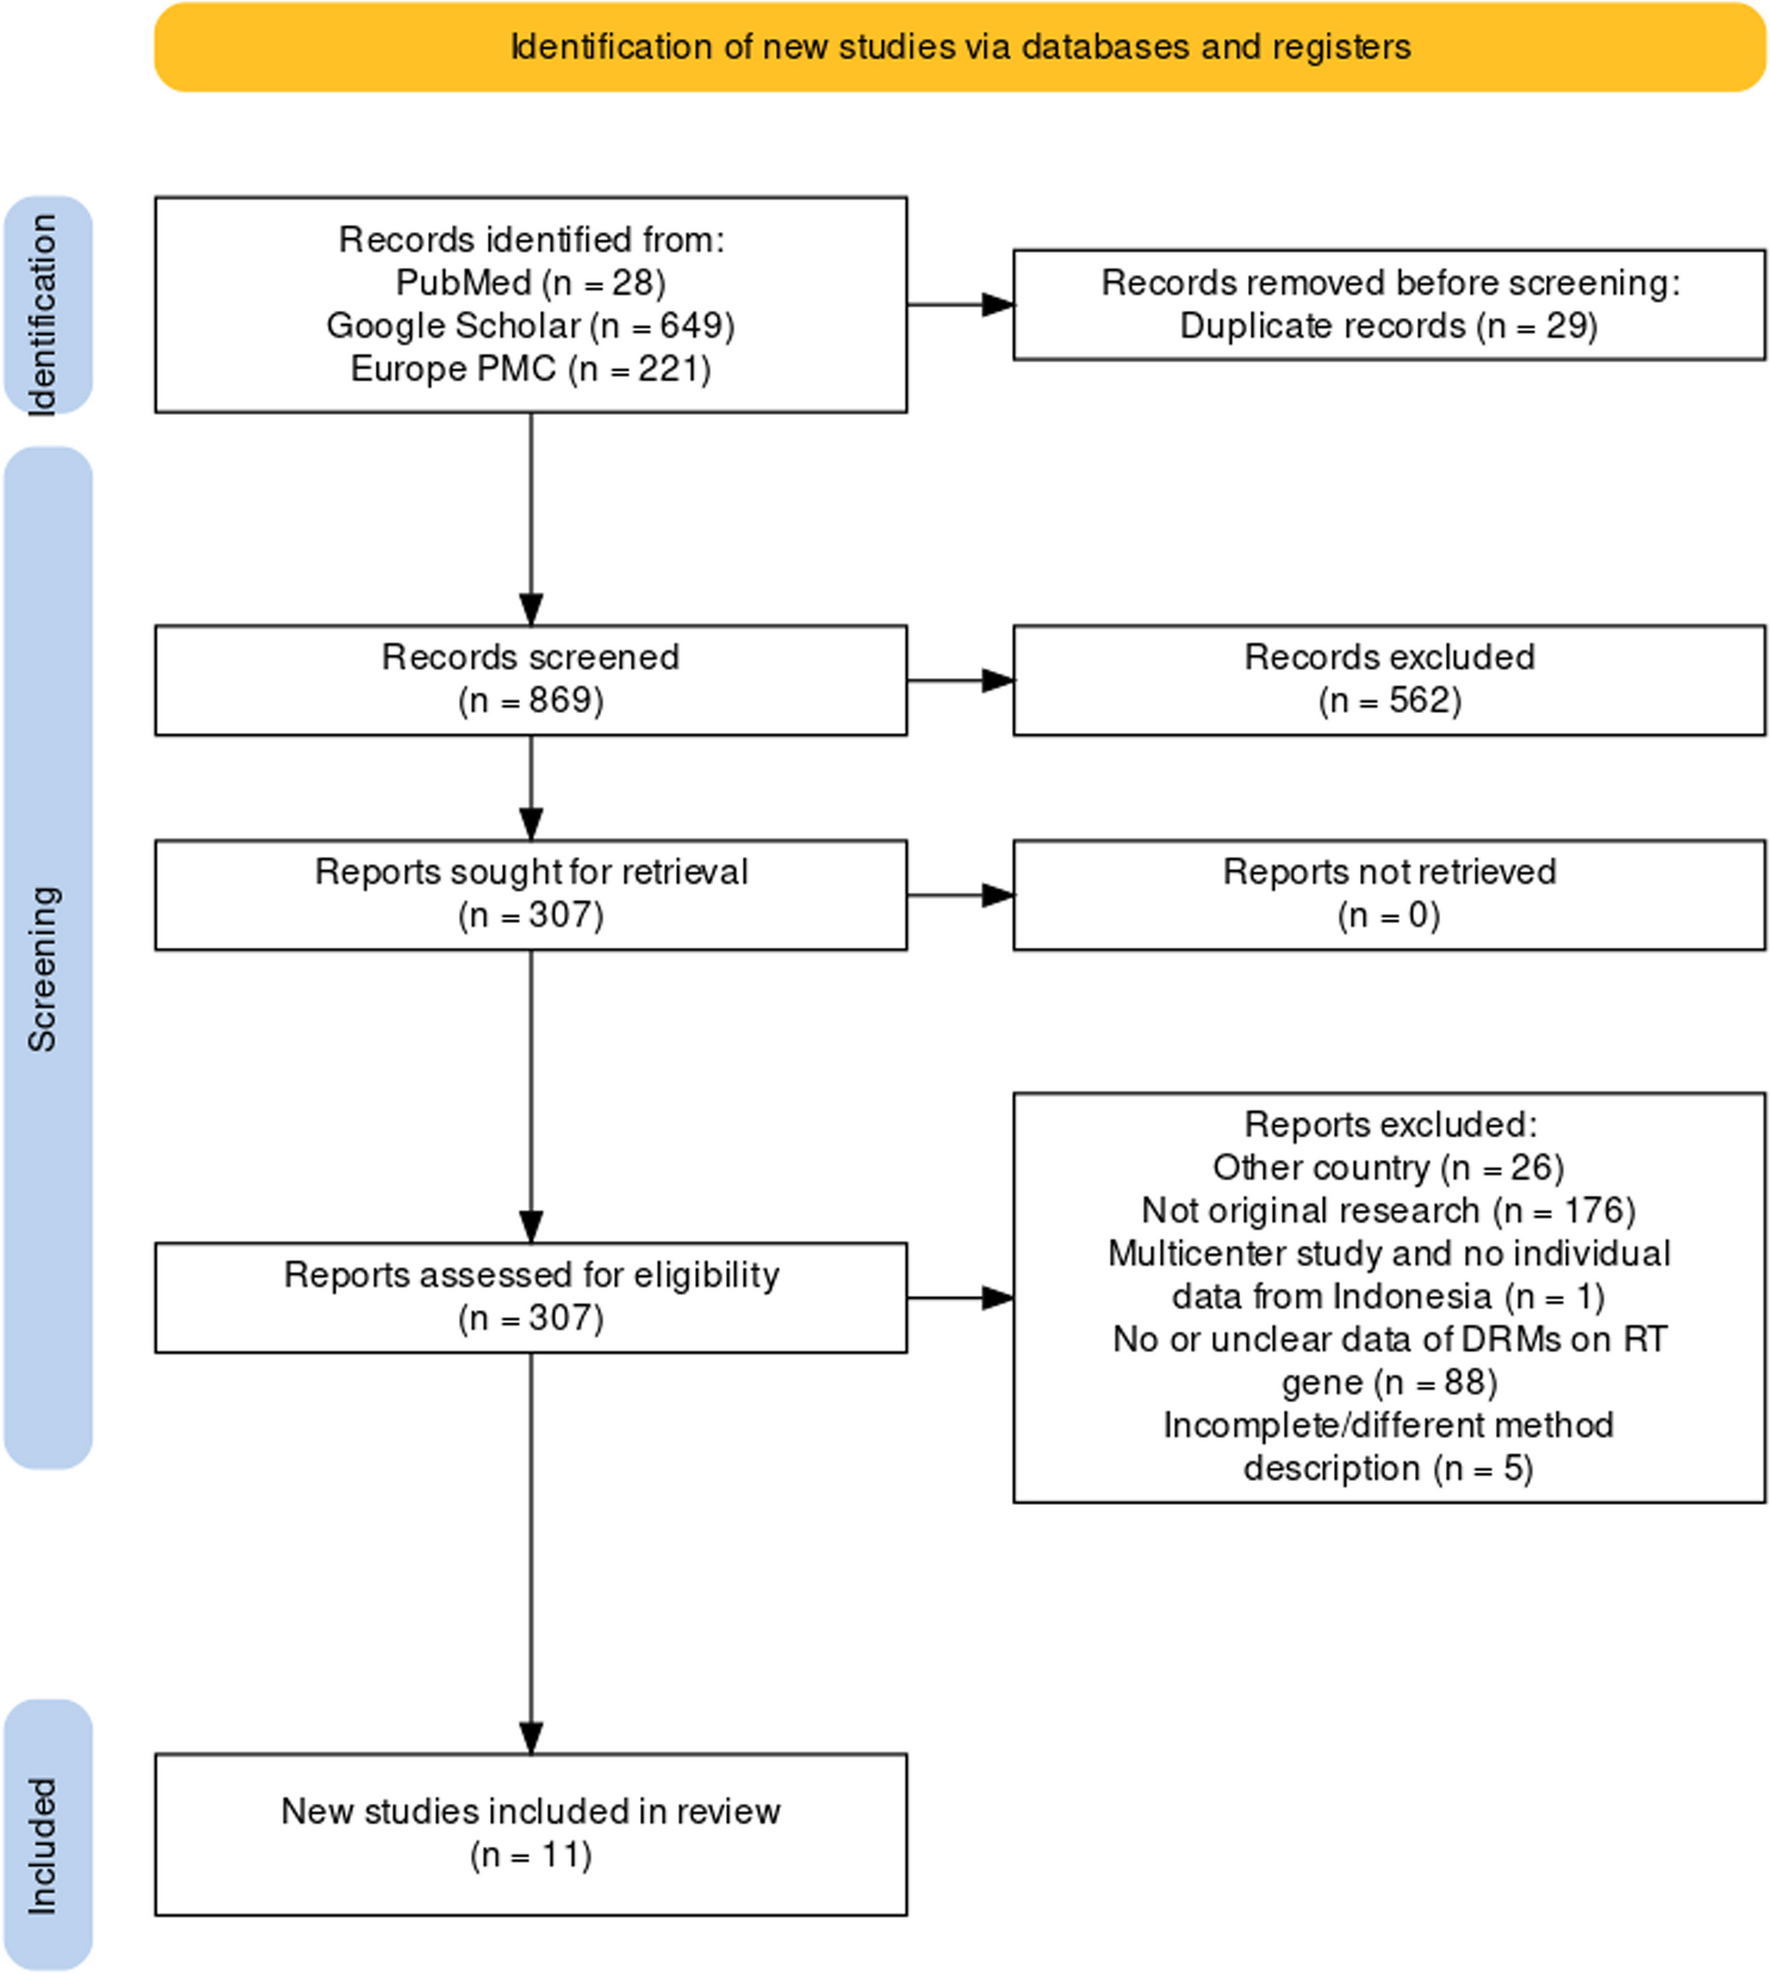

Figure 1 depicts the results of the screening and article selection process as a PRISMA flowchart [20]. As a result of our keyword search, we identified 112 articles, 65 of which were duplicates or non-English and were therefore removed. In total, 44 articles underwent full text screening, after which 19 were excluded for being not relevant. An additional 14 articles were identified from references or expert recommendation, yielding a total of 39 articles included in this review. The full list of relevant studies is provided in Supplemental Table 1.
Fig. 1 Study Sample
The articles included in the sample were published between 2013 and 2023. Approximately half of the articles (n = 20) had been published in the last 4 years (2020 to 2023). The geographic distribution of the included studies was biased toward North America (n = 19), nearly all of which were conducted in the USA. The remaining 20 articles focused on the HIV epidemic in Sub-Saharan Africa (n = 6), South and East Asia (n = 5), Russia (n = 2), and Brazil (n = 1). Six more articles were agnostic to geography. Finally, 12 studies paid unique attention to high-priority subpopulations, including MSM (n = 10), transgender women (n = 2), people who inject drugs (n = 2), and youth and young adults (n = 1).
Study CharacteristicsStudy characteristics are summarized in Table 3, which also includes reference numbers for the studies that possess each characteristic.
Table 3 Characteristics of the studies reviewed (n = 39)Sources of Digital DataFour types of digital data were leveraged in the studies we reviewed, including social media data (53.8%), web search queries via Google, Yandex, and Baidu (25.6%), mobile phone data (15.4%), and data from global positioning system (GPS) devices other than mobile phones (5.1%). Of the 21 studies that analyzed social media data, 17 examined publicly available data on Twitter. Exceptions to this were two studies by Young et al. [21,22•] that drew exclusively on Facebook data collected with consent from a cohort of sexual minority men, and one study each that leveraged data from Reddit [23] and Baidu Tieba [24], a Chinese social media platform. Three more studies incorporated data from multiple platforms [25,26,27] (i.e., various combinations of data from Twitter, Reddit, Instagram, YouTube, and Tumblr). Irrespective of the platform, 20 of the 21 social media studies analyzed post content. Far fewer examined alternative sources of information, such as social relationships among users, hashtags, or URLs. Among the six studies that leveraged mobile phone data, all but one used that data to map human spatial mobility [28•, 29,30,31,32]. The exception was a study by Kapur et al. [33] that used digitally extracted cell phone contact lists of a sample of high-risk men in India and information about those contacts’ sex behaviors to infer respondents’ sexual risk behaviors.
Epidemiological PurposeWe identified four epidemiological needs met by analyses of digital data: disease surveillance (38.5%), behavioral surveillance (20.5%), surveillance of public attention and sentiment (30.8%), and characterization of social contexts (10.2%). Studies designed to meet disease surveillance needs are those that drew on digital data sources to locate and describe HIV burden, to monitor trends in that burden, or to identify HIV outbreaks. For example, Mavragani et al. [34] used search traffic data from Google Trends to forecast AIDS prevalence in US states. Studies with a behavioral surveillance focus drew on digital data with the intention of monitoring behavioral risk factors associated with HIV, such as sexual and drug use behaviors. As an example, Young et al. [22•] demonstrated person-centered associations between Facebook communication themes and patterns of friendship connections and self-reported sex drug use and condomless sex behavior. Other studies used digital data to characterize public attention to HIV with the future goal of being able to utilize those insights to inform health messaging and intervention. For example, Chiu et al. [35] examined the relationship between HIV/AIDS related news coverage and HIV/AIDS related web search queries in Hong Kong, demonstrating windows of opportunity for health agencies to engage in timely health messaging. Finally, several studies used digital data to characterize social contexts associated with HIV prevention and risk behaviors, for example Duncan et al.’s [36, 37] use of geolocation data to map the activity spaces of sexual minority men in the Deep South and New York City with the goal of informing intervention opportunities in these high prevalence regions.
External DataMost articles (71.8%) used ground truth data (i.e., information that is known to be real or true, provided by direct observation and measurement) in their analyses, for example HIV surveillance reports published by the CDC, data aggregators like AIDSVu, clinical data (e.g., lab results), and behavioral surveys. For example, Stevens et al. [38] used the CDC AtlasPlus data platform to obtain estimates of new HIV infections at the county-level and U.S. Census and American Community Survey data to characterize the relationship HIV incidence and risk-specific Twitter activity while adjusting for county-level sociodemographic traits.
Outcome MeasuresThirty of the 39 studies included outcome measures. Three types of outcomes were identified. The first type was an observed measure of health status or health behavior. Most common in this category of outcomes were aggregate measures of HIV incidence, diagnosis, or prevalence (53.3%). However, three studies examined outcomes related to HIV prevention and care engagement, namely HIV testing [30, 39] and a status neutral measure of linkage to care [22•], and two more studies examined self-reported sex behaviors [22•, 33]. The second type of outcome was a feature of the digital data itself, including features of social media posts or web search queries (30.0%) or the structure of digitally instantiated networks (10.0%). For example, Cuomo et al. [40•] built a classifier using routinely collected demographic data to accurately predict the occurrence of risk-related tweets at the census block level during the 2015 HIV outbreak in Indiana. And, a study by Young et al. [21] modeled digital connections among sexual minority men in relation to their HIV prevention and risk behaviors to identify viable clusters for intervention. Finally, two pilot studies [30, 36] also assessed feasibility and acceptability outcomes related to a novel digital measurement procedure. For example, Nsabimana et al. [30] assessed the feasibility of using a mobile phone app to track HIV test results in real time and with geospatial context in urban and rural locations in Rwanda.
Analytic PurposeOur analysis revealed four types of analytic purposes: describe (17.9%), explore (38.6%), explain (17.9%), and predict (25.6%). Descriptive studies aim to characterize a population, situation, or phenomenon with empirical data, often by reporting distributions of one or more variables. Here, descriptive studies often characterized HIV-related digital content, most notably search queries or social media posts. For example, Cai et al. [41] used natural language processing (NLP) techniques to characterize geotagged user-generated Twitter messages related to opioid abuse, injection drug use, and HIV status during the 2015 HIV outbreak in Indiana and reported frequencies of tweet themes and the geographic distribution of opioid, heroin, and HIV tweets across counties in Indiana.
Exploratory studies investigate new or under studied phenomena and often lay groundwork for more hypothesis-driven research in the future. Two types of exploratory studies emerged from our analysis. The first type advanced the prototypical descriptive study that simply characterized HIV-related social media or web search query content by correlating the prevalence of that content with metrics of HIV prevalence, incidence, or infection in a specific region. For example, Dong et al. [24] examined HIV-related posts on the Chinese Baidu Tieba platform, created word clouds and codified themes to understand the needs of people living with HIV/AIDS, and assessed relationships between word cloud geolocations and the prevalence of MSM living with HIV/AIDS in local provinces. The second type of exploratory study assessed the feasibility of a particular digital epidemiological approach. As an example, drawing on a large annotated set of Tweets about HIV risk, Young et al. [42] tested the feasibility of using machine learning classifiers to learn patterns of speech and language associated with HIV risk behaviors with the future goal of finding ways to incorporate these models into real-world HIV surveillance systems.
Explanatory studies aim to explain why or how a previously studied phenomenon takes place by establishing underlying causes of the phenomenon or the systematic relationships among variables [43]. Two types of explanatory studies emerged. The first type was theory-driven, in that the selection of key variables in the model was driven by a theoretical framework. For example, Ireland et al. [44•] drew on theory from personality psychology to investigate the relationship between the use of action language in Twitter posts aggregated at the US county level and HIV prevalence, and Park [45] applied a socio-technical and digital equity framework to examine regional differences in the relationship between HIV-related information seeking by US Metropolitan area and HIV prevalence. The second type of explanatory study in this review was less theory-driven but nonetheless focused on mechanisms. For example, Isdory et al. [29] drew on mobile phone data to determine the effect of human spatial mobility between regions in Kenya on HIV transmission.
Finally, predictive studies draw on historical or current data to predict a future phenomenon. Key features of predictive studies are predictors that precede the outcome in time and evaluations of how well the predictive model performs in out-of-sample predictions [46]. Moreover, in the era of “Big Data,” predictive models increasingly feature large numbers of features (or predictors) as the objective is to increase the predictive accuracy of the model as opposed to testing specific hypotheses. As an example of this approach, Brdar et al. [28•] extracted over 200 features from spatial mobility and connectivity traces from mobile phone service data and used them to train and test a machine learning regression model to predict HIV prevalence rates in Ivory Coast. And Young et al. [47•] tested and trained a machine learning regression model to predict HIV diagnoses at the US state level with search volume data on HIV-related Google search keywords.
Analytic MethodsA variety of analytic techniques were used, ranging from basic descriptive statistics to advanced machine learning. Overall, a majority of studies (51.3%) used regression analyses, of which linear, negative binomial, and multi-level (mixed effects) models were most common. To account for the role of geography, two studies [48, 49•] used geometrically weighted regression, a modification of traditional regression that can account for geographic variability in the relationship between HIV health outcomes and digital content.
Additionally, several studies drew on specialized modeling approaches, such as network modeling (15.4%), topic modeling (7.7%), and disease modeling (5.1%). In total, seven studies leveraged social network methods to construct and analyze network contexts of HIV risk and transmission, for example, as Valdano et al. [31] did in their study of risk flow networks underlying the HIV epidemic in Namibia. Four studies used topic modeling to detect patterns in social media posts. As an example, Xu et al. [27] used the Biterm Topic Model to detect and characterize barriers to pre-exposure prophylaxis (PrEP) therapy from a large corpus of social media posts across multiple platforms. And, two studies incorporated digital data into compartmental models, the workhorses of infectious disease modeling. For example, Isdory et al. [29] built an SIR metapopulation model parameterized using census data, HIV data, and mobile phone data adopted to track human mobility.
Finally, given the volume and complexity of data that many studies featured, 30.8% of studies used modalities of machine learning, most notably in the form of machine learning classifiers, prediction models, and unsupervised topic models. For example, Adrover et al. [50] drew on boosted decision tree, support vector, and artificial neural network classifiers to identify Twitter posts that conveyed adverse effects of HIV drug treatment. And Zhang et al. [51] trained and tested nowcast and forecast models to estimate the number of new HIV diagnoses in China with web search query data and historical records at the national and provincial levels.
Consideration of Digital EthicsOverall, eight (20.5%) studies included an explicit discussion of the ethical considerations authors made when using user-generated digital data in their study. The most robust of those discussions came from Weibel et al. [52•]. Following their presentation of research, which aimed to identify HIV at-risk populations by exploiting Twitter post, geolocation, and social network data, Weibel et al. walked the reader through their own reflection on the ethics of using social media data for HIV risk research. In this reflection, they outlined the considerations pertaining to data collection and analysis, making model-driven inferences, and designing data-driven interventions.
留言 (0)