
記住我


The mean-field model (13)–(15) and the spiking network model (21)–(22), with biophysical parameter values given in Table 1, are used here to investigate how the overall balance of excitation and inhibition in cortical networks is affected by variations in some of the important physiological and structural factors of the network. We first show that the mean-field model with baseline parameter values is balanced with an activity rate typically observed in asynchronous irregular regimes, and is very responsive to changes in external inputs. We then perform the numerical analysis described in Section 2 and present how the network balance is affected by changes in key synaptic and structural parameters. We discuss the results and their biological implications in Section 5.
4.1 The baseline balanced stateIn order to investigate the effect of different synaptic and network parameters on the overall balance of excitation and inhibition, as described in next sections, it is important to first establish a reference balanced state for the network. Here, we demonstrate that the choice of baseline biophysical parameter values discussed in Section 3 results in a balanced state in the mean-field network activity, noting that our interpretation of the presence of overall balance in a network is based on observing the typical balanced network properties we described in Section 1. For this, we solve the mean-field Eqs. (13)–(15) with the baseline parameter values given in Table 1. The transfer functions used in (13)–(15) are given by (11), with their arguments being computed using (1)–(10), (12), and the fit parameters given in Tables 2 and 3. We drive the network with excitatory background inputs of constant mean frequency \(r^ }_\textsc }(t) = r^ }_\textsc }(t) = 1 \text \), which presents a background activity at a level typically observed in irregularly spiking excitatory neurons at a cortical resting state (Markram et al., 2015).
Simulation of the mean-field model with the baseline setup described above identifies a stable equilibrium in the dynamics of the network, to which the mean-field activity of the network converges quickly. As we discussed in Section 1, computing the (mean) value of the important biophysical quantities of the network at this mean-field steady-state can provide a reasonably accurate estimate of the overall level of excitation and inhibition in the network. At this steady state, the excitatory neurons of the baseline model fire at the mean rate \(p_} = 1.15 \text \), and the inhibitory neurons fire at the mean rate \(p_} = 5.71 \text \). These rates of activity are close to the average excitatory firing rate of 1.09 Hz and inhibitory firing rate of 6.00 Hz obtained in a detailed simulation of the rat neocortical microcircuitry, when the constructed network is presenting balanced activity in an asynchronous irregular regime (Markram et al. (2015), Fig. 17); see also Renart et al. (2010). Moreover, our simulation of the spiking neuronal network that we construct equivalently to the mean-field model, as described in Section 3, further confirms the presence of asynchronous irregular neuronal activity in the baseline model; see the rastergram shown in Fig. 11a.
It is shown in the literature that excitatory and inhibitory synaptic conductances in the intact neocortex are well-balanced and proportional to each other (Haider et al., 2006). Using (5) and (6), the mean value of excitatory and inhibitory synaptic conductances at the mean-field network equilibrium described above are calculated for the excitatory population as \(M_ }_\textsc }} = 8.7 \text \) and \(M_ }_\textsc }} = 37.0 \text \), which are also equal to the values obtained for the inhibitory population. These mean conductance values are comparable to the experimentally measured values provided by Haider et al. (2006). They give an excitatory to inhibitory mean conductance ratio of \(M_ }_\textsc }} / M_ }_\textsc }} = 0.235\), which is consistent with the experimental findings that imply inhibitory conductances are much larger than excitatory conductances (Rudolph et al., 2005; Le Roux et al., 2006; Haider et al., 2013). It should be noted that the significantly larger conductance ratios reported in some experimental works, such as the approximate ratio of 1 given by Haider et al. (2006), are most likely due to the deeply anesthetized preparation of such experiments, which is known to significantly affect the level of inhibition in cortical networks (Haider et al., 2013). Therefore, in our analyzes provided in next sections, we consider the ratio \(M_ }_\textsc }} / M_ }_\textsc }} = 0.235\) as a reference for the steady-state value of the balanced conductance ratio—with respect to which we measure the level of deviations in the overall network balance towards more excitation (larger ratio) or more inhibition (smaller ratio).
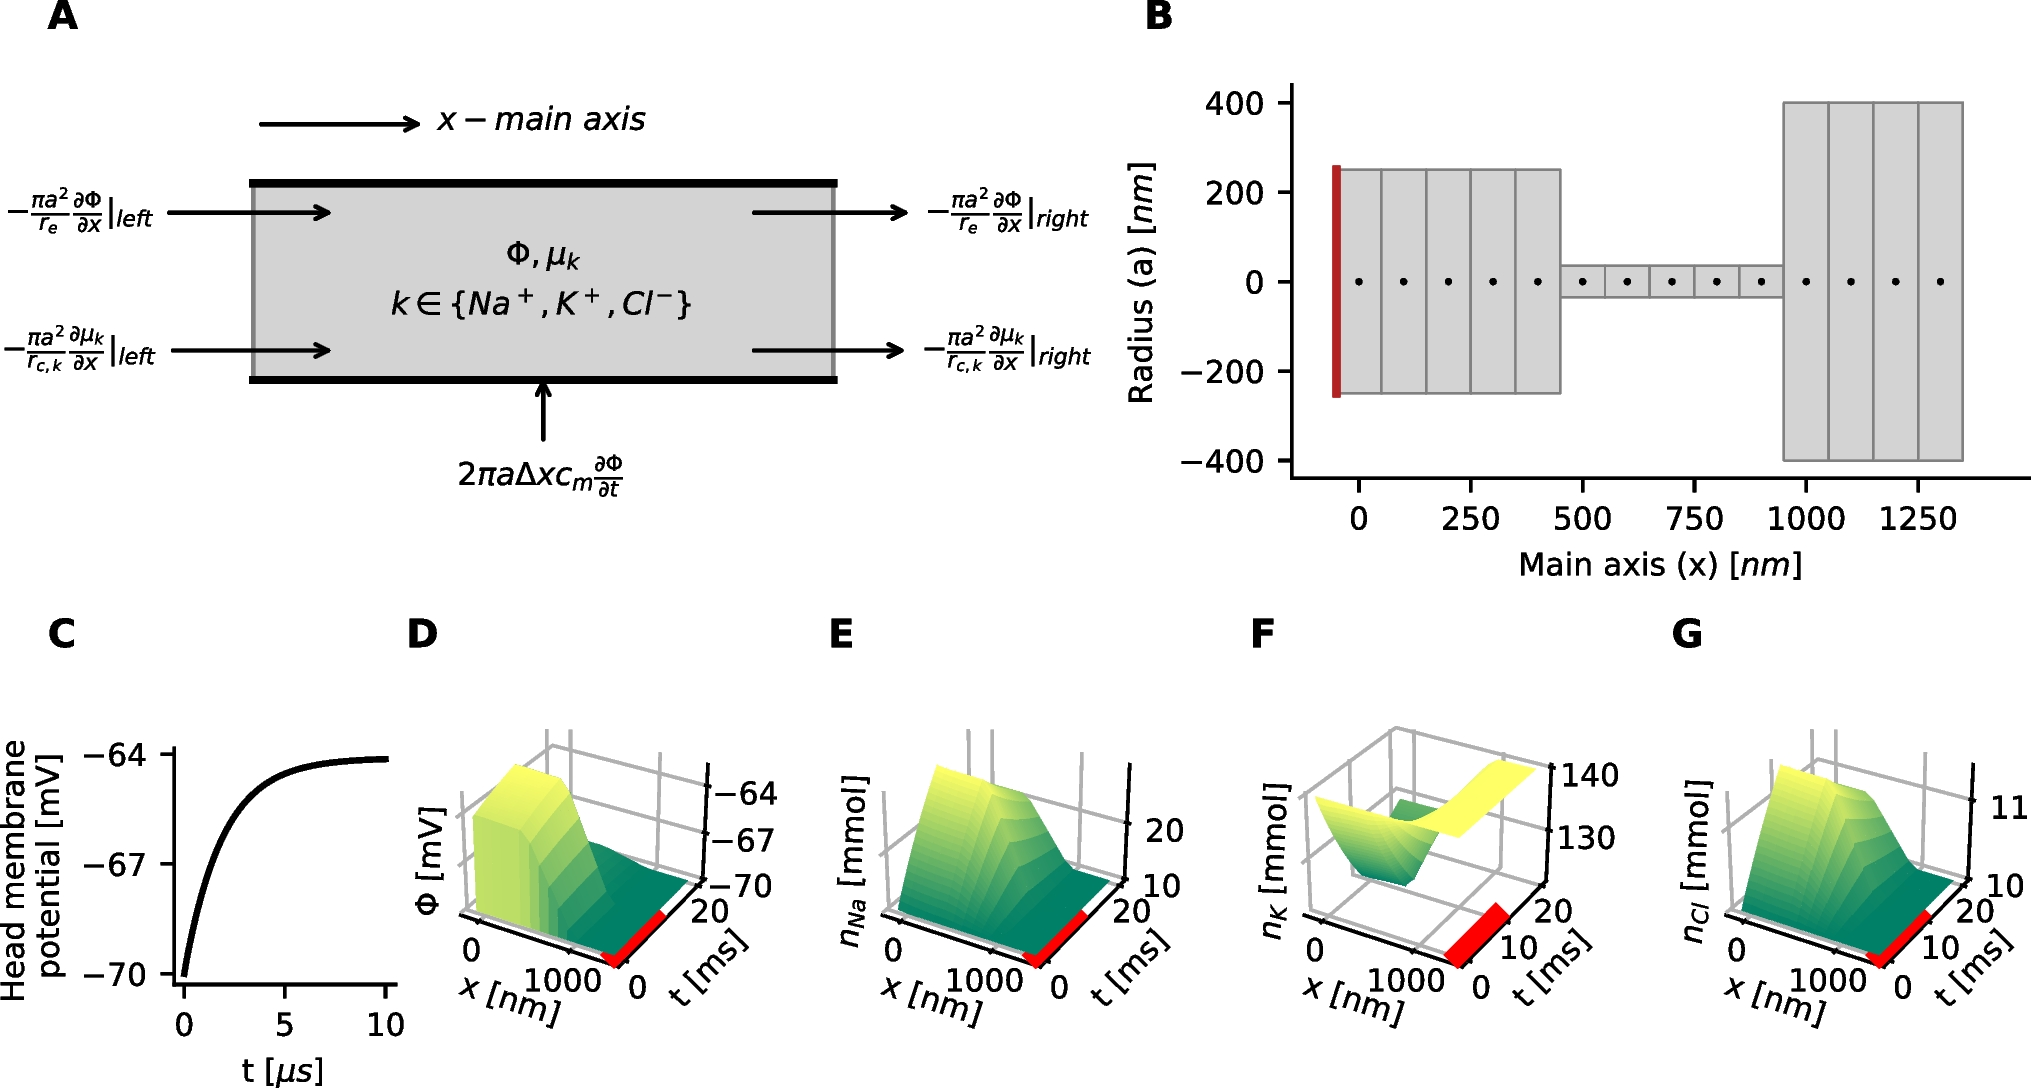
Experimental observations suggest that the dynamic balance of excitation and inhibition in local cortical networks keeps the neurons of the network in a depolarized state near their firing threshold, so that the network can be rapidly activated by external excitatory inputs and become involved in specific computational tasks (Haider et al., 2006; Landau et al., 2016). To ensure that the baseline balanced state in the mean-field model indeed corresponds to such a state of highly responsive network activity, we simulate the model with the same baseline parameter values as before, but with different values for the constant mean frequency of the excitatory inputs, \(r^ }_\textsc } = r^ }_\textsc }\). The resulting steady-sate values for different descriptive biophysical quantities of the model, obtained at the stable equilibrium of the equations for each input frequency value, are shown in Fig. 1. First, it can be seen in Fig. 1 that all biophysical quantities of the model, such as the mean firing rates, mean excitatory adaptation current, mean value and standard deviation of membrane potentials, and mean synaptic conductances take biologically reasonable values as the input frequency varies over a wide ranges of values. Second, the variation profile of the mean firing rates \(p_}\) and \(p_}\) shown in Fig. 1a indicates that the overall activity of the neurons at the baseline background input frequency of 1 Hz, which is marked by dots in the graphs shown in Fig. 1, is indeed close to the firing threshold of the neurons. Last, relatively sharp changes in the mean firing activity of the neurons in response to different levels of excitatory input stimuli indicates that the baseline network is in a sufficiently responsive state. Moreover, although not shown here, our simulation results also verify that the mean-field dynamics of the network with baseline parameter values is sufficiently fast in responding to rapid fluctuations in the external inputs. A sample of the network firing response to fluctuations of approximate frequency 10 Hz is shown in Fig. 10a. Such rapid responses are also observed to fluctuations as fast as 20 Hz.
Fig. 1
Steady-state mean-field activity with respect to variations in the mean frequency of the external inputs. All parameter values of the mean-field model are set to their baseline values given in Table 1. The model is driven by external inputs of different mean frequency \(r^ }_\textsc } = r^ }_\textsc }\), and the resulting steady-state values of different network quantities are shown in the graphs. The points marked by dots in the graphs correspond to the baseline mean input frequency of 1 Hz, which we considered as the level of background input to the mean-field model. a Mean excitatory firing rate \(p_}\), mean inhibitory firing rate \(p_}\), ratio between the mean firing rates \(p_}/ p_}\), and the mean excitatory adaptation current \(w_}\). b Excitatory membrane potential \(V_}\) and inhibitory membrane potential \(V_}\) of the neurons. Solid lines indicate the mean values \(M_}}\) and \(M_}}\) of the membrane potentials, and shaded areas indicate variations in the membrane potentials within a range of one-standard deviation (\(S_}}\) and \(S_}}\)) from the mean values. c Mean synaptic conductances \(M_ }_\textsc }}\), \(\textsc \in \, \textsc \}\) of the excitatory population, and the ratio between the two conductances. Mean synaptic conductances of the inhibitory population take the same values as those of the neurons of the excitatory population
The mean inhibitory activity in the model rises in parallel to the mean excitatory activity as the mean frequency of external excitatory inputs increases to larger values beyond the background value. However, the results shown in Fig. 1 imply that the neuronal interactions throughout the network control the overall level of inhibition in the network at a level that still allows for an elevated level of overall excitation—which is necessary for the network to be able to perform the processing task demanded by the external stimuli. This results in a change in the overall balance of excitation and inhibition toward higher excitation, as observed through the increase in the ratio between mean excitatory and inhibitory synaptic conductances, shown in Fig. 1c. Nevertheless, the level of inhibition in the network remains sufficiently strong to prevent network instability and hyperactivity when the network receives an excessive amount of excitatory inputs from other cortical regions.
The observations made above confirm that our mean-field model with the baseline parameter values and background external inputs of mean frequency 1 Hz represents a network at a well-balanced state of overall excitation and inhibition. At this state, the network stays in an asynchronous irregular regime and is highly responsive to external cortical inputs, without undergoing internal instabilities when the level of external excitation increases. Therefore, we choose this state as the baseline balanced state of the mean-field model, and use it as a reference state to study how such a balanced state is disturbed by changes in the values of physiological and structural parameters of the network.
4.2 Synaptic contributors to the balance of excitation and inhibitionThe kinetics of synaptic activity in the conductance-based model we use here is governed by three main physiological factors, namely, synaptic decay time constants, synaptic quantal conductances, and synaptic reversal potentials. Variations in these physiological factors directly change the efficacy of synaptic communications between the neurons and hence have substantial impact on the dynamic balance of excitation and inhibition across the network. We investigate such impacts by showing how the steady-state balance between excitatory and inhibitory synaptic conductances—obtained at the stable equilibrium of the baseline mean-field activity described above—is affected by variations in each of these synaptic factors. In particular, we identify critical states of imbalanced activity which result in the loss of stability of the network equilibrium and lead to transition of the network dynamics to an oscillatory regime.
Fig. 2
Variations in the response curves of neurons as a result of changes in synaptic parameters. For all graphs, the mean inhibitory spike rates received by both populations are fixed at the typical value \(r_\textsc } = r_\textsc } = 6 \text \). The mean excitatory spike rate received by each population is varied over a plausible range of values to obtain each neuronal response curves \(F_}\), \(\textsc \in \, \textsc \}\), which are calculated using (11) and the fit parameters given in Table 3. All parameter values involved in the calculation of \(F_}\), except those specified on each graph, take their baseline values as given in Table 1. Thick curves in each graph show the response curves obtained at baseline synaptic parameter values. Other curves in each graph illustrate variations in the shape of the response curves as a synaptic parameter changes. Arrows indicate variations corresponding to 10 evenly distributed incremental changes in the parameter values specified in each graph. The color gradient used in each graph also indicates these incremental changes, with the darkest colored curve corresponding to the smallest value of the parameter, and the lightest colored curve corresponding to the largest value of the parameter. a Response curves with respect to variations in inhibitory (shown on the left side of the panel) and excitatory (shown on the right side of the panel) synaptic decay time constants. The value of \(\tau ^ }_\textsc } = \tau ^ }_\textsc }\) is varied from 5 ms to 18 ms, and the value of \(\tau ^ }_\textsc } = \tau ^ }_\textsc }\) is varied from 1 ms to 3 ms. b Response curves with respect to variations in inhibitory and excitatory synaptic quantal conductances. The value of \(\textrm^ }_\textsc } = \textrm^ }_\textsc }\) is varied from 1 nS to 25 nS, and the value of \(\textrm^ }_\textsc } = \textrm^ }_\textsc }\) is varied from 1 nS to 8 nS. c Response curves with respect to variations in inhibitory and excitatory synaptic reversal potentials. The value of \(\textrm^ }_}\) is varied from \(-103\) mV to \(-53\) mV, and the value of \(\textrm^ }_}\) is varied from \(-30\) mV to 20 mV
The dynamics of the mean-field model (13)–(15) are highly dependent on the profiles of the transfer functions \(F_}\) and \(F_}\), which can change significantly if the physiological parameters of the synapses change. Hence, demonstrating the effects of variations in synaptic parameters on the profile of transfer functions (neuronal response curves) helps our understanding of how such variations affect the balance of mean-field activity in the network. Fig. 2 illustrates how neuronal response curves vary with respect to changes in each of the three synaptic parameters we consider here. Variations in the decay time constants of inhibitory synapses, as shown in Fig. 2a, changes the gain (sensitivity) of both inhibitory and excitatory neurons by changing the slope of their response curves. Additionally, such variations also change the excitability of the neurons by horizontally shifting their response curves. Similar effects are observed when the decay time constants of excitatory neurons change, however, with changes in neuronal excitability being less pronounced in this case. Fig. 2b shows that changes in synaptic quantal conductances similarly affect gain and excitability of the neurons, with a higher sensitivity of the response curves being observed with respect to variations in excitatory quantal conductances. Changes in the synaptic reversal potentials, as shown in Fig. 2c, significantly alter the gain of the neurons but have a lesser impact on their excitability. Changes in the gain of the neurons when the excitatory synaptic reversal potentials are increased or decreased from their baseline values are pronounced, and occur monotonically. However, gain changes with respect to variations in inhibitory reversal potentials appear to be non-monotonic. At lower output frequency values, both increasing \(\textrm^ }_}\) above its baseline value, and decreasing it below its baseline value, result in an increase in the gain of the neurons.
Local inhibitory sub-networks are known to play a key role in stabilizing the dynamics of local networks and coordinating the flow of activity across cortical areas (Isaacson & Scanziani, 2011; Froemke, 2015; Sprekeler, 2017; Haider & McCormick, 2009; Hennequin et al., 2017; Shadlen & Newsome, 1994). Therefore, in what follows, we initially perform our analysis based on codimension-one continuation of the baseline equilibrium state with respect to variations in each of the inhibitory synaptic parameters. Then, we extend the analysis to codimension-two by additionally considering variations in excitatory synaptic parameters.
4.2.1 Effect of synaptic decay time constantsThe decay time constant of a synapse determines how long the activity initiated in the synapse by an incoming action potential (spike) will last. Hence, the decay time constant has a significant impact on the efficacy of the synapse, which can also be directly implied from the mean synaptic conductance Eqs. (5) and (6). Moreover, changes in synaptic decay time constants also change the standard deviation and autocorrelation time constants of membrane potential fluctuations, as implied from Eqs. (9) and (10). As a result, the transfer functions (response curves) of neurons are highly impacted by variations in the decay time constants, which is confirmed by the results shown in Fig. 2a. To show how the decay time constants of the synapses then impact the global dynamics of the network, and how they contribute to maintaining or disturbing the overall balance of excitation and inhibition, we first continue the stable equilibrium of the baseline balanced network with respect to variations in inhibitory decay time constants \(\tau ^ }_\textsc } = \tau ^ }_\textsc }\). The results are shown in Fig. 3.
Fig. 3
Effects of variations in synaptic decay time constants on the long-term mean-field activity of the network. All parameter values of the mean-field model, except for the synaptic decay time constants that are explicitly specified in each graph, are set to their baseline values given in Table 1. The model is driven by background inputs of constant mean frequency \(r^ }_\textsc } = r^ }_\textsc } = 1 \text \). In graphs a–e, the decay time constants of inhibitory synapses made on neurons of both excitatory and inhibitory populations are set to take the same value, which is varied as the bifurcation parameter. The resulting codimension-one continuation of the network equilibrium and emerging limit cycles are shown for different quantities. Curves of equilibria are shown by solid lines, and the minimum and maximum values that each quantity takes on the limit cycles are shown by dotted lines. Dark-colored segments of each curve indicate stable equilibria/limit cycles, whereas light-colored segments indicate unstable equilibria/limit cycles. Unlabeled dots in each graph correspond to the baseline parameter values \(\tau ^ }_\textsc } = \tau ^ }_\textsc } = 8.3 \text \). Points labeled by H are Hopf bifurcation points. We show bifurcation diagrams for a mean excitatory firing rate \(p_}\) and mean inhibitory firing rate \(p_}\), b mean synaptic conductances \(M_ }_\textsc }}\), \(\textsc \in \, \textsc \}\), of the excitatory population, and the ratio between the two conductances, c absolute value of the mean excitatory synaptic currents, \(|M_ }_\textsc }}|\), \(\textsc \in \, \textsc \}\), as well as the ratio between mean excitatory and inhibitory synaptic currents, and d mean excitatory and inhibitory synaptic driving forces \(|M_}} - \textrm^ }_}|\), \(\textsc \in \, \textsc \}\), in the excitatory population, as well as such driving forces \(|M_}} - \textrm^ }_}|\), \(\textsc \in \, \textsc \}\), in the inhibitory population. e Frequency of the limit cycles originating from the Hopf bifurcation point. f Codimension-two continuation of the Hopf bifurcation point when the excitatory synaptic decay time constants are also allowed to vary as a bifurcation parameter. The point marked by a dot has the baseline excitatory parameter value of \(\tau ^ }_\textsc } = \tau ^ }_\textsc } = 1.7 \text \). Arrows indicate transition from stable (dark) to unstable (light) equilibria as the parameters are varied across the curve
The response curves given in Fig. 2a show that increasing the value of \(\tau ^ }_\textsc } = \tau ^ }_\textsc }\) decreases the gain and excitability of inhibitory and excitatory neurons. As a result, the mean firing rates of both excitatory and inhibitory populations decrease, concurrently, with increasing \(\tau ^ }_\textsc } = \tau ^ }_\textsc }\), as shown in Fig. 3a. This paired variation in the mean firing activity of the populations, however, does not necessarily imply that the overall balance of excitation and inhibition remains unchanged with respect to changes in inhibitory decay time constants. The ratio of the mean excitatory to mean inhibitory synaptic conductances in the excitatory population, \(M_ }_\textsc }} / M_ }_\textsc }}\), shown in Fig. 3b, implies that the excitation-inhibition balance moves toward over-inhibition as the efficacy of inhibitory synapses grows with increasing \(\tau ^ }_\textsc } = \tau ^ }_\textsc }\). Indeed, unlike the profile of the inhibitory firing rate \(p_}\), at large values of \(\tau ^ }_\textsc } = \tau ^ }_\textsc }\) the mean inhibitory synaptic conductance \(M_ }_\textsc }}\) shown in Fig. 3b rises slightly as \(\tau ^ }_\textsc } = \tau ^ }_\textsc }\) increases. It should be noted that mean synaptic conductances in the inhibitory population, \(M_ }_\textsc }}\) and \(M_ }_\textsc }}\), which are not shown in Fig. 2a, take the same values as those in the excitatory population due to the same choices of connection probabilities in our model.
On the opposite direction, decreasing the value of inhibitory synaptic decay time constants increases the ratio \(M_ }_\textsc }} / M_ }_\textsc }}\) and moves the excitation-inhibition balance toward more excitation. The excessive excitation in the network then drives the network’s dynamics to a critical state, at which further reduction in \(\tau ^ }_\textsc } = \tau ^ }_\textsc }\) results in an overall level of excitation that cannot be effectively balanced by the increased level of inhibition. At this critical state, the network’s dynamics undergoes a phase transition to an oscillatory state, identified by a Hopf bifurcation point in the codimension-one continuations shown in Fig. 3. The limit cycle originated from the Hopf bifurcation point has also been continued, and the curves of minimum and maximum values taken by different biophysical quantities of the model on the resulting cycles are shown in Fig. 3. When the inhibitory synaptic decay time constants decrease below the critical value \(\tau ^ }_\textsc } = \tau ^ }_\textsc } = 7.06\) ms, which is the value at which the Hopf bifurcation occurs, the previously stable equilibrium of the model becomes unstable. As a result, the orbits of the system depart the vicinity of the equilibrium and converge to a stable limit cycle on the curves of cycles originated from the Hopf bifurcation. Fig. 3e shows that the stable oscillations on this cycle lie in the delta frequency band (1 - 4 Hz). Moreover, the results of the equivalent spiking neuronal network that we study in Section 4.5 imply that, when the emerging oscillations in firing rates on a limit cycle is of sufficiently large amplitude, the network activity on the limit cycle corresponds to a slow oscillatory bursting regime; see the rastergram in Fig. 11b. Further details on the dynamics of such oscillatory network behavior are provided in Section 2 of the supplementary material (Online Resource).
It should be noted that further continuation of the curves of limit cycles, as partially shown in Fig. 3, detects a fold bifurcation of limit cycles and emergence of unstable limit cycles at low values of \(\tau ^ }_\textsc } = \tau ^ }_\textsc }\). However, analyzing the dynamics of the model at such values is not pertinent to the purpose of this paper. In fact, at such values the mean-field model loses its validity in accurately predicting the emerging dynamic regimes, since the quantity under the square root in (9) approaches negative values. However, our results shown in Fig. S1 in the supplementary material (Online Resource), which are obtained using the spiking neuronal network, imply that the network still presents slow oscillatory bursting activity at an extreme value of \(\tau ^ }_\textsc } = \tau ^ }_\textsc } = 3\) ms, which is below the range of values shown in Fig. 3.
The results shown in Fig. 3d imply that the mean membrane potential of both excitatory and inhibitory populations decreases with increases in the value of \(\tau ^ }_\textsc } = \tau ^ }_\textsc }\). This means that, on average, neurons in the network become more hyperpolarized when the level of inhibition in the network is enhanced by increasing the efficacy of the inhibitory synapses. Since in this study the values of synaptic reversal potentials are kept fixed, the reduction in the mean membrane potential of the neurons due to an increase in \(\tau ^ }_\textsc } = \tau ^ }_\textsc }\) yields a reduction in the mean electrochemical driving force of the inhibitory synapses in both populations, \(|M_}} - \textrm^ }_}|\), \(\textsc \in \, \textsc \}\), and a rise in the mean driving force of the excitatory synapses, \(|M_}} - \textrm^ }_}|\), \(\textsc \in \, \textsc \}\). The curves of the equilibrium driving forces shown in Fig. 3d illustrate such profiles of variations.
The absolute values of the mean synaptic currents at the equilibrium, calculated using (16) and (17), are shown in Fig. 3c. As discussed above and illustrated in Fig. 3b and d, the steady-state values of the two contributing components of these currents, the mean synaptic conductances and the mean synaptic driving forces, change in opposite directions with increases in \(\tau ^ }_\textsc } = \tau ^ }_\textsc }\). The combination of these two components, however, results in steady-state mean synaptic currents which decrease in absolute value as \(\tau ^ }_\textsc } = \tau ^ }_\textsc }\) is increased, as we can see in the curves of equilibria shown in Fig. 3c; note that inhibitory currents are not shown separately in Fig. 3c as their profile is similar to that of excitatory currents. In particular, despite the increase in mean driving forces of the excitatory synapses, the mean excitatory synaptic currents decrease as \(\tau ^ }_\textsc } = \tau ^ }_\textsc }\) is increased. This implies that the effect of decreasing excitatory conductances, shown in Fig. 3b, dominates the effect of increasing mean excitatory driving forces, hence resulting in the net decrease of excitatory synaptic currents.
Fig. 3c also shows that the steady-state ratio between the absolute values of mean excitatory and mean inhibitory synaptic currents in the inhibitory population, \(|M_ }_\textsc }}| / |M_ }_\textsc }}|\), does not significantly change with respect to \(\tau ^ }_\textsc } = \tau ^ }_\textsc }\), whereas the ratio between these currents in the excitatory population, \(|M_ }_\textsc }}| / |M_ }_\textsc }}|\), decreases with increasing \(\tau ^ }_\textsc } = \tau ^ }_\textsc }\). Therefore, similar to the ratio \(M_ }_\textsc }} / M_ }_\textsc }}\) between synaptic conductances, here the ratio \(|M_ }_\textsc }}| / |M_ }_\textsc }}|\) between synaptic currents also indicates shifts in the level of excitation-inhibition balance, toward over-inhibition or over-excitation.
The results provided above describe only the effect of inhibitory synaptic decay time constants on the network balance. Nevertheless, the excitation-inhibition balance in the network can also be affected by changes in the excitatory synaptic decay time constants. It is implied from the neuronal response curves shown in Fig. 2a that changes in excitatory and inhibitory decay time constants have opposite impacts on the gain of neurons. Therefore, with fixed values of \(\tau ^ }_\textsc } = \tau ^ }_\textsc }\), the mean firing rates of both inhibitory and excitatory populations increase concurrently with increases in \(\tau ^ }_\textsc } = \tau ^ }_\textsc }\). However, similar to changes in inhibitory decay time constants described above, it is not intuitively possible to accurately predict whether the network balance will be maintained during such paired changes in the mean firing rates of the populations; and if not, to which direction, either over-inhibition or over-excitation, the balance will shift. In fact, the relative changes between the magnitude of the mean excitatory and inhibitory response curves, and the varying sensitivity of these curves to changes in synaptic decay time constants—which results from complicated interactions in the network between adaptive and non-adaptive dynamic neurons—can result in non-intuitive changes in the network balance.
To demonstrate the joint effect of both excitatory and inhibitory synaptic decay time constants on network balance, we perform a codimension-two continuation of the Hopf bifurcation point that was detected in the codimension-one bifurcation analysis described before. We consider the same values for the decay time constants of excitatory synapses in both populations, \(\tau ^ }_\textsc } = \tau ^ }_\textsc }\), and vary it as a second bifurcation parameter. The resulting curve of Hopf points is shown in Fig. 3f.
It is observed that, when \(\tau ^ }_\textsc } = \tau ^ }_\textsc }\) is reduced from its baseline value, the critical transition point (Hopf bifurcation) in the dynamics of the network occurs at lower values of \(\tau ^ }_\textsc } = \tau ^ }_\textsc }\). This implies that lower values of excitatory synaptic decay time constants reduce the overall level of excitation in the network, so that this reduction in excitation effectively compensates for a rise in excitation caused by decreases in inhibitory decay time constants \(\tau ^ }_\textsc } = \tau ^ }_\textsc }\). Therefore, due to this compensatory effect, lower values of excitatory synaptic decay time constants allow for the network to maintain a stable balanced state at much lower values of inhibitory decay time constants.
The upper part of the curve of Hopf points in Fig. 3f shows a less intuitive dynamics for larger values of \(\tau ^ }_\textsc } = \tau ^ }_\textsc }\) than its (approximately) baseline value. Although not shown here, codimension-one continuations of the baseline equilibrium with respect to variations in \(\tau ^ }_\textsc } = \tau ^ }_\textsc }\), but with fixed values of \(\tau ^ }_\textsc } = \tau ^ }_\textsc }\), still show an increase in the level of excitation at higher values of \(\tau ^ }_\textsc } = \tau ^ }_\textsc }\) and a shift in the balance of excitation and inhibition to hyper-excitation. However, as it can be seen in Fig. 3f, at large values of inhibitory synaptic decay time constants, including the baseline value \(\tau ^ }_\textsc } = \tau ^ }_\textsc } = 8.3\) ms, this shift to hyper-excitation does not drive the network’s dynamics to an oscillatory regime. Both an oscillatory state and a non-oscillatory hyper-excited state can be observed in the network activity when \(\tau ^ }_\textsc } = \tau ^ }_\textsc }\) is increased from small values to large values while \(\tau ^ }_\textsc } = \tau ^ }_\textsc }\) is at about \(4-7\) ms. It should be noted, however, that the level of stable hyper-excitation observed at large values of excitatory synaptic decay time constants corresponds to conductance ratios \(M_ }_\textsc }} / M_ }_\textsc }}\) that may not be biologically plausible.
Importantly, the curve of Hopf bifurcation points in Fig. 3f implies that the baseline parameter values \(\tau ^ }_\textsc } = \tau ^ }_\textsc } = 1.7\) ms and \(\tau ^ }_\textsc } = \tau ^ }_\textsc } = 8.3\) ms are critical values for network stability, in the sense that the network remains quite responsive at these values, while relatively small reduction in the mean decay time constant of inhibitory neurons transitions the network’s dynamics to an oscillatory state.
4.2.2 Effect of synaptic quantal conductancesThe quantal conductance of a synapse is the peak membrane conductance change in a neuron caused by receiving a single spike from a presynaptic neuron. Therefore, changes in the quantal conductance of a synapse directly modulate the strength of the synapse. This is also implied from the mean synaptic conductance Eqs. (5) and (6). It should be noted that, as described in Section 3, the quantal conductances \(\textrm_\textsc }\), \(\textsc , \textsc \in \, \textsc \}\), that are incorporated in the mean-field model we use here are in fact quantal conductances per connection, that means, they are equal to the quantal conductances per synapse times the number of synapses per connection. As a result, \(\textrm_\textsc }\), \(\textsc , \textsc \in \, \textsc \}\), in our study can be altered both by changes in the number of synapses and by modulations of the synaptic peak conductances.
留言 (0)