
記住我
Magnetic resonance-guided focused ultrasound (MRgFUS) thalamotomy has demonstrated successful treatment of medication-refractory tremor in essential tremor (ET) (1, 2). This technique uses transcranial acoustic energy to ablate the ventral intermediate (Vim) nucleus of the thalamus, allowing for an incisionless approach in an awake patient to relieve debilitating tremor. Clinical neurologic feedback between sonications can guide target placement and other parameters, such as number of sonications, maximum power, and maximum energy. Sonications continue until adequate tremor control is achieved, with the targeted tissue usually reaching a peak temperature of around 55–60°C (3).
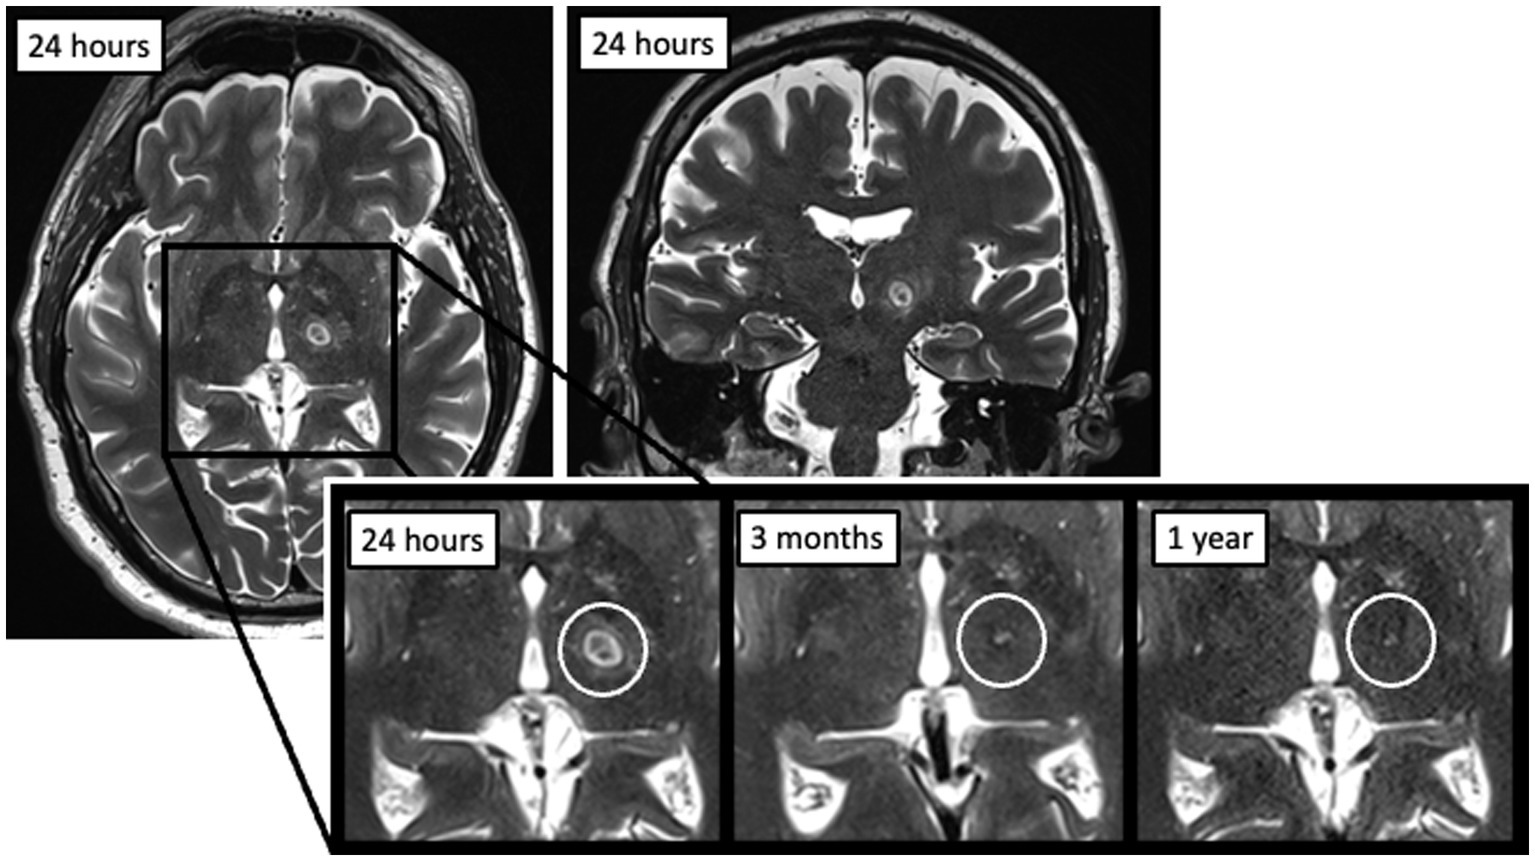
Post-procedural imaging is common on the day after the procedure as well as at various time intervals thereafter. T2-weighted imaging 24-h after MRgFUS thalamotomy typically shows a region of ablation with dimensions of 6–8 mm, although specifics can vary depending on the exact time interval and MRI methods used (3). These lesions have distinct concentric zones: a central necrotic core (zone 1), surrounding cytotoxic edema (zone 2), and a larger ring of vasogenic edema (zone 3) (4). At our institution, additional MRI scans are often obtained at 3-months and less frequently at 1-year following the procedure depending on patient availability and ability to return to clinic. On these subsequent T2-weighted images, visible lesions are often substantially smaller or no longer visible despite persistent tremor improvement, which has previously been reported (4–7) (Figure. 1). There is currently no consensus on the frequency of postoperative imaging after MRgFUS thalamotomy, specific sequences to be used, or what these findings may represent. Some studies have looked at variables that correlate with post-procedure lesion persistence, but these have analyzed very few patients, mostly at less than 6 months post-procedure, and some only on two-dimensional axial imaging (4, 6, 8–10). Now that more bilateral thalamotomies are being performed, an understanding of lesion evolution over time will be useful to better assess how the second side target relates to the lesion location on the first side.
Figure 1. Example of an MRgFUS thalamotomy lesion at 24 h post-procedure on axial (left) and coronal (right) T2-weighted imaging, as well as evolution over time at three time points (24 h, 3 months, and 1 year).
In this retrospective analysis of a large single-surgeon consecutive series of unilateral MRgFUS thalamotomy procedures in patients with ET, we aimed to evaluate the evolution and incidence of lesion persistence on T2-weighted MR imaging and correlate this with tremor outcomes and side effects at 3-months and 1-year. Prior studies have demonstrated that larger lesion size on MRI completed 1 day following MRgFUS thalamotomy is correlated with more adverse events (4, 11–13), and that lesion size and tremor control are influenced by various sonication parameters (10, 12, 14, 15). We therefore predicted that increasing sonication parameters (e.g., power, temperature, distance between individual sonications) would create larger lesions that would both persist on imaging as well as lead to more adverse effects, although potentially with improved tremor control.
2. Methods 2.1. Patient selectionWe retrospectively identified all patients who underwent unilateral MRgFUS thalamotomy for ET between June 2017 and April 2022 at our institution. Those chosen for treatment included patients that satisfied the following criteria: (1) severe and/or disabling tremor, (2) failed multiple medications, (3) not a candidate for or unwilling to undergo deep brain stimulation (DBS), and (4) skull-density ratio of at least 0.35. All patients had imaging on postoperative day 1. Out of the 215 total patients treated, 121 had imaging at either 3 months, 1 year, or both timepoints following the procedure and were therefore included in the study.
2.2. MRgFUS procedureThe detailed MRgFUS thalamotomy procedural workflow at our institution has previously been published (11). Briefly, a patient’s head was completely shaved and a modified Codman-Robert-Wells frame (Radionics, Inc.) was applied under local anesthesia. A silicone membrane was stretched over the frame and head before placing the patient in a 3 T MRI (GE Medical Systems) connected to the ExAblate 4,000 MRgFUS transducer (InSightec Inc., Israel). The space between the transducer and the scalp was filled with cooled and degassed water for acoustic coupling. The unilateral Vim was targeted in all patients as previously described (8) using atlas-based coordinates of one quarter of the anterior commissure-posterior commissure (AC-PC) distance anterior to PC, 13–14 mm lateral to midline, and 1.5–2 mm superior to the midcommissural plane, and further refined with direct visualization (16). Subclinical test sonications were used to assess for transient tremor improvement or side effects and target adjustments were made as needed before delivery of high-powered sonications with maximum temperature of around 55–60°C (monitored with real-time MR thermometry). Patients were clinically assessed between each sonication to ensure adequate tremor control and monitor for side effects, including asking about sensory disturbances.
The postoperative focused ultrasound imaging protocol is as follows: 3D plane localizer sagittal and axial T1, axial 3D T1, axial and coronal 2 mm thin-cut T2, axial T2 GRE, axial Flair, axial SWI, and axial DWI. Later patients replaced SWI with WMn MPRAGE sequence on Prisma scanner and replaced DWI with DTI 30 direction (or 18 if 30 was not available).
2.3. Data collection and outcomesFor each procedure, sonication parameters were recorded including the total number of sonications, number of treatment sonications (defined as energy >5,000 J), maximum power, maximum energy, maximum duration, and maximum temperature. Additionally, with adjustment of the sonication target during the procedure to maximally relieve tremor, we recorded the maximum distance between planned targets. Skull-density ratio (SDR), or the ratio of cortical to cancellous bone, was calculated based on preoperative CT imaging. Because SDR is correlated with most sonication parameters given its impact on the required thermal dose to create lesions (10), SDR-normalized values of power, energy, and duration were calculated using a linear regression between the SDR and the respective sonication parameter, and fitting to a linear equation, as previously described (11). For each patient, SDR values were used to calculate the expected value based on the regression equation. Power, energy, or duration values for that patient were divided by the expected value, such that a value >1 corresponded to a value above the expected maximum. We also calculated the number of ‘low-power’ and ‘low-temperature’ sonications per treatment, since it was previously described that delivery of high power and temperature earlier in the treatment course led to larger lesions at 24 h (11). Because high-power sonications were previously defined as those within the top 10th percentile, low-power sonications were defined as those within the bottom 90th percentile. This was also the definition used for low temperature sonications.
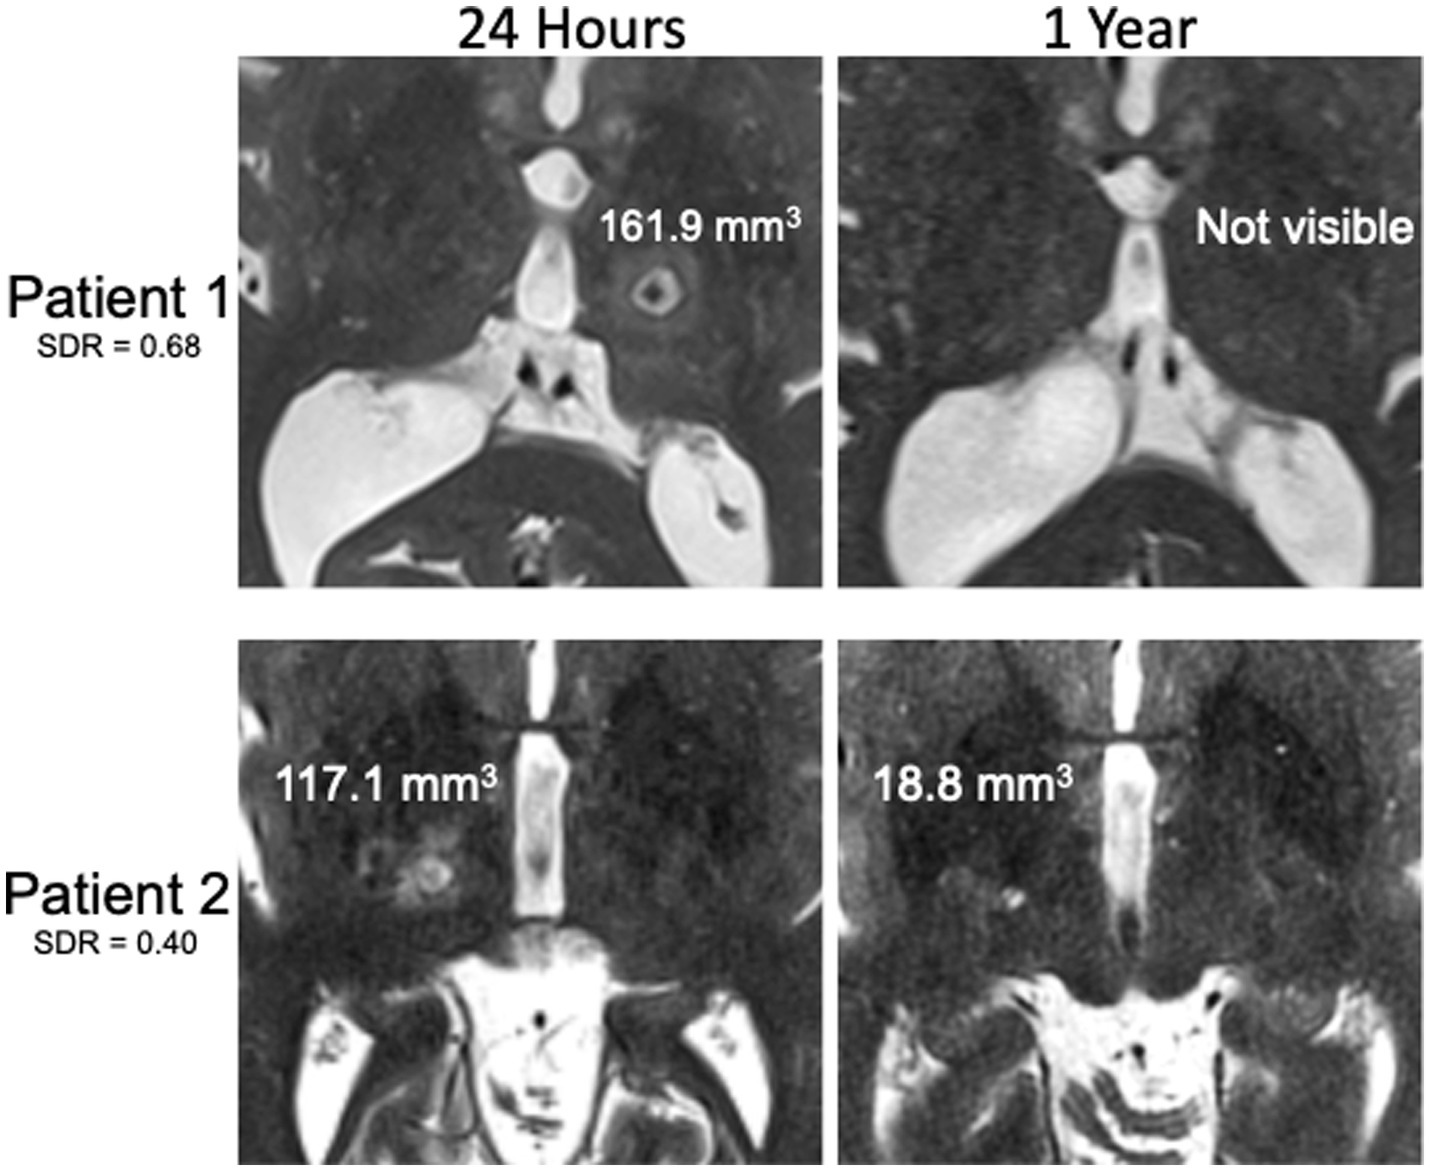
Postoperative axial and coronal thin-cut (2 mm) T2-weighted images at 3 months and 1 year were analyzed on a binary scale for lesion visibility (authors SEB, MMJC, and DJS). This was done by comparing side-by-side images to the 24-h lesion and directly visualizing if there was any T2 hyper-or hypointense remnant in the location of the lesion. Figure. 2 shows an example of a patient with a lesion that was not present at 1 year (top) compared to a patient with a T2-bright lesion still present at 1 year (bottom). Approximate volumes were calculated for those with lesions still visible at 3 months and 1 year and for all 24-h lesions by measuring the anterior–posterior (AP), transverse (TR), and craniocaudal (CC) diameters calculating the volume of an ellipsoid, where V = volume of an ellipsoid, a = AP radius, b = TR radius, and c = CC radius:
At 24 h, 3 months, and 1 year post-MRgFUS thalamotomy, absolute volume as well as percent of 24-h volume still present were used for calculations.
Figure 2. Examples of T2-weighted MR images 24 h and 1 year after MRgFUS for essential tremor. Patient with high SDR without visible lesion at 1 year despite large lesion at 24 h (top) compared to patient with low SDR with visible lesion at 1 year despite smaller lesion at 24 h (bottom). Lesion volumes displayed on the images.
Fahn-Tolosa-Marin (FTM) tremor scores were assessed preoperatively for baseline comparison, and at 3-month and 1-year postoperative follow-up visits. Tremor on the FTM scale is graded from 0 to 4, with 0 being no tremor, and 4 being severe tremor. FTM components assessed in each patient included head, voice, resting, postural, and intention tremor. Side effects were also recorded, including motor weakness, sensory deficits, dysarthria, fatigue, imbalance, dysgeusia, and coordination issues/dysmetria.
To assess attrition bias for patients with MRI at 1 year, the included patients were separated into 2 groups based on those that had a 1-year MRI versus those that did not. These groups were compared for patient characteristics, total and treatment sonications, volume at 24 h, preoperative total FTM score and FTM intention score, 1-year total FTM and FTM intention score, 1-year total FTM improvement, and 1-year FTM intention improvement.
2.4. Statistical analysisChi-squared tests, unpaired t-tests, and Spearman’s rank correlations were performed using Python version 3. When calculating Spearman’s rank correlations for volume, lesions that were not visible (i.e., volume of 0) were excluded given that the lesions could have become absent at different time points, which could impact the fit of the data. Multiple regressions were also used to determine predictors of lesion absence/presence as well as volume at these timepoints and change in volume at these timepoints. Variables included in the regression were based on previously determined significant predictors of volume at 24 h (11) as well as those found to be significant in simple Spearman’s rank correlations. A value of p of less than 0.05 was considered statistically significant. A Bonferroni test was used for post-hoc multiple-comparison correction.
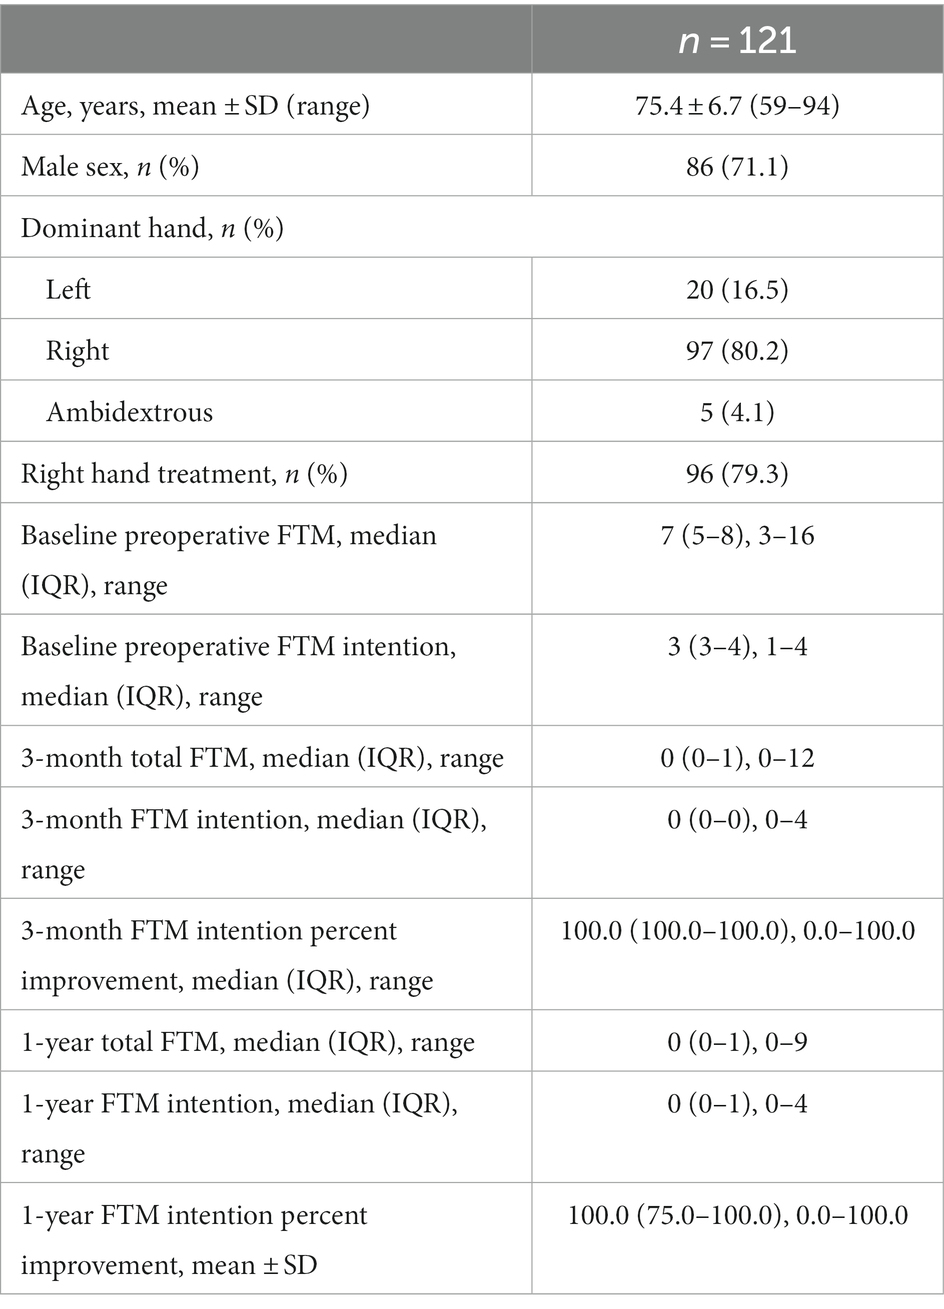
3. Results 3.1. Patient baseline characteristicsPatients’ ages ranged from 59 to 94 years (mean ± SD, 75.4 ± 6.7), with most patients being male (71.1%) (Table 1). Baseline preoperative FTM scores ranged from 3 to 16 (7.0 ± 2.4) with FTM intention score ranging from 1 to 4 (3.2 ± 0.7).
Table 1. Patient characteristics.
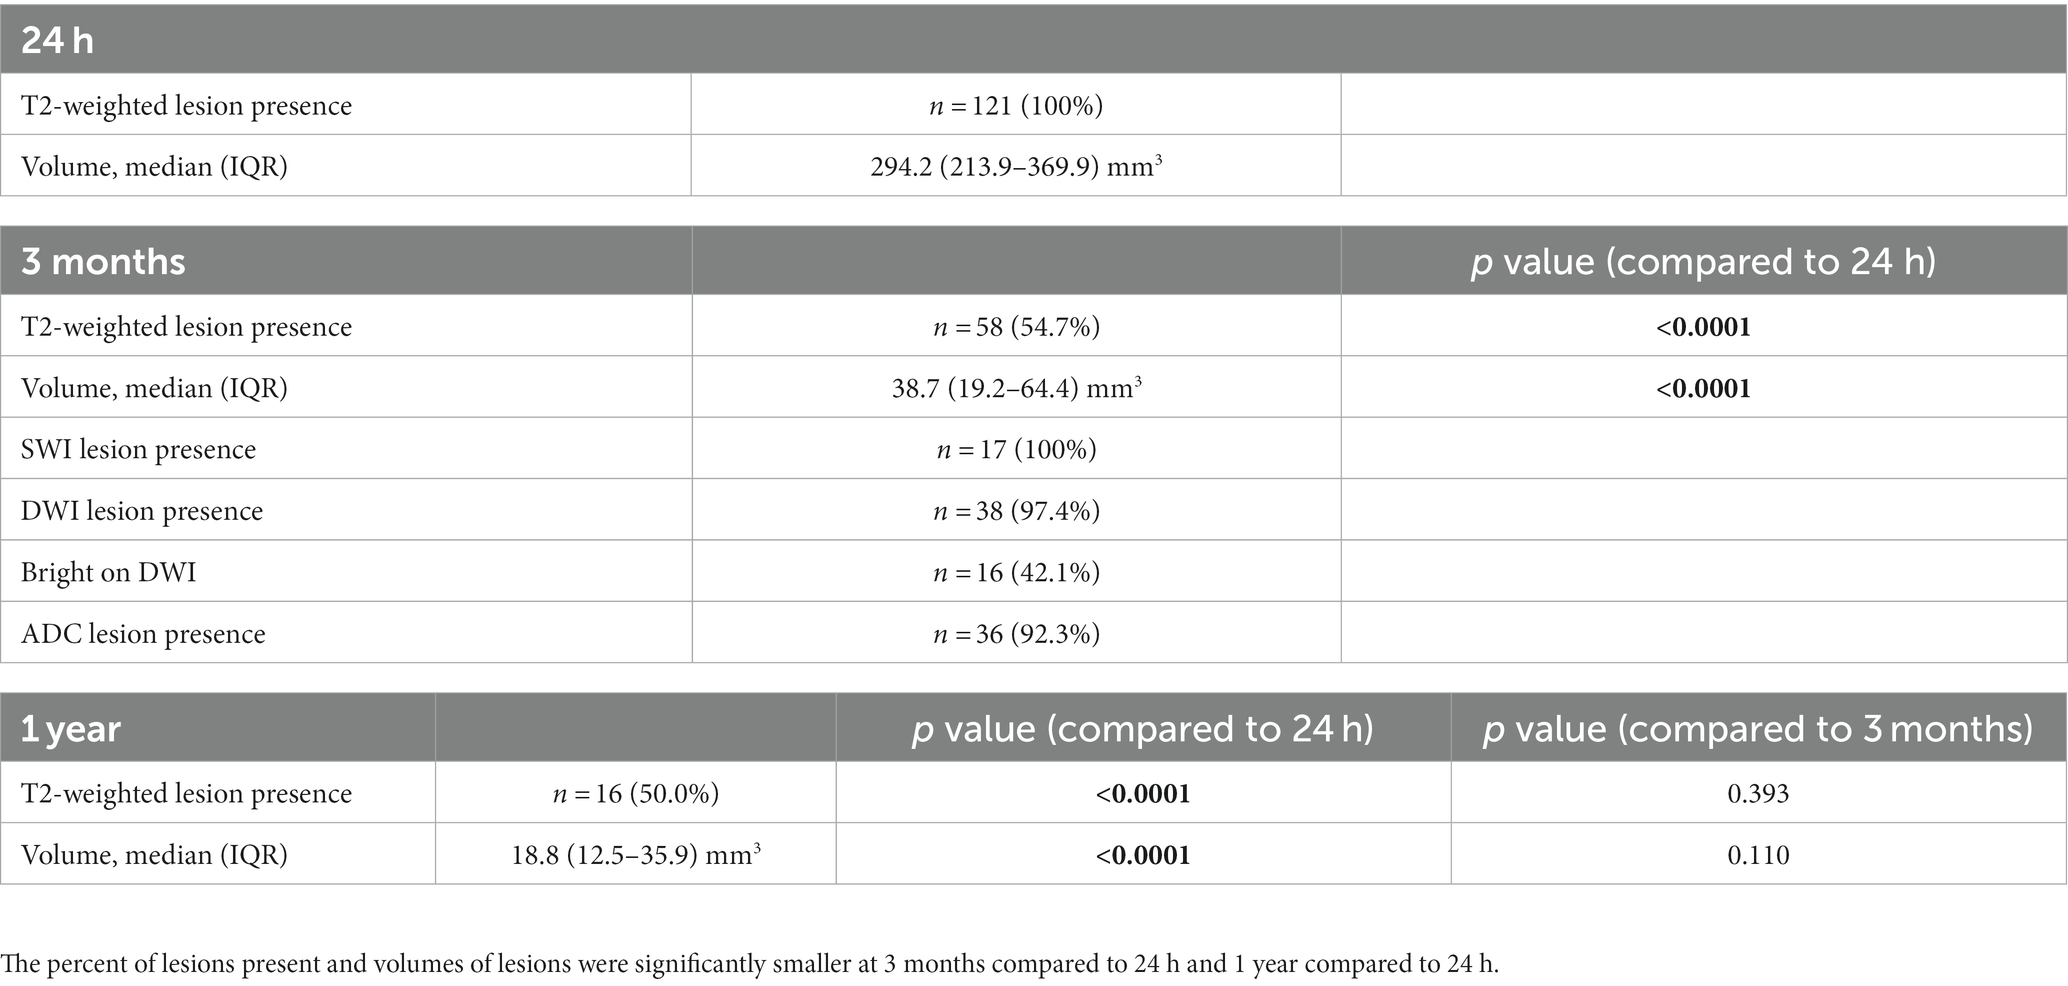
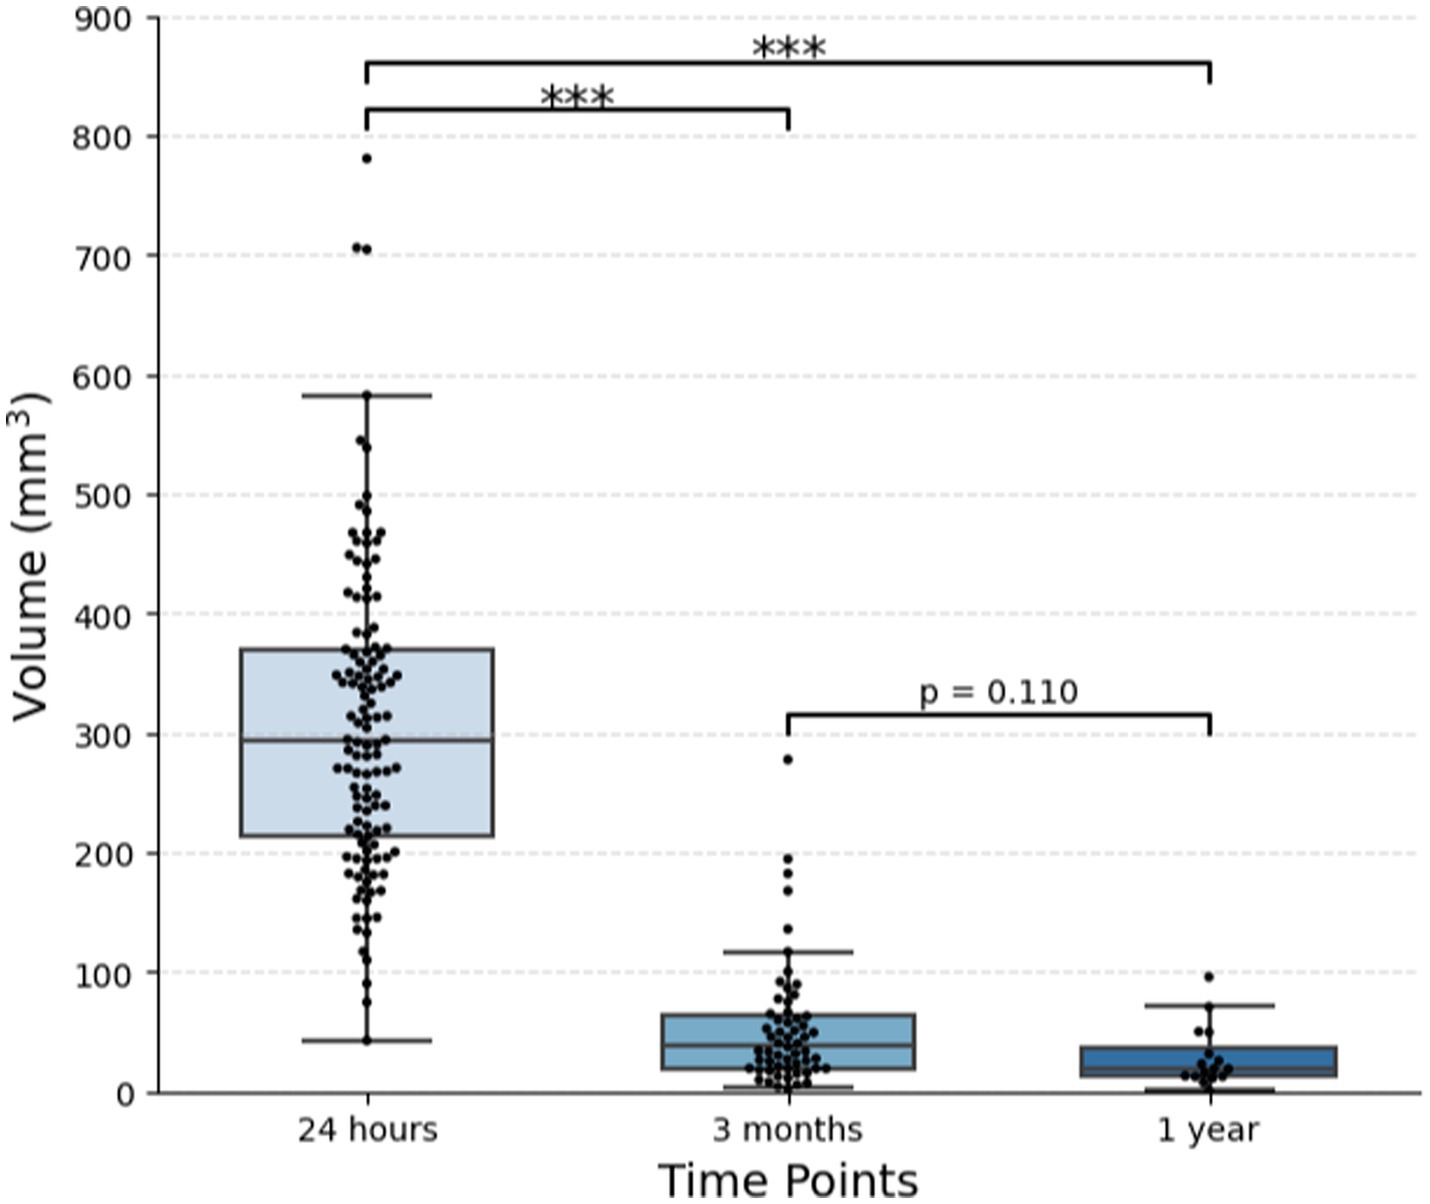
3.2. Lesion visibility and volumeAll patients had visible lesions on 24-h post-procedural T2-weighted MRI, with an average volume of 307.4 ± 128.7 mm3 [median (IQR), 294.2 (213.9–369.9) mm3], or 7.7 × 7.9 × 9.2 mm (AP x TR x CC) (Table 2; Figures 1, 3). At 3 months, residual lesions were detectable in 59.0% of patients (n = 69) and were 83.6% smaller on average with a volume of 38.7 (19.2–64.4) mm3 (p < 0.0001), or 3.9 × 4.7 × 4.5 mm. For patients who had SWI sequences (n = 17), visible SWI signal was present in all at 3 months. The majority of lesions were also visible on DWI (n = 38, 97.4%) and ADC (n = 36, 92.3%) at 3 months. Almost half were bright on DWI (42.1%). Lesions at 1 year were detectable in 52.9% of patients (n = 18). Residual lesions [18.9 (12.5–35.9) mm3 or 3.1 × 3.9 × 3.9 mm] were on average 90.7% smaller than 24 h (p < 0.0001), and 46.5% smaller than 3 months (p = 0.110).
Table 2. Lesion characteristics at 3 months and 1 year postoperatively on MRI.
Figure 3. Change in lesion volume over time. One hundred and twenty-one patients with essential tremor who underwent MRgFUS thalamotomy were included. Out of 106 patients with imaging at 3 months, 58 had visible lesions. Out of 32 patients with imaging at 1 year, 16 had visible lesions. The plot displays the median and IQR (***p < 0.001).
3.3. Predictors of lesion visibility and sizeIndependent t-tests between patients with lesions present and those without lesions present at both 3 months and 1 year demonstrated no difference in patient characteristics (age and SDR), sonication parameters, preoperative tremor scores, or 24-h lesion volume (Supplementary Table S1).
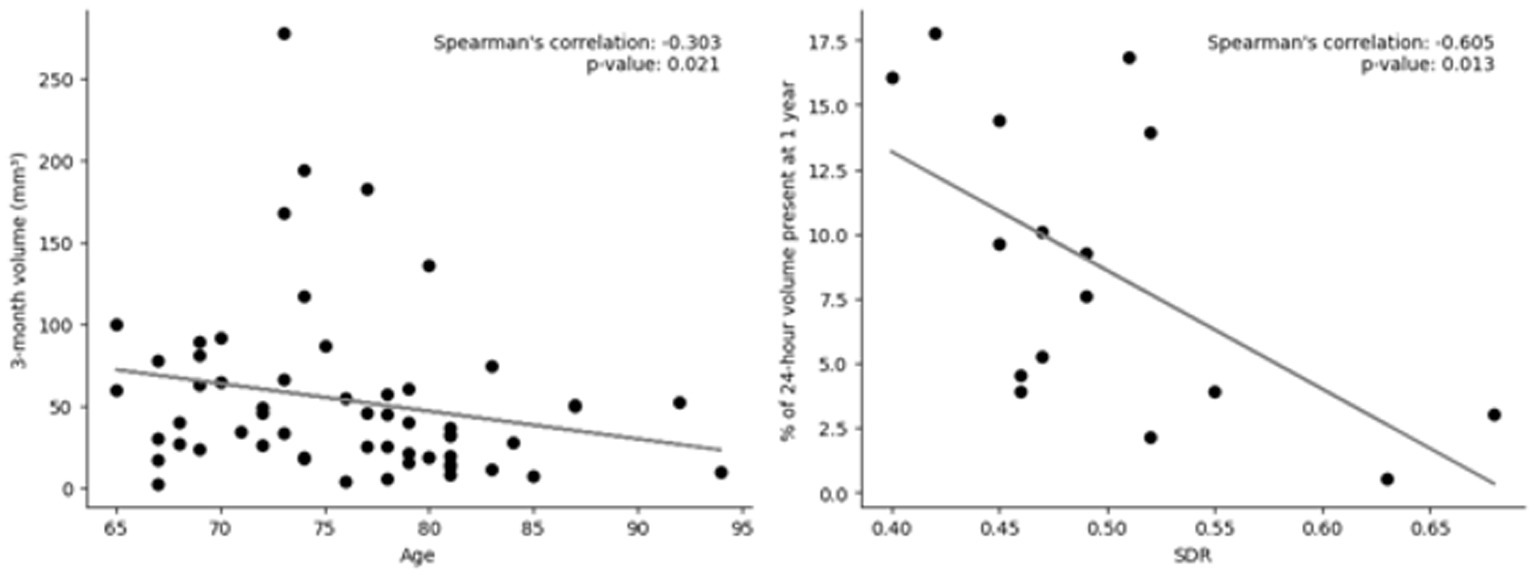
Before multiple-comparison corrections, Spearman’s rank correlations found that age predicted the lesion volume at 3 months (rho = −0.302, p = 0.021) and SDR predicted the change in volume at 1 year (rho = −0.605, p = 0.013) (Figure 4; Supplementary Table S1). However, after Bonferroni corrections, neither of these remained significant (not p < 0.003).
Figure 4. Scatter plots of predictors of volume at various timepoints. Left: Lesion volume at 3 months vs. age; out of 106 patients who had imaging at 3 months, 58 still had lesions present. Right: Skull density ration (SDR) vs. change in volume at 1 year; Out of 32 patients who had imaging at 1 year, 16 still had lesions present. Linear trendline and Spearman’s rank correlation value and value of p are included. Neither were significant after Bonferroni correction (p < 0.003).
Multiple regressions to determine predictors of lesion presence at both 3 months and 1 year did not show any significant variables. A regression of predictors of lesion volume at 3 months showed that the number of treatment sonications (coefficient = −12.7, p = 0.016), normalized maximum power (coefficient = 96.5, p = 0.048), and the maximum distance between sonication targets (coefficient = 27.9, p = 0.013) predicted volume. Treatment sonications and maximum distance also predicted the percent of lesion volume still present at 3 months compared to 24-h volume (coefficient = −5.7, p = 0.003 and coefficient = 10.5, p = 0.009, respectively). No variables were significant in the 1-year volume regressions.
3.4. Lesion visibility and volume and outcomesAt 3 months, the total FTM score ranged from 0 to 12 [median (IQR) = 0 (0–1)], and FTM intention ranged from 0 to 4 [0 (0–0)]. At 1 year, the total FTM score ranged from 0 to 9 [0 (0–1)], and FTM intention ranged from 0–4 [0 (0–1)]. Lesion visibility and lesion size at 3 months and 1 year did correlate with some side effects, specifically weakness and sensory deficits (Supplementary Table S3). After Bonferroni corrections, the only significant correlate was that those with sensory deficits at 3 months had larger lesions (p = 0.001). Interestingly, tremor outcomes were not found to be related to the presence of the lesion or lesion size.
3.5. Assessing attrition bias at 1 yearPatients who had MRIs at 1 year post-MRgFUS thalamotomy (n = 34), compared to those who did not (n = 87), were significantly younger (73.2 ± 6.8 vs. 76.3 ± 6.5, p = 0.019). There was similar gender distribution (p = 0.603) and SDRs (p = 0.489). However, those who did have MRIs underwent significantly more total sonications (6 ± 3 vs. 5 ± 2, p = 0.015) and treatment sonications (11 ± 5 vs. 9 ± 3, p = 0.002). Additionally, patients who did have MRIs were significantly earlier patients in the cohort with lower identification numbers (p < 0.001). Preoperative total FTM scores and FTM intention scores were not significantly different (p = 0.703 and p = 0.715, respectively). Lesion volumes at 24 h were also similar (p = 0.427). At 1 year, FTM intention scores and percent improvement were not significantly different (p = 0.317 and p = 0.356, respectively).
4. DiscussionThere is no current consensus on the utility or frequency of postoperative imaging after unilateral MRgFUS thalamotomy. In this single-surgeon series, we show that lesions are visually identifiable on T2-weighted MRI in only about one half of patients at both 3 months and 1 year following MRgFUS thalamotomy (Table 2). This may be slightly higher than would be seen in other cohorts, given our institution’s larger 24-h lesions (11). Keil et al. describe similar findings of lesion persistence on T2-weighted imaging in only 40% of their patients at 6 months postoperatively with smaller lesion volumes at all timepoints post-procedurally (3 days, 1 month, and 6 months) (6). These observations demonstrate that while T2-weighted images are very useful during the first few days after MRgFUS to show lesion location, extent and edema, the images may return to normal after 1 month and are inadequate for longer follow-up studies (4, 6). SWI, on the other hand, demonstrates persistent lesions more reliably over long-term follow-up (Table 2) (6). This suggests that SWI could be used in postoperative imaging protocols to localize lesions after extended periods of time, especially when planning retreatments or contralateral treatments.
4.1. Significant predictors of lesion persistence 4.1.1. Some sonication parameters predicted 3-month volumeThe multivariate regression for lesion size at 3 months showed that the number of treatment sonications, maximum power, and maximum distance between sonication targets predicted lesion size. A fewer number of treatment sonications was correlated with increased lesion size as well as a larger percentage of lesion volume still present at 3 months confirming what we have previously found: more, lower power sonications does not create as large of a lesion as fewer, higher power sonications (11). Here, we show that this finding seems to persist on imaging past 24 h. Greater maximum power and maximum distance positively predicted lesion volume, which has also previously been shown on 24-h imaging (11). Overall, these known predictors of larger 24-h volume also predict larger 3-month volume.
4.1.2. Increased SDR may lead to greater change in volume at 1 yearAlthough not significant after post-hoc corrections or within the multivariate regression, when assessed independently, patients with lower SDR had more of their lesion still present at 1 year (Figure 4; Supplementary Table S2). This was not seen at 3 months. Heating efficiency is known to be worse for patients with a lower SDR (17–20). It has previously been demonstrated that the skull along the ultrasound beam paths can cause acoustic parameters to change, leading to blurring (dephasing) of the focus and reduction in treatment efficiency (21). Greater heating efficiency for patients with high SDR may not have the same impact on the tissue, leading to lesions that do not maintain the same volume. At lower SDRs, the ultrasound focus disperses, leading to less precise targeting (21). The impact on the tissue surrounding the lesion may be impacted in a way that maintains the structure of the lesion without collapsing in on itself as quickly at this long-term follow-up.
The multivariate regression at 1 year showed no significant predictors. This is likely because there were very few observations (only 32 patients with 1-year imaging, and only 16 still had lesions present), which would not allow for any smaller associations to be extrapolated.
4.2. Clinical outcomes 4.2.1. Radiological persistence of lesion does not correlate with tremor outcomesWe did not find any correlations between presence or volumes of lesions on 3-months or 1-year T2-weighted MRI with any metrics of tremor improvement (Supplementary Table S1). This may also reflect, as we have suggested previously (11), that lesions at our institution are larger than those reported by several other series, and that even our smaller lesions tend to remain above any threshold that might correlate with changes in tremor improvement. Although lesion size on 1 day postoperative imaging has been shown to predict tremor outcomes up to 1 year after MRgFUS thalamotomy (4, 11, 12), studies have repeatedly demonstrated that tremor control persists despite lesions disappearing on T2-weighted imaging (4–7). Unlike our results, Keil et al. found that greater lesion shrinkage at 180 days on T2-weighted MRI correlated with increased tremor recurrence on the treated limb (6). It is possible that with additional patients or with imaging at additional timepoints, we too may have seen correlation with tremor outcomes. Additionally, as previously discussed, other imaging sequences, such as SWI where lesions are present for longer, may provide better insight into this question.
4.2.2. Radiological evidence and volume of lesion predicts side effectsAfter post-hoc analysis, patients with sensory side effects at 3 months had larger lesions (Supplementary Table S3). This was not surprising, given that sensory side effects are very common and related to larger or more posterior lesions at 24-h that overlap with the ventroposterolateral nucleus which lies posterior to the Vim (11, 22). While previous studies have found that larger lesions on 24-h imaging is correlated with more adverse effects (11), to the best of our knowledge, this is the first time that postoperative imaging beyond the first few days has demonstrated a significant correlation with adverse events.
4.3. Limitations and future directionsWhile we describe a very large cohort with imaging at 24 h after MRgFUS thalamotomy (n = 121), this number decreased for those with imaging and FTM scores at 3 months (n = 99) and at 1 year (n = 28). Analyses with more patients could gain greater statistical power and may elucidate more subtle correlations. Additionally, there were some differences between the patient population that had MRIs at 1 year compared to those that did not, including imaged patients being younger and having undergone more total and treatment sonications. Future studies with more consistent imaging could avoid attrition bias. Another limitation is that the determination of presence or absence of lesions has intrinsic subjectivity which we attempted to mitigate by having a second observer where necessary. Finally, due to the imaging preferences at our institution, SWI sequences were not obtained for many patients, which did not allow for any significant analysis outside of noting presence for all images.
An interesting future direction is analyzing diffusion tensor imaging (DTI) over time. Previous studies have demonstrated persistent changes in tractography up to 1 year after MRgFUS thalamotomy (23). This type of imaging gives much clearer information into the specific fiber tracts that are targeted during FUS procedures to elicit the intended effects. Various features of connectivity have been correlated with better tremor outcomes (24–31). With longitudinal studies, DTI may give insight into the individual changes in functional connectivity of tremor circuitry that lead to persistent adverse effects as well as tremor control and/or recurrence.
5. ConclusionLesions are visible on T2-weighted MRI in only about one half of patients at both 3 months and 1 year post unilateral MRgFUS thalamotomy for ET and were significantly smaller over time. At 3 months, multivariate regression showed that fewer treatment sonications, greater maximum power, and larger distance between treatment sonication targets led to more persistent lesions. Independent analyses showed that older patients tended to have smaller 3-month volumes. While the presence or size of lesion at 3 months was not a predictor of tremor outcomes, it did predict sensory side effects. Overall, postoperative T2-weighted MR imaging at 3 months and beyond did not provide significant clinically relevant data and SWI MRI sequences may be better to analyze predictors and significance in volume changes. Moving forward, as we start to perform more bilateral FUS procedures, this study supports relying on early postoperative imaging for procedure planning.
Data availability statementThe raw data supporting the conclusions of this article will be made available by the authors, without undue reservation.
Ethics statementEthical approval was not required for the studies involving humans because it was a retrospective review of unidentifiable data. The studies were conducted in accordance with the local legislation and institutional requirements. Written informed consent for participation was not required from the participants or the participants’ legal guardians/next of kin in accordance with the national legislation and institutional requirements because it was a retrospective review of unidentifiable data.
Author contributionsSB: Data curation, Formal analysis, Investigation, Methodology, Software, Visualization, Writing – original draft. MC: Data curation, Investigation, Methodology, Writing – review & editing. PN: Data curation, Writing – review & editing. DS: Formal analysis, Writing – review & editing. RJ: Data curation, Writing – review & editing. NM: Data curation, Writing – review & editing. MD: Data curation, Writing – review & editing. JR: Supervision, Writing – review & editing. GC: Conceptualization, Supervision, Writing – review & editing.
FundingThe author(s) declare that no financial support was received for the research, authorship, and/or publication of this article.
AcknowledgmentsWe thank Sarah L. Christie, PA for her exceptional care of these patients. Research support was provided by the InSightec Inc.
Conflict of interestGC is a consultant for InSightec. JR was previously a consultant for ClearPoint. NM’s laboratory has received research support unrelated to the current study from InSightec.
The remaining authors declare that the research was conducted in the absence of any commercial or financial relationships that could be construed as a potential conflict of interest.
Publisher’s noteAll claims expressed in this article are solely those of the authors and do not necessarily represent those of their affiliated organizations, or those of the publisher, the editors and the reviewers. Any product that may be evaluated in this article, or claim that may be made by its manufacturer, is not guaranteed or endorsed by the publisher.
Supplementary materialThe Supplementary material for this article can be found online at: https://www.frontiersin.org/articles/10.3389/fneur.2023.1272425/full#supplementary-material
References1. Cosgrove, GR, Lipsman, N, Lozano, AM, Chang, JW, Halpern, C, Ghanouni, P, et al. Magnetic resonance imaging-guided focused ultrasound thalamotomy for essential tremor: 5-year follow-up results. J Neurosurg. (2022) 138:1028–33. doi: 10.3171/2022.6.JNS212483
PubMed Abstract | CrossRef Full Text | Google Scholar
3. Ghanouni, P, Pauly, KB, Elias, WJ, Henderson, J, Sheehan, J, Monteith, S, et al. Transcranial MR-guided focused ultrasound: a review of the technology and neuro applications. AJR Am J Roentgenol. (2015) 205:150–9. doi: 10.2214/AJR.14.13632
PubMed Abstract | CrossRef Full Text | Google Scholar
4. Wintermark, M, Druzgal, J, Huss, DS, Khaled, MA, Monteith, S, Raghavan, P, et al. Imaging findings in MR imaging-guided focused ultrasound treatment for patients with essential tremor. AJNR Am J Neuroradiol. (2014) 35:891–6. doi: 10.3174/ajnr.A3808
PubMed Abstract | CrossRef Full Text | Google Scholar
5. Elias, WJ, Huss, D, Voss, T, Loomba, J, Khaled, M, Zadicario, E, et al. A pilot study of focused ultrasound thalamotomy for essential tremor. N Engl J Med. (2013) 369:640–8. doi: 10.1056/NEJMoa1300962
PubMed Abstract | CrossRef Full Text | Google Scholar
6. Keil, VC, Borger, V, Purrer, V, Groetz, SF, Scheef, L, Boecker, H, et al. MRI follow-up after magnetic resonance-guided focused ultrasound for non-invasive thalamotomy: the neuroradiologist’s perspective. Neuroradiology. (2020) 62:1111–22. doi: 10.1007/s00234-020-02433-9
PubMed Abstract | CrossRef Full Text | Google Scholar
7. Chang, WS, Jung, HH, Kweon, EJ, Zadicario, E, Rachmilevitch, I, and Chang, JW. Unilateral magnetic resonance guided focused ultrasound thalamotomy for essential tremor: practices and clinicoradiological outcomes. J Neurol Neurosurg Psychiatry. (2015) 86:257–64. doi: 10.1136/jnnp-2014-307642
PubMed Abstract | CrossRef Full Text | Google Scholar
8. Harary, M, Essayed, WI, Valdes, PA, McDannold, N, and Cosgrove, GR. Volumetric analysis of magnetic resonance-guided focused ultrasound thalamotomy lesions. Neurosurg Focus. (2018) 44:E6. doi: 10.3171/2017.11.FOCUS17587
PubMed Abstract | CrossRef Full Text | Google Scholar
9. Bond, AE, and Elias, WJ. Predicting lesion size during focused ultrasound thalamotomy: a review of 63 lesions over 3 clinical trials. Neurosurg Focus. (2018) 44:E5. doi: 10.3171/2017.11.FOCUS17623
CrossRef Full Text | Google Scholar
10. Huang, Y, Lipsman, N, Schwartz, ML, Krishna, V, Sammartino, F, Lozano, AM, et al. Predicting lesion size by accumulated thermal dose in MR-guided focused ultrasound for essential tremor. Med Phys. (2018) 45:4704–10. doi: 10.1002/mp.13126
PubMed Abstract | CrossRef Full Text | Google Scholar
11. Segar, DJ, Lak, AM, Lee, S, Harary, M, Chavakula, V, Lauro, P, et al. Lesion location and lesion creation affect outcomes after focused ultrasound thalamotomy. Brain J Neurol. (2021) 144:3089–100. doi: 10.1093/brain/awab176
PubMed Abstract | CrossRef Full Text | Google Scholar
12. Federau, C, Goubran, M, Rosenberg, J, Henderson, J, Halpern, CH, Santini, V, et al. Transcranial MRI-guided high-intensity focused ultrasound for treatment of essential tremor: a pilot study on the correlation between lesion size, lesion location, thermal dose, and clinical outcome. J Magn Reson Imaging. (2018) 48:58–65. doi: 10.1002/jmri.25878
PubMed Abstract | CrossRef Full Text | Google Scholar
13. Pineda-Pardo, JA, Urso, D, Martínez-Fernández, R, Rodríguez-Rojas, R, del-Alamo, M, Millar Vernetti, P, et al. Transcranial magnetic resonance-guided focused ultrasound Thalamotomy in essential tremor: a comprehensive lesion characterization. Neurosurgery. (2020) 87:256–65. doi: 10.1093/neuros/nyz395
PubMed Abstract | CrossRef Full Text | Google Scholar
14. Kim, MJ, Park, SH, Chang, KW, Kim, Y, Gao, J, Kovalevsky, M, et al. Technical and operative factors affecting magnetic resonance imaging-guided focused ultrasound thalamotomy for essential tremor: experience from 250 treatments. J Neurosurg. (2021) 135:1780–8. doi: 10.3171/2020.11.JNS202580
PubMed Abstract | CrossRef Full Text | Google Scholar
15. Krishna, V, Sammartino, F, Cosgrove, R, Ghanouni, P, Schwartz, M, Gwinn, R, et al. Predictors of outcomes after focused ultrasound Thalamotomy. Neurosurgery. (2020) 87:229–37. doi: 10.1093/neuros/nyz417
PubMed Abstract | CrossRef Full Text | Google Scholar
16. McDannold, N, White, PJ, and Cosgrove, GR. Using phase data from MR temperature imaging to visualize anatomy during MRI-guided focused ultrasound neurosurgery. IEEE Trans Med Imaging. (2020) 39:3821–30. doi: 10.1109/TMI.2020.3005631
PubMed Abstract | CrossRef Full Text | Google Scholar
17. Yang, AI, Hitti, FL, Alabi, OO, Joshi, D, Chaibainou, H, Henry, L, et al. Patient-specific effects on sonication heating efficiency during magnetic resonance-guided focused ultrasound thalamotomy. Med Phys. (2021) 48:6588–96. doi: 10.1002/mp.15239
PubMed Abstract | CrossRef Full Text | Google Scholar
18. D’Souza, M, Chen, KS, Rosenberg, J, Elias, WJ, Eisenberg, HM, Gwinn, R, et al. Impact of skull density ratio on efficacy and safety of magnetic resonance-guided focused ultrasound treatment of essential tremor. J Neurosurg. (2019) 132:1392–7. doi: 10.3171/2019.2.JNS183517
PubMed Abstract | CrossRef Full Text | Google Scholar
19. Yuen, J, Goyal, A, Kaufmann, TJ, Jackson, LM, Miller, KJ, Klassen, BT, et al. Comparison of the impact of skull density ratio with alternative skull metrics on magnetic resonance-guided focused ultrasound thalamotomy for tremor. J Neurosurg. (2023) 138:50–7. doi: 10.3171/2022.5.JNS22350
PubMed Abstract | CrossRef Full Text | Google Scholar
20. Boutet, A, Gwun, D, Gramer, R, Ranjan, M, Elias, GJB, Tilden, D, et al. The relevance of skull density ratio in selecting candidates for transcranial MR-guided focused ultrasound. J Neurosurg. (2019) 132:1785–91. doi: 10.3171/2019.2.JNS182571
PubMed Abstract | CrossRef Full Text | Google Scholar
21. Hughes, A, Huang, Y, Schwartz, ML, and Hynynen, K. The reduction in treatment efficiency at high acoustic powers during MR-guided transcranial focused ultrasound thalamotomy for essential tremor. Med Phys. (2018) 45:2925–36. doi: 10.1002/mp.12975
PubMed Abstract | CrossRef Full Text | Google Scholar
22. Boutet, A, Ranjan, M, Zhong, J, Germann, J, Xu, D, Schwartz, ML, et al. Focused ultrasound thalamotomy location determines clinical benefits in patients with essential tremor. Brain. (2018) 141:3405–14. doi: 10.1093/brain/awy278
PubMed Abstract | CrossRef Full Text | Google Scholar
23. Sammartino, F, Yeh, FC, and Krishna, V. Longitudinal analysis of structural changes following unilateral focused ultrasound thalamotomy. NeuroImage Clin. (2019) 22:101754. doi: 10.1016/j.nicl.2019.101754
PubMed Abstract | CrossRef Full Text | Google Scholar
24. Pae, C, Kim, MJ, Chang, WS, Jung, HH, Chang, KW, Eo, J, et al. Differences in intrinsic functional networks in patients with essential tremor who had good and poor long-term responses after thalamotomy performed using MR-guided ultrasound. J Neurosurg. (2022) 138:318–28. doi: 10.3171/2022.5.JNS22324
PubMed Abstract | CrossRef Full Text | Google Scholar
25. Wintermark, M, Huss, DS, Shah, BB, Tustison, N, Druzgal, TJ, Kassell, N, et al. Thalamic connectivity in patients with essential tremor treated with MR imaging-guided focused ultrasound: in vivo fiber tracking by using diffusion-tensor MR imaging. Radiology. (2014) 272:202–9. doi: 10.1148/radiol.14132112
PubMed Abstract | CrossRef Full Text | Google Scholar
26. Tsolaki, E, Downes, A, Speier, W, Elias, WJ, and Pouratian, N. The potential value of probabilistic tractography-based for MR-guided focused ultrasound thalamotomy for essential tremor. NeuroImage Clin. (2017) 17:1019–27. doi: 10.1016/j.nicl.2017.12.018
PubMed Abstract | CrossRef Full Text | Google Scholar
27. Tian, Q, Wintermark, M, Jeffrey Elias, W, Ghanouni, P, Halpern, CH, Henderson, JM, et al. Diffusion MRI tractography for improved transcranial MRI-guided focused ultrasound thalamotomy targeting for essential tremor. NeuroImage Clin. (2018) 19:572–80. doi: 10.1016/j.nicl.2018.05.010
PubMed Abstract | CrossRef Full Text | Google Scholar
28. Pineda-Pardo, JA, Martínez-Fernández, R, Rodríguez-Rojas, R, del-Alamo, M, Hernández, F, Foffani, G, et al. Microstructural changes of the dentato-rubro-thalamic tract after transcranial MR guided focused ultrasound ablation of the posteroventral VIM in essential tremor. Hum Brain Mapp. (2019) 40:2933–42. doi: 10.1002/hbm.24569
PubMed Abstract | CrossRef Full Text | Google Scholar
29. Kapadia, AN, Elias, GJB, Boutet, A, Germann, J, Pancholi, A, Chu, P, et al. Multimodal MRI for MRgFUS in essential tremor: post-treatment radiological markers of clinical outcome. J Neurol Neurosurg Psychiatry. (2020) 91:921–7. doi: 10.1136/jnnp-2020-322745
PubMed Abstract | CrossRef Full Text | Google Scholar
30. Purrer, V, Upadhyay, N, Borger, V, Pieper, CC, Kindler, C, Grötz, S, et al. Lesions of the cerebello-thalamic tract rather than the ventral intermediate nucleus determine the outcome of focused ultrasound therapy in essential tremor: a 3T and 7T MRI-study. Parkinsonism Relat Disord. (2021) 91:105–8. doi: 10.1016/j.parkreldis.2021.09.013
PubMed Abstract | CrossRef Full Text | Google Scholar
31. Thaler, C, Tian, Q, Wintermark, M, Ghanouni, P, Halpern, CH, Henderson, JM, et al. Changes in the Cerebello-Thalamo-cortical network after magnetic resonance-guided focused ultrasound Thalamotomy. Brain Conn. (2022) 13:28–38. doi: 10.1089/brain.2021.0157
留言 (0)