
記住我


Primary liver cancer is one of the most common digestive tract malignant tumors and the sixth most common malignant tumor in the world. More than 50% of new cases with liver cancer and deaths occur in China every year, with hepatocellular carcinoma (HCC) as the most common pathological type (1). HCC easily invades the intrahepatic vasculature, especially the portal venous system, and forms portal vein tumor thrombus (PVTT) with an incidence rate of 44.0%–62.2%. The prognosis of these patients is very poor, and the survival period without treatment is only 2–4 months (2). Transarterial chemoembolization (TACE) is an important treatment option for HCC with PVTT in the Asia-Pacific region. Studies have shown that the PVTT feeding artery is a branch of the hepatic artery, which is also the theoretical basis for TACE to have a certain therapeutic effect on PVTT (3).
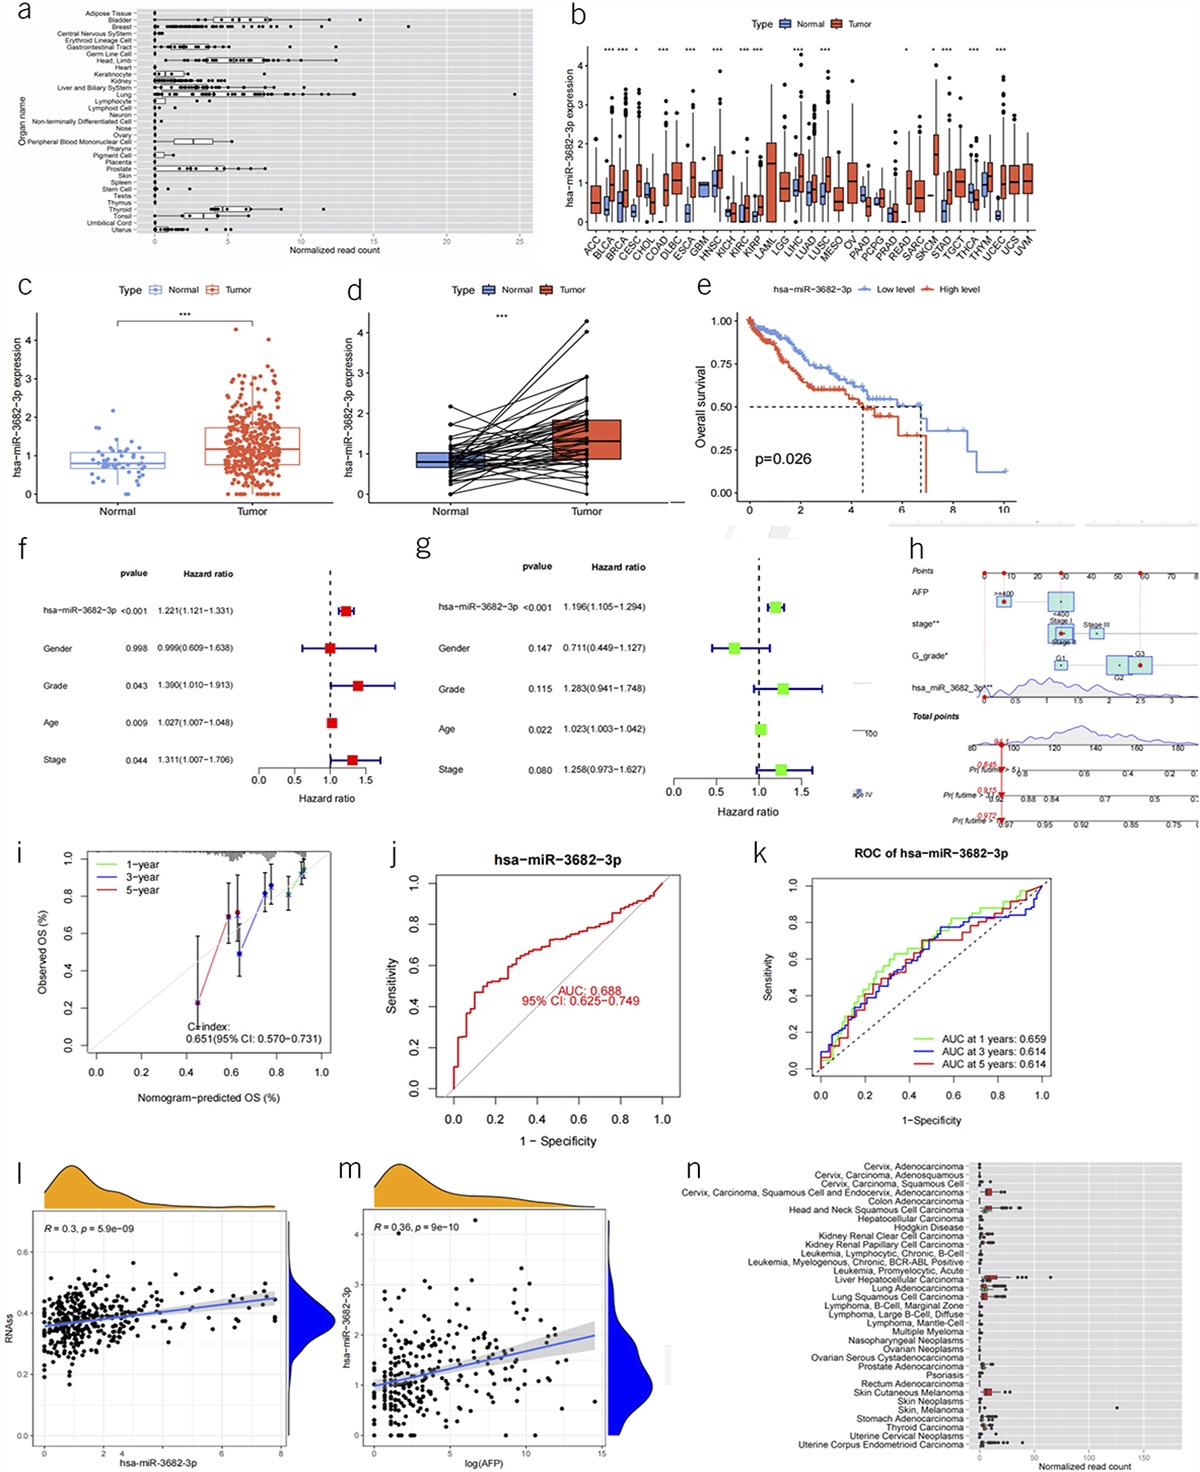
Apatinib is a tyrosine kinase inhibitor, which acts on the vascular endothelial growth factor (VEGF) and VEGF receptor 2 (VEGFR-2) signaling pathways, inhibits the binding of VEGFR-2 to tyrosine kinase adenosine triphosphate, blocks the proliferation and migration of vascular endothelial cells, and ultimately prevents tumor blood vessels regeneration and reduces tumor recurrence. Previous studies have shown that apatinib combined with TACE has a significant effect in the treatment of advanced HCC. The combination of the 2 inhibits tumor revascularization and reduces tumor volume, ultimately prolonging the survival of patients (4). Immune checkpoint inhibitors act on the body's immune system, effectively block the immune escape and tolerance pathways of tumor cells, and play a role in tumor inhibition through the body's cellular immune function (5). They have been proved to be effective in the treatment of various cancers including liver cancer. Studies have shown that the specific antitumor effects of PD-1 inhibitors and tyrosine kinase inhibitors (TKIs) have theoretical synergistic effects (6). As the basic mode of local treatment of advanced HCC, TACE therapy has been proved to have a positive regulatory effect on the immune level of the body (7). Therefore, it is worth further exploring whether these methods can be comprehensively applied to the treatment of HCC complicated with PVTT to achieve greater survival benefit.
At present, the treatment of HCC complicated with PVTT emphasizes comprehensive treatment to prolong survival and improve quality of life. In the treatment of advanced HCC, the efficacy of TACE combined with apatinib and PD-1 inhibitors (TACE-AP) is very significant (8); however, a controlled study on TACE-AP has not been reported for patients with HCC with PVTT. In this multicenter retrospective study, we explored the efficacy and safety of TACE-AP in the treatment of patients with HCC with portal vein tumor thrombus and analyzed the prognostic factors affecting patient survival.
METHODS PatientsThe clinical records of patients with HCC with PVTT who received TACE-A or TACE-AP from December 2018 to December 2021 were retrospectively analyzed. Patients were recruited from the following 3 centers: The Affiliated Cancer Hospital of Zhengzhou University, The First Affiliated Hospital of Zhengzhou University, and Henan Provincial People's Hospital. The Ethics Committee of the Affiliated Cancer Hospital of Zhengzhou University approved this study (approval number: 2017003). The Ethics Committee of other hospitals were informed and agreed to the study. Because of the retrospective design of study, the requirement for informed consent was waived by the Ethics Committee. All extracted data were anonymously analyzed.
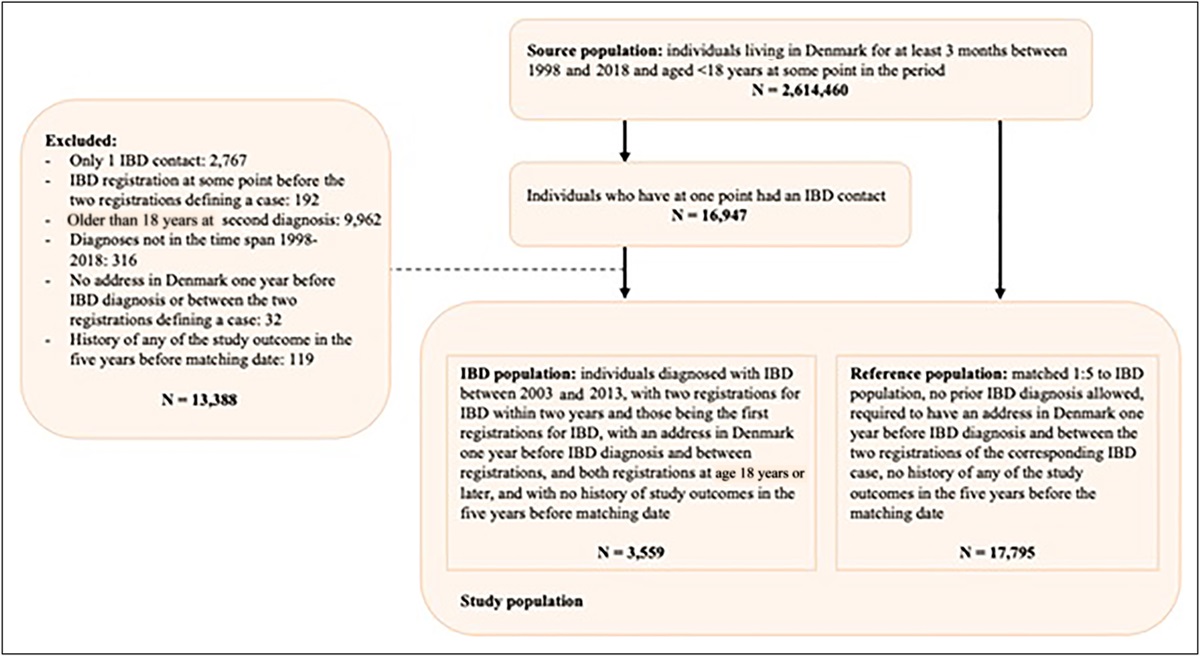
The following inclusion criteria were applied: (i) clinically or pathologically diagnosed as HCC; (ii) the Barcelona Clinic Liver Cancer stage C with portal vein tumor thrombus; (iii) Child-Pugh class A or B ≤7; (iv) fewer than 10 lesions in the liver and less than 15 cm in any dimension and lesions less than 50% of the volume of the liver; and (v) Eastern Cooperative Oncology Group performance status <2. The exclusion criteria were as follows: (i) complete occlusion of the main portal vein without collateral circulation; (ii) tumor thrombus invasion of the superior mesenteric vein; (iii) metastases invasion of the central nervous system (brain or spinal cord); (iv) received previous systemic therapy, including chemotherapy, targeted therapy, or immunotherapy; (v) concomitant with other malignant tumors; and (vi) experiencing other uncontrollable underlying diseases (including but not limited to hypertension, diabetes, heart disease, etc.) (Figure 1).
 Figure 1.:
 Flow diagram of patient screening. HCC, hepatocellular carcinoma; PVTT, portal vein tumor thrombus; TACE, transarterial chemoembolization.
Diagnostic criteria for HCC with PVTT consisted of a clear diagnosis of HCC and the presence of typical imaging signs of PVTT (real space-occupying lesions in the portal vein on computed tomography or magnetic resonance imaging (MRI)–enhanced scanning, enhancement in the arterial phase, and filling defect in the portal venous phase). PVTT classification adopts Cheng PVTT classification system proposed by Chinese professor Cheng Shuqun: type I, tumor thrombi involving segmental branches of the portal vein; type II, tumor thrombi involving the right/left portal vein; type III, tumor thrombi involving the main portal vein and trunk; and type IV, tumor thrombus invades superior mesenteric vein (9).
TACE procedureThe TACE procedure is consistent across centers, and as described in our previous report on the TACE procedure (10), all TACE procedures were performed by 2 experienced minimally invasive interventionalists under local anesthesia through a traditional femoral approach. After routine angiography using a 5F RH catheter (Terumo, Tokyo, Japan), superselective arterial cannulation with a microcatheter (Terumo) was used to access the branch of the feeding artery to the tumor. Doxorubicin (Haizheng Pharmaceutical, Taizhou, China) and lipiodol (Laboratoire Guerbet, Paris, France) were thoroughly mixed and injected into the tumor-nourishing blood vessels and then 560–710 μm gelatin sponge particles (ALICON Pharmaceutical, Hangzhou, China) were administered until blood flow almost stopped. The dosage of lipiodol was 5–20 mL, and the dosage of doxorubicin was 50–70 mg. The actual dose was based on the patient's liver function status, tumor burden, and the patient's body surface area.
Dosing regimen of apatinib and PD-1 inhibitorsPatients in both TACE-A and TACE-AP groups started oral apatinib (Hengrui Pharmaceutical, Lianyungang, China) 3 days after TACE at a dose of 250 mg/d. Simultaneously, patients in the TACE-AP group received an additional intravenous injection of PD-1 inhibitors (200 mg) every 3 weeks. Dosage adjustment or discontinuation was performed when patients experience serious adverse events (AEs) (≥grade 3). If the AE was judged to be related to apatinib, the apatinib was adjusted to be taken every other day. If the AEs persisted after dose adjustment or AE, namely gastrointestinal bleeding, related to any drug occurred, apatinib administration was temporarily discontinued. When AEs resolved, the dose was restored to 250 mg/d. PD-1 inhibitors were also discontinued if AEs were associated with them, and the drug was resumed after the AEs were eliminated.
Follow-up and study objectivesPatient follow-up should be performed every 4–6 weeks after TACE. The follow-up included chest computed tomography, liver multiphase-enhanced MRI, routine blood tests, and liver and renal function tests. When MRI results show recurrence or residual activity of the intrahepatic tumor, TACE should be repeated if the patient has good liver function test results (Child-Pugh class A or B ≤7). In this study, patients received apatinib continuously before TACE was repeated, and the treatment was interrupted for 3 days thereafter.
If the patient’s disease progressed during treatment or the treatment was terminated because of intolerable drug toxicity, the treatment plan was changed according to multidisciplinary consultation and the patient's wishes. The follow-up treatment plan was as follows: add PD-1 inhibitors (for patients in the TACE-A group) and use second-line targeted drug regorafenib, radiotherapy, hepatic arterial infusion chemotherapy, or best supportive care. Progression-free survival (PFS) and overall survival (OS) were the primary end points of this study, and prognostic factors affecting survival, objective response rate (ORR), and treatment-related AEs were the secondary end points of this study.
Evaluation criteriaPatients' progression-free survival was defined as the time from diagnosis to the assessment of progression, and overall survival was defined as the time from diagnosis to death or last follow-up. The evaluation criteria were modified Response Evaluation Criteria in Solid Tumors, and the evaluation results were divided into complete response, partial response, stable disease, and progressive disease. AEs were evaluated according to the National Cancer Institute Common Terminology Criteria for Adverse Events Version 5.0.
Statistical analysisTo reduce patient selection bias and balance the variables between patients in the 2 groups, we used propensity score matching (PSM) and inverse probability weighting (IPTW) for analysis. A 1:1 ratio was used for PSM analysis with a caliper value of 0.1. Because the weighted sample size is often larger than the original sample size, the increase of the sample size can easily lead to the appearance of false positives. Therefore, the use of stabilized IPTW (sIPTW) can reduce the probability of false-positive events.
Categorical variables were calculated using the χ2 test and expressed as percentages, and continuous variables were calculated using the t test and expressed as mean ± SD. The median OS and PFS between the 2 groups were estimated using the Kaplan-Meier method. Univariate analysis was used to assess the statistical significance of clinical characteristics, and multivariate Cox regression models were used to include statistically significant variables in the analysis to identify predictors associated with OS. Three cohorts were considered for all analyses: the crude, unmatched, and unweighted cohort; the IPTW cohort; and the PSM cohort. Balance between covariates was assessed using absolute standardized mean differences; differences of 10% or less were considered to indicate an adequately balanced outcome. A P value of <0.05 was considered statistically significant. All analyses were performed using R (version 4.1.2; R Foundation for Statistical Computing, Vienna, Austria; https://www.r-project.org/).
RESULTS Baseline characteristicsA total of 195 patients were screened, of whom 86 met the exclusion criteria and were excluded. Thus, a total of 109 patients were included in this study, of whom 69 received TACE-A and 40 received TACE-AP. PD-1 inhibitors were sintilimab (Innovent Pharmaceutical, Suzhou, China) in 14 cases (35%), camrelizumab (Hengrui Pharmaceutical, Lianyungang, China) in 11 cases (27.5%), tislelizumab (BeiGene Pharmaceutical, Shanghai, China) in 10 cases (25%), and pembrolizumab (Merck, Kenilworth, NJ) in 5 cases (12.5%). The baseline data of the 2 groups of patients showed differences, and the Child-Pugh scores of the 2 groups did not reach a sufficient balance (P < 0.05). After PSM and robust IPTW analyses, the baseline data of the 2 groups of patients reached a balance (Table 1).
Table 1. - Baseline characteristics of the 2 groups before and after PSM and sIPTW analyses Variable Crude cohort PSM cohort Stabilized IPTW cohort Grading TACE-A (n = 69) TACE-AP (n = 40) P value SMD TACE-A (n = 28) TACE-AP (n = 28) P value SMD TACE-A (67.8) TACE-AP (n = 40.2) P value SMD Sex Male 61 (88.4) 36 (90.0) 1.000 0.051 26 (92.9) 25 (89.3) 1.000 0.125 60.3 (88.9) 36.6 (90.9) 0.747 0.067 Female 8 (11.6) 4 (10.0) 2 (7.1) 3 (10.7) 7.5 (11.1) 3.6 (9.1) Age ≤60 47 (68.1) 29 (72.5) 0.792 0.096 19 (67.9) 20 (71.4) 1.000 0.078 45.8 (67.6) 29.0 (72.0) 0.673 0.097 >60 22 (31.9) 11 (27.5) 9 (32.1) 8 (28.6) 22.0 (32.4) 11.3 (28.0) Child-Pugh classification A 54 (78.3) 38 (95.0) 0.041 0.507 26 (92.9) 26 (92.9) 1.000 <0.001 57.0 (84.1) 32.3 (80.2) 0.743 0.102 B 15 (21.7) 2 (5.0) 2 (7.1) 2 (7.1) 10.8 (15.9) 8.0 (19.8) PVTT TypeⅠ 46 (66.7) 27 (67.5) 0.694 0.171 21 (75.0) 18 (64.3) 0.540 0.300 44.7 (65.9) 25.3 (62.8) 0.849 0.130 TypeⅡ 14 (20.3) 6 (15.0) 4 (14.3) 4 (14.3) 12.7 (18.7) 9.6 (23.9) TypeⅢ 9 (13.0) 7 (17.5) 3 (10.7) 6 (21.4) 10.4 (15.3) 5.4 (13.4) Metastasis None 42 (60.9) 19 (47.5) 0.248 0.271 14 (50.0) 15 (53.6) 1.000 0.072 36.6 (54.0) 21.6 (53.7) 0.982 0.005 Have 27 (39.1) 21 (52.5) 14 (50.0) 13 (46.4) 31.2 (46.0) 18.6 (46.3) AFP (ng/mL) <400 34 (49.3) 25 (62.5) 0.256 0.269 17 (60.7) 16 (57.1) 1.000 0.073 37.2 (54.9) 22.3 (55.4) 0.970 0.009 ≥400 35 (50.7) 15 (37.5) 11 (39.3) 12 (42.9) 30.5 (45.1) 17.9 (44.6) HBV None 24 (34.8) 16 (40.0) 0.735 0.108 11 (39.3) 11 (39.3) 1.000 <0.001 25.2 (37.2) 14.0 (34.9) 0.836 0.049 Have 45 (65.2) 24 (60.0) 17 (60.7) 17 (60.7) 42.6 (62.8) 26.2 (65.1) ECOG score 0 15 (21.7) 10 (25.0) 0.878 0.077 7 (25.0) 7 (25.0) 1.000 <0.001 16.5 (24.4) 9.0 (22.3) 0.823 0.051 1 54 (78.3) 30 (75.0) 21 (75.0) 21 (75.0) 51.2 (75.6) 31.3 (77.7) TBIL (g/L) 23.32 (10.11) 22.96 (9.27) 0.850 0.038 22.07 (8.45) 22.88 (10.14) 0.747 0.087 23.01 (9.74) 24.50 (11.20) 0.658 0.141 ALB (μmol/L) 35.91 (5.13) 37.47 (5.15) 0.129 0.304 36.05 (4.94) 36.83 (5.56) 0.582 0.148 36.41 (5.09) 35.55 (6.36) 0.584 0.151 ALT (U/L) 49.90 (82.23) 36.92 (15.35) 0.326 0.219 37.57 (18.61) 38.79 (16.00) 0.794 0.070 44.00 (67.24) 34.71 (14.91) 0.202 0.191 Cr (μmol/L) 56.09 (11.34) 60.37 (16.21) 0.109 0.306 55.64 (9.72) 56.00 (8.68) 0.884 0.039 56.65 (11.17) 57.96 (12.20) 0.543 0.112 No. of liver tumors 1 6 (8.7) 7 (17.5) 0.393 0.263 3 (10.7) 3 (10.7) 0.850 0.153 6.3 (9.3) 3.9 (9.8) 0.905 0.091 2 38 (55.1) 20 (50.0) 15 (53.6) 13 (46.4) 35.4 (52.3) 19.2 (47.8) ≥3 25 (36.2) 13 (32.5) 10 (35.7) 12 (42.9) 26.0 (38.4) 17.1 (42.4) Maximum tumor diameter (mm) 72.31 (37.51) 73.16 (35.45) 0.907 0.023 75.12 (34.33) 69.46 (33.52) 0.535 0.167 71.82 (36.64) 70.98 (31.36) 0.898 0.024 No. of TACE 1.88 (1.11) 1.90 (1.19) 0.944 0.014 1.64 (0.78) 1.86 (1.27) 0.450 0.204 1.84 (1.08) 1.83 (1.11) 0.974 0.007ALB, albumin; ALT, alanine aminotransferase; AFP, alpha-fetoprotein; Cr, creatinine; ECOG, Eastern Cooperative Oncology Group; HBV, hepatitis B virus; PSM, propensity score matching; PVTT, portal vein tumor thrombus; sIPTW, stabilized inverse probability of treatment weighting; SMD, standardized mean differences; TACE, transarterial chemoembolization; TACE-A, TACE combined with apatinib; TACE-AP, TACE combined with apatinib and PD-1 inhibitors; TBIL, total bilirubin.
In the crude cohort, the ORRs for the TACE-A and TACE-AP groups were 28.9% and 57.5%, respectively, and the difference between the 2 groups was statistically significant (P < 0.05) (Table 2). After PSM and sIPTW analyses, the ORRs for the TACE-AP group were 53.6% and 52.5%, respectively, which were significantly higher than 17.9% and 28.6% of the TACE-A group (P < 0.05).
Table 2. - Objective tumor response rates before and after PSM and sIPTW analyses Tumor response Crude cohort P value PSM P value sIPTW P value TACE-A (n = 69) TACE-AP (n = 40) TACE-A (n = 28) TACE-AP (n = 28) TACE-A (n = 67.8) TACE-AP (n = 40.2) CR 2 3 0 1 1.8 3.9 PR 18 20 5 14 17.6 17.2 SD 29 8 16 8 29 11.8 PD 20 9 7 5 19.4 7.3 ORR (CR + PR) 29.0% 57.5% 0.003 17.9% 53.6% 0.005 28.6% 52.5% 0.013CR, complete response; ORR, objective response rate; PD, progressive disease; PR, partial response; PSM, propensity score matching; sIPTW, stabilized inverse probability of treatment weighting; SD, stable disease; TACE, transarterial chemoembolization; TACE-A, TACE combined with apatinib; TACE-AP, TACE combined with apatinib and PD-1 inhibitors.
As of the last follow-up (June 2022), in the crude cohort, the mPFS was 5.0 months (95% confidence interval [CI] 3.3–5.7) and 6.9 months (95% CI 5.0–8.0) in the TACE-A and TACE-AP groups (P < 0.001) (Figure 2a). After PSM analysis, the mPFS of the TACE-A and TACE-AP groups were 4.0 months (95% CI 3.0–6.0) and 6.9 months (95% CI 5.0–8.0), respectively (P = 0.004) (Figure 2b). After sTPTW analysis, the mPFS of the TACE-A and TACE-AP groups were 5.1 months (95% CI 3.3–5.8) and 6.5 months (95% CI 3.1–8.9), respectively (P < 0.001) (Figure 2c).
 Figure 2.:
 Kaplan-Meier analyses of PFS according to the TACE-A group and TACE-AP group in the crude cohort (a), PSM cohort (b), and sIPTW cohort (c). PFS, progression-free survival; PSM, propensity score matching; sIPTW, stabilized inverse probability of treatment weighting; TACE, transarterial chemoembolization; TACE-A, TACE combined with apatinib; TACE-AP, TACE combined with apatinib and PD-1 inhibitors.
In the crude cohort, the median OS was 10.5 months (95% CI 7.4–15.0) in the TACE-A group and 16.4 months (95% CI 9.9–25.5) in the TACE-AP group (P < 0.001) (Figure 3a). After PSM analysis, the median OS values of the TACE-A and TACE-AP groups were 8.5 months (95% CI 6.0–16.0) and 14.6 months (95% CI 9.8–25.5), respectively (P = 0.0087) (Figure 3b). After sTPTW analysis, the median OS values of the TACE-A and TACE-AP groups were 10.5 months (95% CI 8.0–15.0) and 16.1 months (95% CI 6.4–26.0), respectively (P < 0.001) (Figure 3c).
 Figure 3.:
 Kaplan-Meier analyses of OS according to the TACE-A group and TACE-AP group in the crude cohort (a), PSM cohort (b), and sIPTW cohort (c). OS, overall survival; PSM, propensity score matching; sIPTW, stabilized inverse probability of treatment weighting; TACE, transarterial chemoembolization; TACE-A, TACE combined with apatinib; TACE-AP, TACE combined with apatinib and PD-1 inhibitors.
OS-related prognostic factorsUnivariate and multivariate Cox analyses were used to identify prognostic factors affecting OS (Table 3). In crude cohort and sIPTW cohort, univariate analysis showed that the prognostic factors affecting OS were tumor number, PVTT type, treatment modality, and alpha-fetoprotein (AFP) (P < 0.05). Multivariate Cox analysis showed that PVTT type (P < 0.001), AFP ≥400 ng/mL, and multiple tumors were independent risk factors of OS (P < 0.05), while TACE-AP treatment was an independent protective factor of OS (P < 0.05). However, in the PSM cohort, univariate and multivariate analyses showed that only PVTT type, treatment modality, and AFP were prognostic factors of OS (P < 0.05).
Table 3. - Analyses of prognostic factors for survival before and after PSM and sIPTW analyses Variable Crude cohort PSM sIPTW Univariate analysis Multivariate analysis Univariate analysis Multivariate analysis Univariate analysis Multivariate analysis HR (95% CI) P value HR (95% CI) P value HR (95% CI) P value HR (95% CI) P value HR (95% CI) P value HR (95% CI) P value Age 1.03 (0.67–1.58) 0.899 0.83 (0.46–1.51) 0.547 0.95 (0.61–1.50) 0.841 Sex 0.87 (0.47–1.59) 0.641 0.95 (0.37–2.42) 0.917 0.83 (0.50–1.40) 0.492 Child-Pugh classification = B 0.98 (0.54–1.75) 0.936 0.66 (0.2–2.22) 0.505 0.91 (0.55–1.48) 0.620 Metastasis 0.94 (0.63–1.4) 0.768 0.98 (0.57–1.7) 0.946 0.98 (0.57–1.7) 0.963 PVTT type II 2.73 (1.6–4.68) 0.000 2.49 (1.41–4.39) 0.001 2.72 (1.14–6.5) 0.025 2.91 (1.22–6.98) 0.017 2.97 (1.64–5.37) 0.000 2.81 (1.67–4.82) 0.000 PVTT type III 7.18 (3.9–13.2) 0.000 7.97 (3.96–16.03) 0.000 5.5 (2.46–12.31) 0.000 6.51 (2.47–17.14) 0.001 9.21 (4.41–19.24) 0.000 8.88 (3.91–20.18) 0.000 AFP ≥400 ng/mL 2.91 (1.91–4.45) 0.000 1.69 (1.07–2.68) 0.025 2.61 (1.47–4.64) 0.001 1.93 (1.00–3.73) 0.049 2.84 (1.74–4.65) 0.000 1.77 (1.06–2.96) 0.028 HBV 1.07 (0.71–1.61) 0.758 1.31 (0.74–2.33) 0.358 1.30 (0.77–2.19) 0.334 ECOG = 1 0.75 (0.47–1.2) 0.231 0.79 (0.42–1.5) 0.473 0.84 (0.53–134) 0.461 TBIL 1.01 (0.99–1.03) 0.344 1.02 (0.99–1.05) 0.118 1.02 (0.99–1.04) 0.146 ALB 1.01 (0.97–1.04) 0.682 1.01 (0.97–1.06) 0.556 1.03 (0.98–1.08) 0.222 ALT 1 (1–1) 0.810 1.01 (0.99–1.03)
留言 (0)