
記住我


Pancreatitis is an inflammatory disease that ranges from acute (AP) to recurrent acute (RAP) to chronic pancreatitis (CP), and cases have increased by 13.3% in the past 2 decades (1). Patients with CP are at risk of long-term complications, including chronic abdominal pain, diabetes, exocrine pancreatic dysfunction (EPD), osteopathy, and pancreatic cancer (2). Our understanding of CP pathophysiology remains limited, leading to extensive testing, delayed diagnosis, and a lack of biomarkers and effective therapies (3–5).
Our systematic review investigating potential CP biomarkers indicated that neutrophil gelatinase-associated lipocalin (NGAL/lipocalin 2) was elevated in pancreatic juice of CP patients, warranting further evaluation as a potential biomarker of CP (5). NGAL is a secreted protein in the lipocalin family that binds hydrophobic ligands, including fatty acids (FAs) such as linoleic acid, and siderophores, as part of an acute-phase inflammatory response (6–11). Increased NGAL expression promotes lipolysis and FA oxidation, releasing FAs from intracellular storage during inflammation (12). NGAL contributes to pancreatic cancer pathogenesis by regulating inflammation in pancreatic tumors and is increased in the blood of subjects with pancreatic cancer compared with controls (13). Increased NGAL expression in immune cell subtypes within the peripheral blood mononuclear cells (PBMCs), such as B cells in chronic lymphocytic leukemia (14) and CD4+ T cells in acute kidney injury (15), is associated with apoptosis inhibition and enhanced proinflammatory or profibrotic effects (14,16). Although studies have assessed NGAL as a potential biomaker for CP in various biofluids, the studies were small, lacked well-controlled sample acquisition and clinical criteria, and focused on a comparison between CP and pancreatic cancer instead of a control group (13,17–19).
We evaluated whether NGAL levels or NGAL+ PBMCs could serve as diagnostic biomarkers of CP and gain insights into inflammatory alterations associated with CP. Furthermore, we investigated whether FAs known to interact with NGAL were altered in CP to better understand the metabolic alterations in this disease.
METHODS Study designThis study used well-defined human samples from the prospective multicenter study Prospective Evaluation of Chronic Pancreatitis for Epidemiologic and Translational Studies (PROCEED) (NCT03099850), a study of the Chronic Pancreatitis, Diabetes, and Pancreatic Cancer consortium (20,21). Subjects selected for the current analysis were enrolled into PROCEED, from June 2017 to September 2020 and included a random sampling of healthy controls (n = 50), AP/RAP (n = 71), and CP (n = 50). Sample size was determined by a small pilot study using a separate set of samples from the Ohio State University. PBMCs from controls (n = 16), AP/RAP (n = 17; 1 subject with AP), and CP (n = 15) subjects were selected from the PROCEED biorepository based on sample availability. AP and RAP were diagnosed using the revised Atlanta criteria (22), and CP was diagnosed as previously described (20) based on pancreatic calcifications and/or advanced Cambridge stage. Inclusion and exclusion criteria for the PROCEED cohort included in this study are previously published and summarized in Supplementary Table 1 (see Supplementary Digital Content 1, https://links.lww.com/CTG/B85) (20,21). Samples (plasma, urine, and PBMCs) were collected 1 month after an acute attack to prevent bias from acute inflammation. Data for sex, age, body mass index (BMI), etiology, presence of EPD, diabetes status, and smoking history were retrieved from PROCEED (20).
Enzyme-linked immunosorbent assayPlasma and urine NGAL concentrations were measured using an enzyme-linked immunosorbent assay (DLCN20; R&D Systems, Minneapolis, MN) following the manufacturer's recommended protocol. All samples were measured in duplicate and reported in nanograms per milliliter determined from a standard curve. The personnel and study team were blinded to group assignment.
Mass cytometry by time-of-flightPBMCs were thawed and processed as previously described (21). PBMCs were stained using the Maxpar Direct Immune Profiling Assay kit (PN 400286 B1; Standard BioTools, San Francisco, CA) with the addition of CD11b (Standard BioTools) and CD33 (BioLegend, San Diego, CA) antibodies (see Supplementary Table 2, Supplementary Digital Content 1, https://links.lww.com/CTG/B85) (23). After surface staining, the cells were fixed, permeabilized, and intracellularly stained for NGAL (ab224264; Abcam, Cambridge, UK), which was conjugated to metal isotope 159Tb, using the Maxpar X8 Antibody Labeling Kit, 159Tb-4 RXN (Standard BioTools, see Supplementary Table 2, Supplementary Digital Content 1, https://links.lww.com/CTG/B85). The stained PBMCs were analyzed on a Fluidigm Helios Mass Cytometer. Data concatenation and normalization were performed using the Cytobank software v7.0 (Beckman Coulter). Samples with more than 100,000 events were used for analysis. PBMC populations and subsets were gated based on phenotypic markers of each population (see Supplementary Table 3, Supplementary Digital Content 1, https://links.lww.com/CTG/B85) (23). Differences in NGAL+ of PBMC populations were calculated as the number of cells positive for NGAL within an immune population divided by the number of live PBMCs positive for NGAL. Differences in NGAL+ PBMC subsets were calculated as the number of cells positive for NGAL within an immune subpopulation divided by the number of cells positive for NGAL within the respective parent population (see Supplementary Table 3, Supplementary Digital Content 1, https://links.lww.com/CTG/B85).
FA composition analysisTotal lipids were extracted from plasma samples using the 2:1 chloroform:methanol method and methylated (24,25) as we previously described (26–29), blinded to disease group. The methyl ester form of the FAs was analyzed using gas chromatography run on a 30-m Omegawax TM 320 fused silica capillary column (Supelco, Bellefonte, PA), with the oven temperature and carrier gas flow rate settings as previously described (29,30). Results were compared with purchased standards for each FA methyl ester (Matreya, LLC, Pleasant Gap, PA; Nu-Check Prep, Elysian, MN). The data are presented as the relative composition of all identified FAs (% area), as recommended by experts in the field for clinical studies (30,31).
Statistical analysisStatistical analyses were performed using GraphPad Prism 9 (GraphPad Software, San Diego, CA), JMP 16 (SAS Institute, Cary, NC), and R version 4.1.2 (R Foundation for Statistical Computing, Vienna, Austria). Relative frequencies were reported and compared for categorical variables using Fisher exact test or χ2 tests of independence, whereas mean values and SDs were reported and compared by study group for the continuous age variable using 1-way ANOVA. Because EPD was an exclusion criterion for the control group in the PROCEED study and none of our control subjects had diabetes, we did not include controls when comparing the difference in these clinical factors using χ2 tests between AP/RAP and CP. Propensity score matching on the covariates of sex, age, BMI, and smoking was used to calculate the average treatment effect for NGAL when comparing control with CP, control with AP/RAP, and AP/RAP with CP. Receiver operator characteristic curves were generated, the area under the curve (AUC) was calculated to assess the ability of NGAL concentration to distinguish between study groups, and a multiple logistic regression was used to control for clinical characteristics. A 2-way ANOVA with Tukey's testing for pairwise comparisons on log-transformed NGAL concentrations compared NGAL across groups by categorical subject characteristics. Because age is a continuous variable, we performed a correlation analysis between age and NGAL and assessed differences in the correlation slopes and intercepts. Nonparametric Kruskal-Wallis tests were performed on the percentages of NGAL+ PBMC populations and subsets and on overall PBMC populations and subsets to compare the differences between controls, AP/RAP, and CP. FA composition was compared among the disease groups using 1-way ANOVA parametric test, or Kruskal-Wallis nonparametric test, with Holm-Šidák correction for multiple testing. T-test or Mann-Whitney nonparametric test was used to assess differences in FA composition in CP based on diabetes.
RESULTS Study group characteristicsAll groups had similar sex distributions. On average, the CP group was older, leaner, more likely to smoke, and more likely to have EPD compared with the AP/RAP group and, where applicable, the control group. Idiopathic and hypertriglyceridemia etiologies were more common in the AP/RAP group, whereas alcoholic and genetic etiologies were more common in the CP group (Table 1, top). In the subset of subjects with available PBMCs, age, etiology, EPD, and smoking were all different between the controls and disease groups (Table 1, bottom).
Table 1. - Comparison of patient characteristics by PROCEED study group Plasma/urine ControlResults for subjects with available plasma and urine are shown at the top, whereas results for subjects with available PBMCs are shown at the bottom. Subject age was analyzed using 1-way ANOVA with Tukey's HSD for multiple comparisons. Subject sex, BMI, pancreatitis etiology, EPD, diabetes status, and cigarette use were analyzed using χ2 analysis.
AP, acute pancreatitis; BMI, body mass index; CP, chronic pancreatitis; EPD, exocrine pancreatic dysfunction; HSD, honestly significant difference; PBMC, peripheral blood mononuclear cell; RAP, recurrent acute pancreatitis.
aP < 0.05 between AP/RAP and CP.
bMissing data from some of the cases.
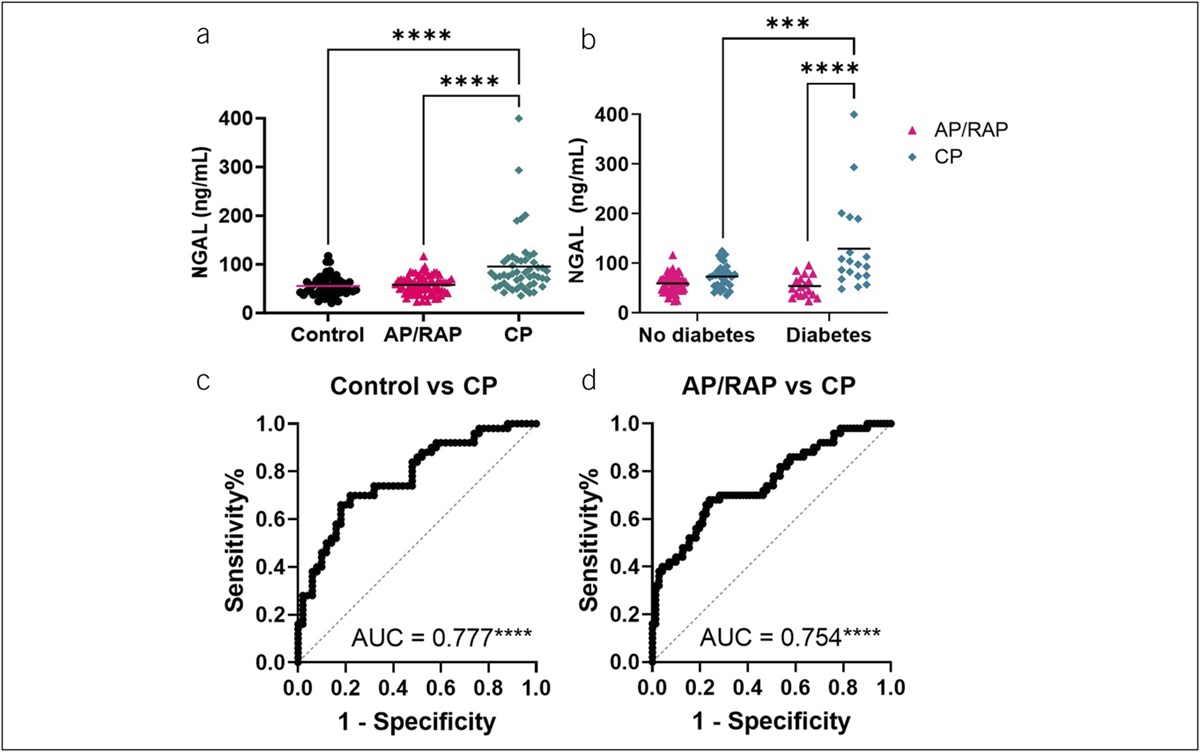
Plasma NGAL levels were higher, on average, in CP compared with control and AP/RAP (Figure 1a). Two-way ANOVAs assessing the interaction between study group and the clinical characteristics of sex, BMI, pancreatitis etiology, EPD, and smoking history and a correlation analysis between NGAL and age demonstrated that NGAL remained higher, on average, in CP compared with control and AP/RAP within the subgroups of each of the clinical features, indicating the differences in NGAL are attributable to disease group rather than these clinical features (see Supplementary Figure 1A–F, Supplementary Digital Content 1, https://links.lww.com/CTG/B85). NGAL was significantly elevated in subjects with both CP and diabetes, compared with CP subjects without diabetes (P = 0.0009) (Figure 1b). We did not observe any significant difference in the urine NGAL levels between any of the groups (see Supplementary Figure 2, Supplementary Digital Content 1, https://links.lww.com/CTG/B85). We generated receiver operator characteristic curves to assess NGAL's potential as a biomarker and found that NGAL distinguished CP from control (AUC = 0.777; P < 0.0001) (Figure 1c) and CP from AP/RAP (AUC = 0.754; P < 0.0001) (Figure 1d). Propensity score matching to mitigate the possible effect of clinical features (age, sex, BMI, and smoking) on the difference in NGAL levels between groups continued to provide evidence of significantly higher NGAL levels in subjects with CP compared with controls (P = 0.011) and AP/RAP (P = 0.007) (Table 2). The matching resulted in similar AUCs for NGAL differentiating CP vs control or AP/RAP (Table 2).
 Figure 1.:
 NGAL expression increases in the plasma of subjects with CP. (a) NGAL measured by ELISA from the multicenter (PROCEED) study discovery set. Statistical significance was determined by a non-parametric 1-way ANOVA with Tukey's multiple comparisons correction. (b) AP/RAP and CP samples were subdivided by diabetes status and compared for plasma NGAL concentration. Statistical significance was determined by 2-way ANOVA with Tukey's multiple testing correction. (c) ROCs with AUCs of plasma NGAL comparing control vs CP and (d) AP/RAP vs CP. ***P < 0.001, ****P < 0.0001. AP, acute pancreatitis; CP, chronic pancreatitis; ELISA, enzyme-linked immunosorbent assay; NGAL, neutrophil gelatinase-associated lipocalin; RAP, recurrent acute pancreatitis.
Table 2. - Propensity score matching for plasma NGAL in CP Disease ATT (SE) t statistic ROC AUC CP (n = 50) vs control (n = 21) 42.06 (16.56) 2.54* 0.785*** CP (n = 50) vs AP/RAP (n = 27) 35.83 (13.33) 2.69** 0.739*** AP/RAP (n = 71) vs control (n = 34) 6.27 (4.83) 1.30ATT, average treatment effect on the disease group; AP, acute pancreatitis; AUC, area under the curve; CP, chronic pancreatitis; RAP, recurrent acute pancreatitis; ROC, receiver operator characteristic.
*P < 0.05, **P < 0.01, ***P < 0.001.
To evaluate the predictive performance of NGAL in combination with clinical features, multivariate models to predict CP (vs control and vs AP/RAP) were fit using NGAL, age, sex, BMI, and smoking as predictors. Diabetes and EPD were excluded because these are complications of CP that may cause an overestimation of NGAL's discriminative ability. The regression results (Table 3) showed that a model that includes clinical features in addition to NGAL improved AUC over NGAL alone for CP compared with control (AUC = 0.874; P < 0.0001) and for CP compared with AP/RAP (AUC = 0.819; P < 0.0001). In the multivariable models, NGAL significantly contributed to the differentiation of CP and controls (P < 0.001) and CP and AP/RAP (P < 0.001) after controlling for these clinical features. History of smoking and low BMI also made a significant contribution to the differentiation of CP vs controls or AP/RAP.
Table 3. - Multiple logistic regressions using plasma NGAL (top) or NGAL+ PBMC subpopulations (bottom) to predict CP Odds ratio 95% CI P value AUC Plasma NGAL Control vs CP 0.874**** Intercept 5.52 0.20–170.4 0.316 NGAL (1 ng/mL) 1.05 1.02–1.08 <0.001 Sex (male) 0.63 0.20–1.85 0.405 Age (yr) 1.01 0.97–1.05 0.809 BMI (kg/m2) 0.87 0.77–0.96 0.012 Smoking (never) 0.14 0.04–0.38 <0.001 AP/RAP vs CP 0.819**** Intercept 0.56 0.03–10.5 0.703 NGAL (1 ng/mL) 1.04 1.02–1.07 <0.001 Sex (male) 0.89 0.35–2.27 0.809 Age (yr) 1.03 1.0–1.07 0.096 BMI (kg/m2) 0.87 0.78–0.95 0.003 Smoking (never) 0.42 0.16–1.05 0.069 NGAL+ PBMCs Control vs CP 0.950**** Intercept 10.39 0.002–93833 0.585 CD8+ central memory T cells 1.59 1.13–2.82 0.033 CD8+ effector T cells 0.98 0.89–1.08 0.750 Naive CD4+ T cells 0.95 0.85–1.04 0.273 Memory resting B cells 0.83 0.60–0.96 0.137 Myeloid dendritic cells 0.94 0.82–1.05 0.298 AP/RAP vs CP 0.941**** Intercept 10.64 0.001–645744 0.631 CD8+ central memory T cells 1.63 1.14–3.15 0.051 CD8+ effector T cells 1.06 0.94–1.22 0.392 Naive CD4+ T cells 1.04 0.92–1.19 0.565 Memory resting B cells 0.90 0.65–1.19 0.447 Myeloid dendritic cells 0.88 0.75–0.98 0.044PROCEED study NGAL+ PBMC subpopulations that were significantly different between CP and either control or AP/RAP were considered.
AP, acute pancreatitis; BMI, body mass index; CP, chronic pancreatitis; NGAL, neutrophil gelatinase-associated lipocalin; PBMC, peripheral blood mononuclear cell; RAP, recurrent acute pancreatitis.
****ROC AUC P < 0.0001.
Immune cells are one of several sources of systemic NGAL, particularly in inflammatory conditions (15). Therefore, we performed mass cytometry by time-of-flight (CyTOF) to determine whether there were differences in NGAL+ PBMCs for patients with CP. When assessing NGAL+ cells as a percentage of live PBMCs, there were more NGAL+ B cells in CP compared with controls (P = 0.021) (Figure 2a), with similar results in the overall PBMC populations (see Supplementary Figure 3A, Supplementary Digital Content 1, https://links.lww.com/CTG/B85). We observed differences in NGAL+ PBMC subpopulations as a percentage of the NGAL+ parent population between controls, AP/RAP, and CP (Figure 2b). Compared with controls, CP subjects had less NGAL+ naive CD4+ T cells (P = 0.037) and memory B cells (P = 0.019) and more NGAL+ CD8+ central memory T cells (P = 0.009). Compared with AP/RAP, the CP group had fewer NGAL+ memory resting B cells (P = 0.027) and myeloid dendritic cells (P = 0.042) and more NGAL+ CD8+ central memory T cells (P = 0.001) and CD8+ effector T cells (P = 0.041). There were fewer NGAL+ CD16− and more NGAL+ CD16+ natural killer cells (P = 0.034) in subjects with AP/RAP compared with control subjects (Figure 2b). Some of these shifts occurred in the overall PBMCs immune cell subpopulations (see Supplementary Figure 3B, Supplementary Digital Content 1, https://links.lww.com/CTG/B85). These differences in immune cells suggest a shift away from an innate immune response and toward an adaptive immune response during CP that is enhanced in NGAL+ cells.
 Figure 2.:
 NGAL+ immune cells within PBMC populations and subsets tends to increase in the adaptive immune cells of subjects with CP. PBMCs from multicenter (PROCEED) discovery set (healthy controls, AP/RAP, and subjects with CP) collected during enrollment visit were analyzed by CyTOF. (a) Proportion of NGAL+ immune populations (b) and subpopulations. aP < 0.05 between control and CP; bP < 0.05 between AP/RAP and CP; cP < 0.05 between control and AP/RAP; ****P < 0.001. AP, acute pancreatitis; CP, chronic pancreatitis; CyTOF, mass cytometry by time-of-flight; NGAL, neutrophil gelatinase-associated lipocalin; PBMC, peripheral blood mononuclear cell; RAP, recurrent acute pancreatitis.
Multiple logistic regressions of the immune cell populations that were significantly different between CP and either the control or AP/RAP groups were fit to determine the utility of this combination of NGAL+ PBMC subpopulations for distinguishing CP from either controls or AP/RAP. A panel of NGAL+ CD8+ central memory T cells, CD8+ effector T cells, naive CD4+ T cells, memory resting B cells, and myeloid dendritic cells differentiated control from CP (AUC = 0.950; P < 0.0001) and AP/RAP from CP (AUC = 0.941; P < 0.0001) (Table 3). By contrast, the same overall PBMC subpopulations resulted in lower AUCs comparing control with CP (AUC = 0.883; P < 0.0001) and AP/RAP with CP (AUC = 0.890; P < 0.0001) (see Supplementary Table 6, Supplementary Digital Content 1, https://links.lww.com/CTG/B85). This suggests that a subset of circulating NGAL+ immune cells could be used as a potential biomarker panel for CP.
FA composition is altered in CPBecause NGAL binds FAs such as linoleic acid, we measured FA composition in the plasma of the same subjects for whom we measured NGAL levels. Three polyunsaturated FAs (PUFAs) were differentially affected in CP compared with controls or AP/RAP. Linoleic acid was lower, whereas dihomo-γ-linolenic and adrenic acids were higher in CP compared with AP/RAP (Figure 3a). Because several FAs interact with NGAL and NGAL is modulated by both CP and diabetes, we assessed whether FA composition was also different in subjects with CP and diabetes compared with those without diabetes. Interestingly, like NGAL, plasma linoleic acid was also significantly higher in subjects with diabetes and CP compared with those with CP without diabetes (P = 0.0471) (Figure 3b). Overall, the differences observed suggest a dysregulation of PUFAs in CP.
 Figure 3.:
 PUFA composition is altered in the plasma of subjects with CP. (a) Plasma FAs ordered by saturation and carbon chain number compared by 1-way ANOVA with multiple testing for significance. (b) Plasma FAs from subjects with CP subdivided by diabetes compared by t tests. +Nonparametric Kruskal-Wallis or Mann-Whitney *P < 0.05. AP, acute pancreatitis; CP, chronic pancreatitis; FA, fatty acid; MUFA, monounsaturated FA; PUFA, polyunsaturated FA; RAP, recurrent acute pancreatitis; SFA, saturated FA.
DISCUSSIONOne of the key distinctions between AP/RAP and CP is the constant proinflammatory state in CP, leading to complications such as fibrosis and calcification. However, these complications are typically observable by imaging once CP is severe as the spectrum of pancreatitis lacks biomarkers to discern between disease stages. In this study, we demonstrated elevated plasma NGAL levels in patients with CP, especially those with diabetes. NGAL emerged as a promising biomarker for CP, particularly when coupled with easily accessible clinical characteristics. Furthermore, our investigation revealed alterations in NGAL+ PBMCs, suggesting a transition from a naive state to memory and effector cell types in CP. These differences could potentially form a panel for distinguishing CP from controls or AP/RAP. Furthermore, we identified differences in plasma linoleic acid composition in CP and CP combined with diabetes The changes observed in NGAL and PUFAs known to interact with NGAL in CP reflect metabolic changes that may explain some of the pathophysiologic features of CP.
NGAL regulates inflammation, particularly in cancers such as pancreatic cancer, and has been suggested to have clinical value in diagnosing the spectrum of pancreatic diseases, including AP, CP, and pancreatic cancer (7). However, previous studies assessing NGAL as a biomarker of pancreatic diseases mainly compared CP with pancreatic cancer or AP to controls (5,7). These studies had low sample sizes, different criteria to define CP, and did not
留言 (0)