
記住我
Contributing to tumorigenesis and tumor development, the tumor microenvironment (TME) contains a complex profile of cells, cytokines and chemokines.1 2 As a major component of immune cells in the TME, tumor-associated macrophages (TAMs) account for up to 50% of cells in the tumor mass and are generally relevant to worse prognosis in cancer patients.3 4 Macrophages have traditionally been divided into the antitumor M1-like phenotype which has high levels of iNOS, TNF-α or IL-12 and the pro-tumor M2-like phenotype, which is characterized by high expression of Arg-1, CD206, IL-10 or TGF-β.5 However, this is far from enough because these two states are not separated entirely but a dynamic process of mutual transformation. With recent single-cell analysis using mass spectrometric and RNA sequencing techniques, a new dimension has been added to the dissection of macrophage diversity.6 7 Although the concept of M1-like and M2-like macrophage is no longer considered appropriate, most studies continue to use M1-M2 associated markers for characterization of TAMs, as there is extensive experience based on the correlation between their expression and prognosis in tumor models and human cancers.8–10
TAMs usually exhibit the properties of M2-like macrophages in TME and are involved directly or indirectly in tumor progression.11–13 As TAMs are a dynamic population of cells, switching TAMs toward an antitumor phenotype may provide an opportunity to reshape the immunosuppressive TME and restrain the development of cancers. Despite recent progress in preclinical and clinical studies, there are still some unanswered questions. Thus, illustrating the exact mechanisms of macrophage polarization could help explore promising and effective immunotherapies for tumors.
Long non-coding RNAs (lncRNAs), mainly localized in the nucleus, are typically longer than 200 nucleotides and have little or no protein-coding potential.14 15 By interacting with DNA, RNA and proteins, lncRNAs exert their functions via epigenetic modification, transcriptional control and translational regulation, and are linked to the pathogenesis of diseases.16 17 Recent reports have shown that some lncRNAs participate in macrophage polarization, such as MM2P and RPPH1.18–20 However, the detailed molecular mechanisms of lncRNAs on macrophage polarization remain to be deeply elucidated.
In this work, we utilized lncRNA specific microarray assays to identify lncRNAs differentially expressed in M0, M1-like and M2-like macrophages derived from THP-1 cells.21–23 For the first time, we revealed a novel lncRNA NR_109 which was elevated in M2-like macrophages. Moreover, NR_109 knockdown hindered IL-4 induced M2-like macrophage polarization and transattenuated the proliferation and metastasis of tumors both in vitro and in vivo. Mechanically, NR_109 regulated macrophage phenotype remodeling through a positive feedback loop of NR_109/FUBP1/c-Myc. Overall, our study discovered a novel mechanism on macrophage polarization and provided insights into developing macrophage-targeting cancer immunotherapy.
MethodsCell cultureTHP-1 human mononuclear cell line, Eca-109 human esophageal cancer cell line, AGS and BGC-823 human gastric cancer (GC) cell lines, MDA-MB-231 human breast cancer cell line and A549 human lung cancer cell line were obtained from the Type Culture Collection of the Chinese Academy of Sciences (Shanghai, China) between 2012 and 2015 and were stored in liquid nitrogen tanks in the Research Center of the Fourth Hospital of Hebei Medical University. The cells were cultured in RPMI 1640 or DMEM media (both from Gibico, USA) supplemented with 10% fetal bovine serum (FBS), BI, Israel) and maintained at 37℃ in a 5% CO2 incubator. The cell lines used for experiments had been passaged no more than 20 times and cells were monitored for mycoplasma contamination every 6 months.
Preparation and simulation of macrophagesTHP-1 cells (3×10⁵/mL) were seeded in six-well plates and cultured in RPMI 1640 media with PMA (50 ng/mL, Sigma, USA) for 48 hours, which were considered as M0 macrophages. After resting for 24 hours, we added lipopolysaccharides (LPS), 100 ng/mL, Sigma, USA) and IFN-γ (20 ng/mL, Pepro Tech, USA) or IL-4 (20 ng/mL, Pepro Tech, USA) to the M0 cells to induce M1-like or M2-like macrophages. Peripheral blood monocytes (PBMCs) from healthy donors were isolated by Ficoll density gradient centrifugation and CD14+ cells were separated from freshly isolated PBMC with the Human CD14+ microbeads using a MACS system (Miltenyi Biotec, Germany). For differentiation, CD14+ monocytes were cultured for 6 days in the presence of recombinant human granulocyte-macrophage colony-stimulating factor (GM-CSF), 10 ng/mL, Pepro Tech, USA) or M-CSF (25 ng/mL, Pepro Tech, USA). For M1-like macrophage polarization, monocytes treated with GM-CSF for 6 days were then treated with LPS (100 ng/mL) and IFN-γ (20 ng/mL). For M2-like macrophage polarization, monocytes treated with M-CSF for 6 days were then treated with IL-4 (25 ng/mL).
Microarray analysisTotal RNA was extracted from THP-1-induced M0, M1-like and M2-like macrophages using TRIzol reagent (Invitrogen, USA). RNA integrity was verified using an Agilent 2100 bioanalyzer (Agilent, USA). The expression of lncRNAs and mRNAs in M0, M1-like and M2-like macrophages was analyzed using the lncRNA-specific microarrays (the Agilent SBC human lncRNA Microarray V.6.0 (4×180K), which contained 180,000 probes and was performed by Shanghai Biotechnology). LncRNAs were deemed differentially expressed according to the following criteria: fold change ≥2 or ≤ 0.5, and p<0.05.
Patients and healthy donorsFresh primary GC tissues, the matched adjacent non-neoplastic tissues and human blood samples were collected from the Fourth Hospital of Hebei Medical University between 2017 and 2018. All samples were diagnosed blindly by 2–3 pathologists. The inclusion criteria required that patients had primary gastric adenocarcinoma at stages I–IV, had received surgery as the initial treatment and had complete clinicopathological data.
TAMs isolation from tissuesTAMs isolated from primary GC tissues (pri-GC) or the matched adjacent non-neoplastic tissues (non-GC) following a published method by Li et al with some modifications.24 Briefly, the tissues were collected immediately after the surgery, minced into small pieces (1–2 mm) and digested with DNase Ⅰ (Takara, Japan) and collagenase IV (Sigma, USA) for 2 hours at 37°C under constant shaking. The cells were sequentially filtered through a 100-mesh sieve and then centrifuged at 400 g for 10 min. Then, the cells were resuspended in 2 mL RPMI 1640 medium with 1% FBS and cultured in a 37°C incubator. After 1 hour, the adherent cells were considered as macrophages isolated from tissues.
Rapid amplification of cDNA ends assayTo characterize the 5' and 3' ends of NR_109, total RNA extracted from THP-1-induced M2-like macrophages was used to generate rapid amplification of cDNA ends assay (RACE)-ready cDNA, and PCR was performed using a 5' and 3' RACE System for Rapid Amplification of cDNA Ends Kit (Invitrogen, USA). The cDNA ends were amplified with universal and gene specific primers.
TransfectionSmall interfering RNA (siRNAs) against NR_109, far upstream element-binding protein 1 (FUBP1), c-Myc were synthesized by GenePharma (China) and all the plasmids were synthesized by GeneChem (China). siRNA or plasmid transfection was performed with Lipofectamine 2000 (Invitrogen, USA) or NEOFECT DNA transfection reagent (NEOFECT, China), respectively, according to the manufacturers’ instructions. Cells were harvested 24–72 hours post-transfection for subsequent analysis. The individual siRNA sequences are listed in online supplemental table 3.
qRT-PCRQuantitative Real-time PCR (qRT-PCR) was performed using a SYBR Green PCR Kit (Promega, USA) according to the manufacturer’s instructions. Data was collected and analyzed with a Real-Time PCR System (ABI 7500, USA). The primer sequences used for qPCR are listed in online supplemental table 3.
ELISASupernatants were harvested 48 hours after cytokine treatments or transfection and used for subsequent IL-12, TNF-α, IL-10 and TGF-β ELISA (Enzyme linked immunosorbent) assays (all the ELISA kits purchased from eBioscience, USA). All experiments were performed according to the manufacturer’s instructions.
Cell proliferation assayThe MTS assay was performed according to the manufacturer’s instructions to examine the proliferation of tumor cells. Tumor cells (5×10³) were plated in 96-well plates with 6 replicates/group and cocultured with medium containing 30% supernatant of macrophages in different groups. The cells were incubated for 0, 24, and 48 hours. At each of the desired time points, MTS solution (Promega, USA) was added to each well and incubated for 2 hours in the dark at 37°C, followed by measurement of the absorbance at 492 nm with a microplate reader (Cytation5, BioTek).
EdU incorporation assayA Cell-Light EdU Apollo488 in Vitro Kit (C10310-3, Ribobio) was used to apply the EdU incorporation assay. 1.5×10⁴ tumor cells / well were seeded into 96-well plates and treated with 30% supernatant of M2-like macrophages with different NR_109-expressed for 48 hours. Then, the cells were cultured with EdU reagent (1:1000 dilution) for 2 hrs. Four percent paraformaldehyde was used to fix the cells, and fluorescent dye and Hoechst were used to stain cells. The EdU-positive cells was photographed by the confocal microscope (Nikon, Japan) and counted by the Photoshop software.
Transwell assayFor the transwell assays, tumor cells (1×10⁵) were seeded in the upper chamber (24-well insert; 8 µm pore size; Corning Costar, Cambridge, Massachusetts, USA) using 0.2 mL of medium without serum, and macrophages (2×10⁵) in different groups was added to the lower chamber as a chemoattractant. After a 15–20 hours incubation, non-migrating cells in the upper surface of the membrane were removed with a cotton swab, and the cells that penetrated the lower surface of the membrane were stained with crystal violet. The number of cells invading the membrane was counted with a microscope in five randomly selected fields. Data were obtained from three independent experiments.
Flow cytometryFor cell-surface molecular analysis, cells were suspended in PBS containing 1% FBS, and then stained with PE-conjugated anti-CD86 (12-0869-42), FITC-conjugated anti-CD206 (MA5-16870), PE-conjugated anti-CD163 (12-1639-42), Mouse IgG2b κ Isotype Control PE (12-4732-81), Mouse IgG1, κ Isotype Control Alexa Fluor 488 (53–4714) (all the antibodies purchased from eBioscience, USA), PE/cyanine 5-conjugated anti-CD11b (E-AB-F1081G, Elabscience, China), PE/cyanine 5 Rat IgG2b, κ Isotype Control (E-AB-F09842G, Elabscience, China), CD4-FITC/CD8-PE/CD3-PerCP (340298), CD3-FITC/CD16+56 PE (340042), Mouse IgG1 PE (349043), Mouse IgG1 FITC (349041), Mouse IgG2a PerCP (349054) (all the antibodies purchased from BD, USA) for 30 min at 4°C. For flow cytometry (FCM) gating, cells were stained with isotype-matched control antibodies or unstained cells and other cells were analyzed according to that fating strategy. Specimens were subsequently analyzed by FCM (Navios, Beckman).
Western blotting assayProteins were extracted from the cells with RIPA buffer (Solarbio, China), resolved by SDS-polyacrylamide gels, and then transferred to PVDF membranes (Millipore, USA). The following antibodies were used: anti-c-Myc (Abcam, ab39688, USA), anti-FUBP1 (Proteintech, 24 864–1-AP, China), anti-JTV-1 (Proteintech, 10 424-1-AP, China), anti-Ubiquitin (Abcam, ab134953, USA), anti-CD206 (Abcam, ab64693, USA) and anti-SCARB1 (Proteintech, 21 277–1-AP, China). Protein levels were normalized to the endogenous GAPDH control (Proteintech, 10 494–1-AP, China) and all the antibodies were diluted in Antibody Diluent (Absin, abs954). IRDye 800CW Goat anti-Rabbit IgG Secondary Antibody (926-32211, LI-COR, USA) and IRDye 680RD Goat anti-Mouse IgG Secondary Antibody (926-68070, LI-COR, USA) were used as the secondary antibody and the antigen-antibody reaction was visualized by detection with an Odyssey assay (Millipore, Billerica, Massachusetts, USA).
Xenograft tumor formation and metastasis assay in mice modelMale HSC-NPG mice (16 weeks old, hCD45+ ≥50%) were obtained from Vitalstar Biotechnology, Beijing. All of the experimental procedures were performed in accordance with the protocols and ethical regulations approved by the Institutional Animal Care and Use Committee of Hebei Medical University (approval number: 2018088). The mice were randomly divided into three groups (six mice per group). BGC-823 cells were mixed with M0, M2sh-NC and M2sh-NR_109 macrophages at a 3:1 ratio and injected into the right flanks of HSC-NPG mice in different groups. Tumor growth was observed daily and photographs were taken on the 21st day and 30th day by an in vivo imaging system (Berthold, NightOWL Ⅱ LB983, German). The tumor volumes were calculated (V=0.5×length×width2 in mice every 3 days. A month after injection, the tumor tissues, peripheral blood sample, spleen and peritoneum macrophages from different groups were collected, and the proportion of immune cells in mice was determined by FCM and immunohistochemical (IHC). To evaluate the role of M2-like macrophage with NR_109 knockdown on tumor lung metastasis, BGC-823 cells were mixed with M2sh-NC or M2sh-NR_109 macrophages at a 3:1 ratio and injected into the tail vein of nude mice in different groups (n=6). Tumor metastasis was monitored using an in vivo imaging system. The mice were sacrificed after 60days and the lungs were separated and stained with H&E. All animal experiments were performed at the Animal Laboratory Center of the Fourth Hospital of Hebei Medical University.
RNA Fluorescence in situ hybridizationRNA fluorescence in situ hybridization (FISH) assays were performed using a RiboTM Fluorescent in situ hybridization Kit (Ribobio, China) according to the manufacturer’s instructions. NR_109, 18S RNA and U6 probes were labeled with Cy3 fluorescent dye. Briefly, M2-like macrophages were seeded onto sterile slides, fixed with 4% paraformaldehyde and permeabilized with 0.5% Triton X-100 for 30 min. Then, cells were blocked with prehybridization buffer for 30 min at 37°C, followed by incubation in 0.5 µg/mL probe at 37°C for 18 hours. The next day, cells were washed with SSC buffer and stained with DAPI for 10 min. Fluorescence detection was performed with a confocal laser-scanning microscope (A1RHD25, Nikon).
In situ hybridizationThe expression of NR_109 in tumor tissues was detected using digoxin-labeled NR_109 in situ hybridization (ISH) probes (BOSTER, China) according to the protocol provided by the manufacturer. Briefly, the formalin fixed paraffin embedded tissue slides were deparaffinized and deproteinated. Slides were then prehybridized in prehybridization solution for 2hours at 42°C and incubated in DIG-labeled NR_109 probe solution (200 nM) over night at 42°C. The next day, the slides were incubated with anti-DIG reagent, and the probe signal was visualized with diaminobenzidine (DAB) solution followed by counterstaining with hematoxylin. The expression of NR_109 was assessed using the serial sections from the same blocks used for CD68/CD163 IHC staining. For measurement of NR_109 intensity, staining data were captured under a light microscope (magnification×400, Nikon) in five areas per slide and the score was in the range of 1–4 as follows: 1 (no staining), 2 (weak staining), 3 (medium staining), and 4 (strong staining). The scores of 1 and 2 were considered as low expression of NR_109, while the scores of 3 and 4 were considered as high expression of NR_109. Data were analyzed in a double-blinded miner by two pathologists.
Immunofluorescence and IHC stainingFirst, tissue sections were deparaffinized, rehydrated with graded ethanol, incubated with 0.3% hydrogen peroxide for 20 min, and blocked with goat serum. For immunofluorescence (IF) assay, the slides were incubated with CD206 antibody (Abcam, ab64693) overnight and fluorescent labeled secondary antibodies for 2hours, IF images were captured by laser confocal microscopy (Nikon, Japan). For IHC (Immunohistochemistry) staining, slides were first incubated overnight with antibodies against Ki67 (dilution 1:5000, Proteintech, 27 309-1-AP), E-cadherin (dilution 1:2000, Proteintech, 20 874-1-AP), Vimentin (dilution 1:2000, Proteintech, 10 366-1-AP), N-cadherin (dilution 1:1000, Proteintech, 22 018-1-AP), CD4 (MXB, RMA-0620), CD8 (MXB, RMA-0514), CD163 (dilution 1:200, Sigma-Aldrich, 163M-14-RUO), CD68 (dilution 1:100, DAKO, M0876), FUBP1 (dilution 1:100, ZENBIO, R24365) and c-Myc (dilution 1:200, Abcam, ab39688) at 4°C and then labeled with a rabbit HRP-conjugated secondary antibody at room temperature for 1 hour. Finally, positive staining was visualized using DAB substrate liquid (Agilent, USA), followed by counterstaining with hematoxylin. All sections were observed and photographed with a microscope (Nikon, Japan). Two pathologists evaluated the IHC scores in a double-blinded manner.
For measurement of the proliferative index, staining data were captured under a light microscope (magnification×400) randomly in five areas per slide. Ki67-positive cells and cancer cells were counted and the Ki67 index was calculated as Ki67-positive cells/cancer cells. For assessing CD4+ T, CD8+ T and CD163+ cells infiltration in tumor tissues of HSC-NPG mice, three areas with highest infiltration density were used and at least five fields per area were evaluated for markers. The number of stained cells per 20×objective field was counted and converted to cell density (cell number/mm2). The expression of CD68 or CD163 in human cancer tissues was scored as the percentage of positively stained cells as follows: score 0 (≤10 cells/HP); score 1 (11–29 cells/HP); score 2 (30–49 cells/HP); and score 3 (>50 cells/HP). HP: high-power field, 400×. The expression of FUBP1 and c-Myc in CD68+ cells was scored in a manner consistent with NR_109.
Biotin-RNA pulldown assayThe pGEM-3zf (+)-NR_109 plasmids were linearized by restriction enzyme (Takara, Japan) digestion for use as templates for the transcription of NR_109 sense, antisense and cold probes. Biotin-labeled RNAs were in vitro transcribed using Biotin-RNA Labeling Mix (Roche, Indianapolis, Indiana, USA), treated with RNase-free DNase I (Takara, Kyoto, Japan) and purified with LiCl (Invitrogen, USA). Total protein lysates of M2-like macrophages were mixed with biotinylated RNA and incubated at 30°C. Streptavidin agarose beads (GE Healthcare, Little Chalfont, UK) were added to each binding reaction and further incubated at room temperature with rotation. Complexes of RNA-protein beads were washed with washing buffer and then boiled in 1×loading buffer for 5 min. RNA affinity captures were subjected to 12% SDS-PAGE and visualized by silver staining. Protein bands were excised and identified by in-gel trypsin digestion, followed by mass spectrometry (LC-MS/MS, AB Sciex TripleTOF, ABsciex, Concord, ON, USA).
RNA-immunoprecipitation assayRNA-immunoprecipitation (RIP) assays were performed using the Magna RIP RNA-Binding Protein Immunoprecipitation kit (Millipore, USA) according to the manufacturer’s instructions. Briefly, an antibody directed against FUBP1 was used. The coprecipitated RNAs were adsorbed with magnetic beads (Invitrogen, USA) and detected by RT-PCR. Total RNA (input) and the antibody isotype control rabbit IgG were used simultaneously to demonstrate that the detected signals were from RNAs specifically binding to proteins FUBP1 or others (n=3 for each experiment).
Chromatin immunoprecipitation assayChromatin immunoprecipitation (ChIP) was performed using the Magana ChIP A/G Kit (17-10086, Merck, Germany). First, cells were harvested with protein cross-linked to DNA using 1% formaldehyde. Then, chromatin was sheared to lengths of 100–1000 bp using sonication. Next, the sheared and cross-linked chromatin combined with 1–2 µg antibody were used in the immunoprecipitation. c-Myc was employed in the ChIP assay, with goat anti-rabbit IgG used as a negative control. The retrieved DNA was analyzed by agarose gel electrophoresis after PCR. The binding region (BR) primer, forward: GGAAGAATTACAACACTCTTTAGCA, reverse: CAAAAGTCCCAAAGGCATCTAC, the NBR primer, forward: CATCTTGTGCTACCCATTCTATCTT, reverse: GACTAATGGGAGACCTAAAAATACA.
Luciferase reporter assayLuciferase reporter assays were performed using the Dual-Luciferase Reporter Assay System (Promega, USA). Cells were seeded in 24-well plates (1×10⁵ cells/well) and transfected with NR_109 plasmids with or without c-Myc BR and Renilla plasmids. After 48hours of transfection, the cells were harvested and analyzed according to the manufacturer’s instructions. The luciferase activities were normalized to the Renilla luciferase activity of the internal control.
Statistical analysisStatistical analyses were performed using SPSS V.21.0 software. Data were reported as the mean±SD, unless otherwise noted. Statistical tests for data analysis included Student’s t-test, one-way analysis of variance, χ2-tests, Mann-Whitney U test, Spearman correlation analysis, and Fisher’s exact test. All in vitro experiments were repeated with at least three replicates. A p<0.05 was considered statistically significant, and all statistical tests were two sided.
ResultsNR_109 was associated with protumor macrophages polarizationTo identify the differentially expressed lncRNAs in protumor macrophages, we first set up THP-1-derived models of M0, M1-like and M2-like macrophages according to previous studies.22 25 As shown in online supplemental figure S1A and B, PMA, LPS/IFN-γ and IL-4 were used to induce macrophages into different phenotypes. Compared with M0 macrophages, the expression of CD86, IL-12, TNF-α, iNOS and HLA-DRα were significantly increased in LPS- and IFN-γ-induced M1-like macrophages, while the expression of CD206, IL-10, TGF-β, Arg-1 and VEGF were elevated in IL-4-treated M2-like macrophages (online supplemental figure S1C–F). All these data confirmed that M1-like and M2-like macrophages derived from THP-1 cells were successfully established.
 Figure 1
 NR_109 was associated with M2-like macrophage polarization. (A) PCA plot from gene expression profiles in M0, M1-like and M2-like macrophages. (B–C). Heatmap of lncRNAs and mRNAs profile in M0, M1-like and M2-like macrophage. (D) Six differentially expressed and immune-related lncRNAs selected from lncRNA microarray data were validated by qPCR. (E) Expression of NR_109 in M0, M1-like and M2-like macrophages was detected by qPCR assays. (F) NR_109 was examined in M0 cells treated with IL-4 for 0, 12, 24 and 48 hours. (G) Expression of NR_109 was analyzed in M2-like macrophages derived from PBMC. (H) Expression of NR_109 in M2-like macrophages derived from primary GC tissues (pri-GC) and the matched adjacent non neoplastic tissues (non-GC) was measured by qPCR. (I) M2-like macrophages with NR_109 knockdown or overexpression were constructed by transfecting with NR_109 siRNA or NR_109 plasmid. (J) Expression of M2-like macrophage markers in IL-4 induced M2-NR_109low cells and M2-NR_109high cells was detected using qPCR. (K) Expression of CD206 was decreased in M2-NR_109low cells derived from PBMC. (L) The level of IL-12, TNF-α, IL-10 and TGF-β in the supernatant of M2-NR_109low cells was analyzed by ELISA. (M) Knockdown NR_109 in M0 cells hindered IL-4 induced M2-like macrophage polarization and the expression of M2-related markers. (N) Expression of M2-related markers in M0 and M1-like macrophages with forced expression of NR_109 were tested by qPCR. (O) RACE assay showed the whole-length of NR_109. The statistical data are from three independent experiments and the bar indicates the SD values (*p < 0.05, **p < 0.01).GC, gastric cancer.
Subsequently, the SBC Human LncRNA Microarray V.6.0 (4×180 k) (Shanghai Biotechnology, Agilent Microarray Platform) was employed to identify the unique lncRNA and mRNA profiles in M0, M1-like and M2-like macrophages. According to principal component analysis, the M0, M1-like and M2-like macrophages could be distinguished by lncRNAs profiles (figure 1A), highlighting the plausibility and importance of lncRNA-profiles characteristic of polarized macrophages. Here, 933 differentially expressed lncRNAs (709 upregulated and 224 downregulated genes, figure 1B) and 819 differentially expressed mRNAs (457 upregulated and 362 downregulated genes, figure 1C) between M0 and M2-like macrophages were identified (fold change≥2 or ≤0.5, p<0.05). To validate the microarray data, six differentially expressed and immune-related lncRNAs were selected for qPCR analysis and the data confirmed their change in expression as revealed by the microarray (figure 1D). Of those, the lncRNA NR_109861 (abbreviated as NR_109) was significantly increased in M2-like macrophages compared with both M0 and M1-like macrophages (figure 1E), especially in a time-dependent manner after IL-4 treatment for 12 hours, 24 hours and 48 hours by 5.16±0.25 fold (mean±SD), 6.12±0.30 fold and 8.04±0.58 fold, respectively (figure 1F). Moreover, the expression of NR_109 was also confirmed to be elevated in M2-like macrophages derived from PBMCs with low TNF-α expression and high CD206 and Arg-1 expression (online supplemental figure S1G and H and figure 1G). Then, we observed that NR_109 was expressed in CD206+ TAMs of GC tissues (online supplemental figure S1I). Compared with the macrophages derived from the matched adjacent non-neoplastic tissues (non-GC), the expression of NR_109 was increased in macrophages isolated from primary GC tissues (pri-GC) with high expression of CD163 and CD206 (figure 1H and online supplemental figure S1J), suggesting that NR_109 might be an M2-like macrophage associated lncRNA.
To identify the role of NR_109 in macrophage polarization, we knocked down or overexpressed NR_109 in M2-like macrophages to obtain M2-NR_109low or M2-NR_109high macrophages, respectively (figure 1I). As shown in figure 1J and online supplemental figure S1K and L, the expression of M2-associated molecules including CD206, Arg-1, TGF-β and IL-10 was reduced in M2-NR_109low cells, but enhanced in M2-NR_109high macrophages, while the expression of M1-associated markers including HLA-DRα, CD206, TNF-α and IL-12 was increased in M2-NR_109low cells, but decreased in M2-NR_109high macrophages. Moreover, in macrophages induced from PBMC, the expression of CD206 was also downregulated in M2-NR_109low cells (figure 1K). In addition, compared with the control group, the level of IL-12 and TNF-α was elevated, while the level of IL-10 and TGF-β was attenuated in the supernatant of M2-NR_109low macrophages (figure 1L). Interestingly, the expression of M2 markers was reduced when knocking down NR_109 in M0 cells, suggesting that NR_109 knockdown hindered IL-4 induced M2-like macrophage polarization (figure 1M). On the other hand, compared with M0 and M1-like macrophages, the expression of M2-associated markers was elevated when forced expression of NR_109 in those cells (figure 1N). Collectively, our results demonstrated for the first time that NR_109 facilitated the generation of pro-tumor phonotype of macrophages.
Then, we performed 5′-RACE and 3′-RACE to further characterize the features of NR_109. The results determined that the full-length NR_109 is 1036 nucleotides long, which was identical to ENST00000449270 in the Ensembl database (figure 1O and online supplemental figure S1M and N) and longer than the sequence in the NCBI database (808 nt, gene ID: 101929371, results not shown). Moreover, searching the CPAT (Coding Potential Assessment Tool, https://wlcb.oit.uci.edu/cpat) and CPC 2 (Coding Potential Calculator 2, http://cpc2.gao-lab.org) databases, NR_109 barely had any coding probability, suggesting that NR_109 was indeed a non-coding RNA (online supplemental figure S1O). According to NONCODE database, NR_109 expression was preferentially distributed in lymphoid organs, including the thymus and lymph nodes, as well as macrophage-enriched tissues, such as the lung and brain, suggesting a potential role for NR_109 in immune cells (online supplemental figure S1P).
Knockdown of NR_109 reduced the activity of M2-like macrophages to promote the proliferation and metastasis of cancer cellsIt has been reported that M2-like macrophages promote the proliferation and metastasis of many cancer cells by providing cytokines and enzymes, such as TGF-β, IL-10, Arg-1 and IDO.9 26–28 Our data also confirmed that the cells or the supernatant of M2-like macrophages could promote the growth and migration of cancer cells (online supplemental figure S2A–C). Then, we examined the effect of NR_109 on the function of M2-like macrophages. First, the tumor cells AGS, MDA-MB-231, BGC-823, A549 and Eca109 were cocultured with the medium containing 30% supernatant from M2-NR_109low macrophages and the results showed that compared with the control group, the proliferation of tumor cells was significantly decreased after treatment with the M2-NR_109low medium (figure 2A and online supplemental figure S2D). Consistently, the percentage of EdU+ AGS and EdU+ MBA-MD-231 cells was also reduced when cocultured with 30% supernatant of M2-NR_109low (figure 2 and online supplemental figure S2E). Subsequently, a coculture model using tumor cells and M2-NR_109low or M2si-NC cells were established to explore the role of macrophages on migration of tumor cells (online supplemental figure S2F). As shown in figure 2C and online supplemental figure S2G, the migration of tumor cells cocultured with M2-NR_109low cells was significantly decreased compared with that of the control group. All these data indicated that M2-NR_109low reduced the activity of M2-like macrophage to mediate the growth and migration of various tumor cells in vitro.
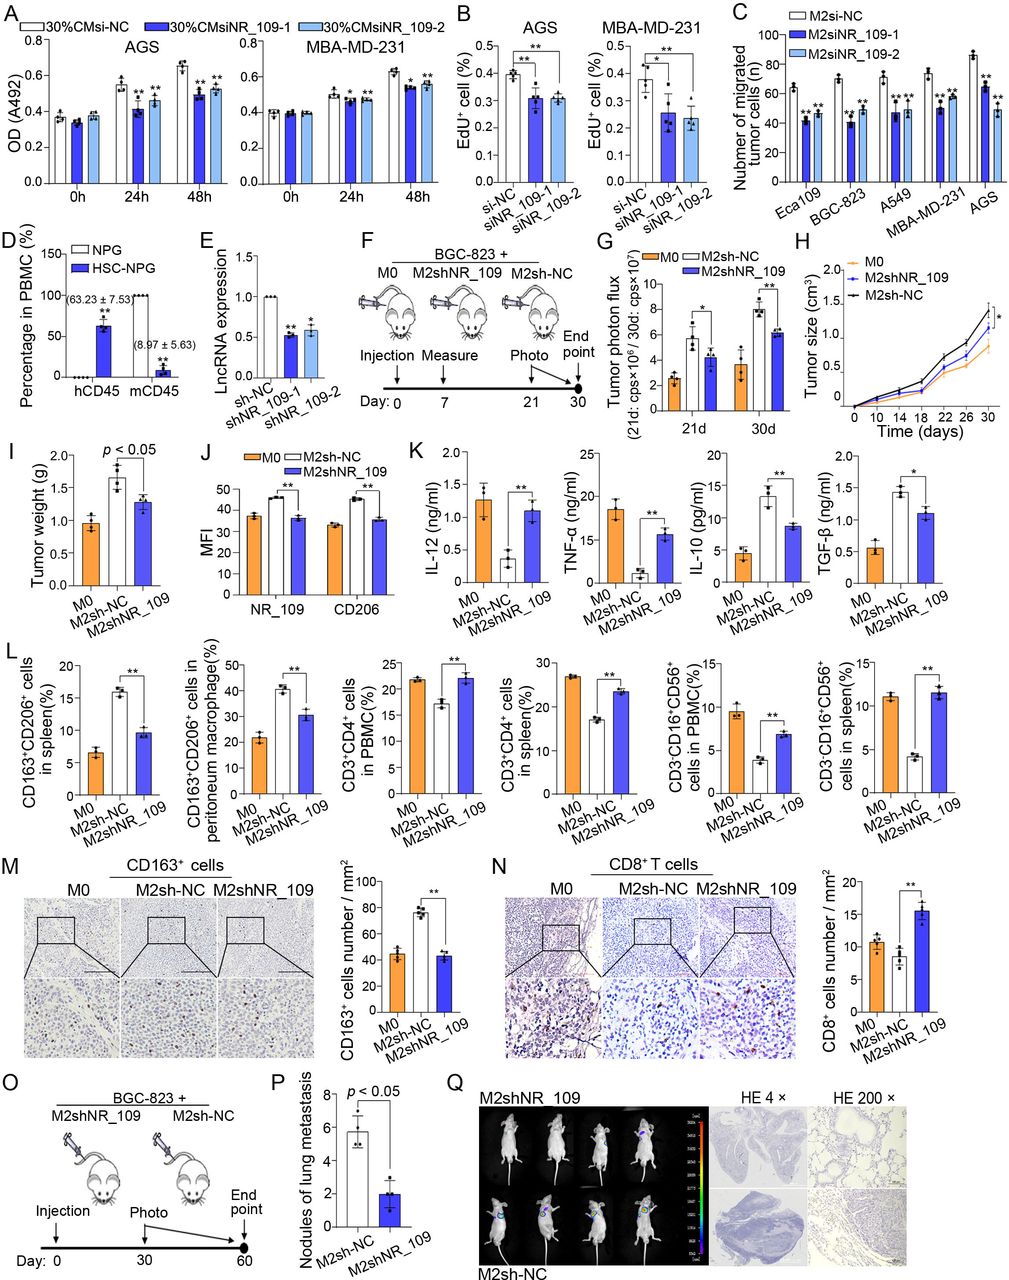 Figure 2
 Knockdown of NR_109 reduced the activity of M2-like macrophages to promote growth and metastasis of cancer cells. (A) The MTS and (B) EdU incorporation assays showed the proliferation of tumor cells in the coculture system with 30% culture medium (CM) of M2-NR_109low. (C) The migration of tumor cells when cocultured with M2-NR_109low cells. (D) The proportion of hCD45+ cells in the PBMC of NPG mice and HSC-NPG mice (8.97% ± 5.63% vs. 63.23% ± 7.53%). (E) Expression of NR_109 in M2-like macrophages after NR_109 lentiviral transduction was measured by qPCR. (F) The sketch of subcutaneous xenograft model in HSC-NPG mice. (G) The tumor growth (shown as photon flux) was examined by in vivo imaging. (H) The tumor size, (I) tumor weight and (J). MFI of NR_109 and CD206 in tumor tissues of different groups were analyzed. (K) The level of IL-12, TNF-α, IL-10 and TGF-β in the serum of HSC-NPG mice from distinct groups was tested by ELISA. (L) The percentage of M2-like macrophages (CD163+CD206+) in spleen and peritoneum macrophages, and the percentage of CD4+ T cells and NK cells (CD3-CD16+CD56+) in the PBMC and spleen were measured by FCM. (M) The infiltration of CD163+ cells and N. the number of CD8+ T cells in tumor tissues of different groups was detected by using IHC assays.(O) The sketch of metastatic tumor model in nude BALB/c mice. (P) The number of lung metastasis nodules was examined. (Q) In vivo imaging and HE staining showed the lung metastasis nodules and the representative regions of the lung in HSC-NPG mice of the two groups. The statistical data are from three independent experiments and the bar indicates the SD values (*p < 0.05, **p < 0.01). MFI, mean fluorescence intensity.
To further evaluate the function of M2-NR_109low on tumor cells in vivo, NPG mice, in which T/B lymphocytes and NK cells were depleted, were transplanted with enriched CD34+ HSCs isolated from fresh human umbilical cord blood to reconstitute the human immune system29 30 (online supplemental figure S2H). By analysis, the proportion of human CD45+ leucocytes reached 63.23%±7.53% in total circulating CD45+ cells after reconstitution (figure 2D and online supplemental figure S2I). Moreover, CD3+ T cells, CD14+ cells, CD19+ B cells and CD56+ NK cells derived from human were also detected in the peripheral blood of HSC-NPG mice (online supplemental figure S2J), confirming the successful establishment of a humanized immune system in these HSC-NPG mice.
Subsequently, M2shNR_109 cells were established to have NR_109 stably knocked down in M2-like macrophages (figure 2E and S2K). Then, luciferase-expressing BGC-823 cells mixed with M2shNR_109 cells, M2sh-NC cells or M0 cells at a ratio of 3:1 were injected into the right flank of HSC-NPG mice (figure 2F). On 21 d and 30 d after inoculation, the tumor size was measured by in vivo imaging (online supplemental figure S2L). Compared with the M0 group, M2sh-NC cells facilitated the growth of tumors, while compared with M2sh-NC cells, M2shNR_109 cells partially impaired activity on tumor growth (figure 2G). Moreover, the tumor size, tumor weight and the mean fluorescence intensity of NR_109 and CD206 in tumor tissues of the M2shNR_109 group were significantly reduced compared with that of the M2sh-NC group (figure 2H–2J and S2M). Furthermore, compared with the M2sh-NC group, the level of IL-12 and TNF-α in serum was increased, while the level of IL-10 and TGF-β was significantly decreased in the serum of the M2shNR_109 group (figure 2K). In addition, the percentage of M2-like macrophages (CD163+/CD206+) in the spleen and peritoneum was downregulated, while the percentage of CD4+ T cells and NK cells (CD3-CD16+CD56+) in the PBMC and spleen was significantly upregulated in the M2shNR_109 group compared with that of the M2sh-NC group (figure 2L and online supplemental figure S2N and P). In parallel, IHC staining assays showed that compared with the M2sh-NC group, the infiltration of CD163+ macrophages was reduced and the number of CD8+ T and CD4+ T cells was enhanced in the tumor tissues of the M2shNR_109 group (figure 2M,N and and online supplemental figure S3A). Since the polarization states of macrophages could affect the malignant properties of tumor cells, Ki67 and epithelia-mesenchymal-transition (EMT)-related markers were measured in tumor tissues by IHC assays.31 32 Accordingly, compared with that of the M2sh-NC group, the Ki-67 index and the expression of N-cadherin and Vimentin was significantly decreased, whereas the expression of E-cadherin was elevated in the M2shNR_109 group (online supplemental figure S3B–D). To further elucidate the effect of NR_109 in M2-like macrophages on tumor metastasis in vivo, a mixture of luciferase-expressing BGC-823 cells and M2shNR_109 or M2sh-NC (at a ratio of 3:1) was injected into the tail veil of BALB/c nude mice (figure 2O). As shown in figure 2P,Q and online supplemental figure S3E and F, compared with the M2sh-NC group, the number of lung metastasis nodules and the tumor size (show as photon flux) in mice of the M2shNR_109 group had significantly reduced on day 60. Collectively, these data suggested that knockdown of NR_109 in M2-like macrophages partially restored the proportion of antitumor immune cells and cytokines, and altered the tumor growth and metastasis in vivo.
 Figure 3
 NR_109 interacted with FUBP1 protein. (A) FISH and (B) nuclear and cytosolic RNA analyses revealed that NR_109 was mainly located in the nucleus of M2-like macrophages. (C) The interacted proteins of NR_109 were resolved through NR_109 pulldown assay, SDS-PAGE electrophoresis and visualized by silver staining. (D) The top 10 proteins analyzed by MS were shown. (E) Only biotinylated sense probe pulled down FUBP1 in M2-like macrophages. (F) The interaction of NR_109 and FUBP1 was confirmed by RIP assays. (G) A series of truncated probes of NR_109 was designed according to the secondary structure of NR_109.(H) The FUBP1 protein was pulled down by the P3 probe (476-640nt) of NR_109. (I-J) M2-FUBP1low and M2-FUBP1high macrophages were constructed by transfecting FUBP1 siRNA or FUBP1 plasmid, respectively. (K) Expression of M2 markers and (L) the migration of tumor cells were measured by qPCR and transwell assays. (M-N) NR_109 affected FUBP1 at the protein level, but not the mRNA level. The statistical data are from three independent experiments and the bar indicates the SD values (*p < 0.05, **p < 0.01). FUBP1, far upstream element-binding protein 1.
NR_109 interacted with FUBP1 proteinTo explore the underlying mechanism of NR_109 in M2-like macrophage polarization, we first used FISH and subcellular fractionation assays to probe the location of NR_109. The results showed that NR_109 was predominantly localized in the nucleus (figure 3AB). Previous studies have demonstrated that nucleus-located lncRNAs exerted their biological function mainly by forming complexes with proteins.15 Therefore, we performed an RNA pull-down assay using in vitro transcribed biotinylated NR_109 to identify NR_109-interacting proteins in M2-like macrophages. As shown in figure 3C, an obvious band with a size between 55 kDa and 72 kDa was specifically enriched in the NR_109 pull-down. The specific band was analyzed by mass spectrometry and some of the potential NR_109-interacting proteins were listed in figure 3D. Then, pull down products were subjected to western blot assays and indicated that the FUBP1, which was a transcription regulator and primarily located in the nucleus, was identified as a candidate NR_109-interacting protein (figure 3E). Consistently, RIP assays further confirmed the interaction of NR_109 with FUBP1 (figure 3F). Moreover, to elucidate the binding site between NR_109 and FUBP1, a series of truncated probes were designed according to the secondary structure of NR_109 as predicted by the RNAfold WebServe database (http://rna.tbi.univie.ac.at/cgibin/RNAWebSuite/-RNAfold.cgi) (figure 3G). As shown in figure 3H, the 476–640 nt region of NR_109 (P3) was identified as the sequence required for direct interaction.
Subsequently, to better understand the association between the expression of FUBP1 and the infiltration of M2-like macrophages in the tumor tissues, we searched the TIMER2.0 database (http://timer.comp-genomics.org/) and revealed a significant positive correlation between the expression of FUBP1 and the infiltration of M2-like macrophages in many cancer types (online supplemental figure S3G). Then, we generated M2-FUBP1low and M2-FUBP1high cells with FUBP1-siRNA and FUBP1-plasmid, respectively, to investigate the function of FUBP1 in M2-like macrophage polarization (figure 3I,J). As shown in figure 3K, the expression of M2 markers, including Arg-1, CD206, IL-10, TGF-β and VEGF was markedly decreased in M2-FUBP1low cells but increased in M2-FUBP1high cells. To further confirm the results, M2-like macrophages were treated with the FUBP1 inhibitor, FUBP1-IN-1 for 24 hours and the expression of FUBP1 was suppressed in those cells (online supplemental figure S3H and I). Moreover, the level of M2 markers, including CD163, CD206, Arg-1, VEGF and IL-10 were also significantly decreased (24 µM, 24 hours) (online supplemental figure S3J). In addition, the migration of tumor cells was reduced when cocultured with M2-FUBP1low cells but was enhanced when cocultured with M2-FUBP1high cells (figure 3L and online supplemental figure S3K). Overall, these findings suggested that FUBP1, a NR_109-interacting protein, was an essential factor during M2-like macrophage polarization.
NR_109 blocked the ubiquitin-mediated degradation of FUBP1 by competing with JTV-1To explore the effect of NR_109 on FUBP1 expression, both the mRNA and protein levels of FUBP1 were measured in M2-NR_109low and M2-NR_109high cells. As shown in figure 3M,N, the level of FUBP1 protein, but not mRNA was significantly changed. Therefore, we expected that NR_109 might interact with FUBP1 and enhance its stability. Then, to understand the mechanism by which NR_109 promoted FUBP1 protein expression, a series of flag-tagged FUBP1 deletion mutants was designed to investigate which domain of FUBP1 was responsible for binding to NR_109 (figure 4A,B). As shown in figure 4C, we found that the C-terminus (447-644) of FUBP1 was essential for the binding of FUBP1 to NR_109 using RIP assays.
留言 (0)