
記住我
Due to its high tumor mutational burden, likely driven by ultraviolet radiation, melanoma possesses a high number of neoantigens, making it one of the most immunogenic tumor types.1 2 Melanoma treatment has been revolutionized by immune checkpoint blockade (ICB), reactivating T cells or preventing T cell dysfunction.3 Despite these successes, many patients still either do not respond or relapse after an initial response.4 For patients not carrying targetable mutations such as BRAFV600E or having already exhausted targeted treatments, limited options remain, resulting in an urgent need for innovative effective treatments.
While ICB-mediated prevention of T cell dysfunction has entered clinical practice in a wide array of indications beyond melanoma, the direct therapeutic use of T cells in non-hematological cancer entities has been largely ineffective.5 Melanoma, however, has been an exception in this regard. Tumor infiltrating lymphocytes (TIL) are a prognostic factor in melanoma and correlate with response to ICB.6 In fact, investigation using isolated, non-modified, and ex vivo expanded TIL as a treatment modality for patients with melanoma has already been explored in the pre-ICB era.7 There, about 50% of treated patients were sensitive to TIL therapy, a fraction of which exhibiting complete and durable responses.8 9 The success of ICB therapy then suspended further development of TIL-based therapies for some time. Recently, clinical studies have explored the potential of TIL therapy after ICB failure in patients with melanoma. Consistent with pre-ICB reports, TIL therapy yielded substantial response rates of up to 32%, indicating that even in such clinically challenging situations, TIL therapy might still be of benefit to patients (NCT00937625, NCT02379195 and NCT02354690).10 Along these lines, ICB and TIL therapy impressively demonstrate the utility of T cells in melanoma treatment regardless of treatment line. TIL therapy, however, comes with significant challenges which limit its application: (1) requirement for accessible target lesions for resection and TIL selection and expansion, (2) failure to select and expand TIL, (3) heterogeneity of TIL products with often undefined specificities and consequently and (4) heterogeneous response patterns both in extent and in duration.11
T cells can be rendered tumor-specific through genetic engineering of a synthetic receptor, so called chimeric antigen receptor (CAR), that can recognize antigens on the cell surface independent of major histocompatibility complex molecules. Anti-CD19 CAR T cells have entered clinical routine after transformative results in the treatment of hematological malignancies.12 13 CD19 as a target antigen allows for targeting of lymphoma and leukemic cells along with healthy B cells. The deleterious effects of depleting the entire B-cell compartment are clinically manageable.14 In contrast to CD19+ hematological malignancies, dispensable lineage-specific tumor-associated antigens are rarely found in solid cancer types.5 Additionally, an immunosuppressive milieu and target antigen heterogeneity, among other factors, have resulted in melanoma CAR T cell therapy trials faring poorly thus far.15 Detailed analysis of TIL therapy failure highlights that loss of dominant antigens under therapeutic pressure happens quite frequently, suggesting that a successful T cell product will need to target more than one antigen.16 These results support the need for advances in melanoma cell therapy considering such a limitation.
As most of the targetable antigens are not entirely specific to melanoma but shared with other cells as well, we reasoned that any T cell therapeutic strategy would need to be controllable to allow application with a safety net. We have previously described a synthetic agonistic receptor (SAR) platform composed of the extracellular domain of epidermal growth factor receptor variant III (EGFRvIII), fused to intracellular T cell-activating domains (later referred to as E3 construct). The construct can be specifically activated by bispecific antibodies (BiAb) simultaneously targeting the SAR and the tumor antigen. The major advantages of modular adoptive cell therapy (ACT) platforms are the possibility to stop administration of the adaptor molecule in case of undesired therapy-associated toxicities and the ability to target multiple antigens by administering different T cell adaptor molecules.17 18 In particular, we previously demonstrated that SAR-transduced T cell activity is conditional to the presence and binding of the BiAb, enabling a tunable activity that is advantageous in case of toxicities.19 20 We hypothesized that this SAR platform could serve as a safe and effective way of targeting melanoma-associated antigens for melanoma treatment.20
For the present study, using the CrossMab technology,21 22 we developed trivalent BiAb binding melanoma antigen and the E3 SAR. We demonstrate that SAR-transduced T cells were selectively and reversibly activated through the BiAb, solely in the presence of antigen-positive melanoma cells. We showcase substantial activity of the platform in primary melanoma cultures and in several xenograft and syngeneic mouse models, supporting further clinical development.
Material and methodsPatient and healthy donor materialFrozen, primary and metastatic tumor samples from 13 patients with a histologically confirmed diagnosis of melanoma were used for this study. The samples were cultured in MCDB 153 medium (Merck) complemented with 20% Leibovitz’s L-15 medium (Thermo Fisher), 2% fetal calf serum (Gibco), 10 µg/mL human insulin (Merck) and 2 M CaCl2 solution and expanded until further use. Biological and clinical information were obtained from electronic medical records. Patient characteristics are summarized in online supplemental table 1. Human peripheral blood mononuclear cells (PBMCs) for the generation of human CAR and SAR T cells were isolated from healthy donors by Ficoll density gradient separation.
MiceFemale C57BL/6N and NSG (NOD.Cg-Prkdcscid Il2rgtm1WjI/SzJ) mice were purchased from Charles River or Janvier Labs. Animals were housed in specific pathogen-free facilities in groups of 2–5 animals per cage. All experimental studies were approved and performed with mice aged 2–4 months and in accordance with guidelines and regulations implemented by the Regierung von Oberbayern (ROB-55.2–2532.Vet_02-20-208 and ROB-55.2–2532.Vet_02-17-135). In accordance with the animal experiment application, tumor size, behavior, breathing, body weight and posture of mice were monitored three times per week. For survival analyses, the above-described criteria (in particular: curved back, apathy, weight loss >20%, piloerection, pronounced abdominal breathing and cyanosis, spasms, paralysis, tumor size >225 mm2 or one of the two measure dimensions >15 mm or open wound in the tumor area) were taken as humane surrogates for survival and recorded in Kaplan-Meier plots.
Animal experimentsMV3, A375 and patient-derived (patient sample 2) xenograft models were established in NSG mice (in total n=96) following the subcutaneous (s.c.) injection of 0.2, 1 or 0.4×10⁶ tumor cells, respectively, in 100 µL phosphate buffered saline (PBS) into the right flank of NSG mice. Syngeneic tumor model was established in C57BL/6 mice (in total n=84) by intravenous injection of YUMM1.1 overexpressing luciferase (and tyrosinase-related protein 1 (TYRP1) where mentioned) (2×10⁶) into the tail vein following a partial lymphodepletion of the B-cell compartment, using 250 µg murine IgG2a anti-CD20 monoclonal antibody (18B12, Roche). Animals were randomized into treatment groups according to tumor burden. Experiments were performed by a scientist blinded to treatment allocation and with adequate controls. No time points or mice were excluded from the experiments presented in the study. For s.c. models, tumor burden was measured three times per week and calculated as mm3 given by volume=(length×width2)/2. Tumor burden of intravenous models were measured using a luciferase-based IVIS Lumina X5 imaging system. For ACT studies, 107 T cells with transduction efficiencies of 50–90% were injected intravenously in 100 µL PBS.
Cell line generation, culture and validationA375, MV3, PANC-1 and B16 tumor cell lines were purchased from American Type Culture Collection. The ovalbumin overexpressing murine pancreatic cancer cell line Panc02-OVA has been previously described.20 The murine YUMM1.1 cell line was kindly provided by Dr Bosenberg (Yale University, USA). YUMM1.1 tumor cells were stably transduced using retroviral pMP71 vector expressing TYRP1 protein (UNIPROT entry P17643) to generate YUMM1.1 TYRP1 tumor cells. Luciferase-eGFP (LUC-GFP) overexpressing cell line YUMM1.1 TYRP1-LUC-GFP and YUMM1.1 LUC-GFP were generated according to a previously described protocol.20 All tumor lines were grown as previously described,20 and used for experiments when in the exponential growth phase.
Virus production293Vec-Galv, 293Vec-Eco and 293Vec-RD114 were a kind gift of Manuel Caruso, Québec, Canada, and have been previously described.23 For virus production, retroviral pMP71 (kindly provided by C. Baum, Hannover) vectors carrying the sequence of the relevant receptor were stably introduced in packaging cell lines. Single cell clones were generated and indirectly screened for virus production by determining transduction efficiency of primary T cells. This method was used to generate the producer cell lines 293Vec-RD114 for EGFRvIII-CD28−CD3ζ (E3), EGFRvIII with CD28 transmembrane domain lacking intracellular signaling domains (E3del) and anti-HER2–CD28–CD3ζ (HER2 CAR). 293Vec-Galv, 293Vec-Eco and 293Vec-RD114 were grown as previously described.24 All cell lines used in experiments were regularly checked for mycoplasma species with the commercial testing kit MycoAlert (Lonza). Authentication of human cell lines by STR DNA profiling analysis was conducted in house.
T cell generation, retroviral transduction and cultureHuman and murine SAR construct generation was previously described.20 SAR-transduced T cells will be referred to as SAR T cells. The HER2 CAR was generated with a humanized single-chain variable fragment against HER2 (4D5).25 Murine T cells were differentiated from splenocytes from donor mice. T cell isolation and transduction protocols have been previously described.26 T cells were expanded or directly expanded with T cell medium supplemented with human interleukin (IL)-15 (PeproTech) every second day. Human T cells have been differentiated and transduced using previously described protocols27 or directly taken into culture with human T cell medium in concentrations of 106 T cells per mL medium.
Cytotoxicity assaysFor impedance-based real-time killing assays using a xCELLigence system (ACEA Bioscience), previously described,20 104 tumor cells were seeded per well in a 96-well plate. Cell number was monitored over the time frame of 10 hours for every 20 min. 105 T cells transduced with the indicated receptors were added to the tumor cells. For lactate dehydrogenase (LDH)-based killing assays, T cells were incubated with tumor cells and BiAb at indicated effector to target ratios and concentrations. Transduced T cells were added to the adherent tumor cells and co-cultured as indicated. LDH levels were measured according to the manufacturer’s protocol (Promega). Additionally, the killing of melanoma patient samples was assessed using a flow cytometry-based readout after 48 hours of co-culture with human SAR T cells in the presence of either the anti-TYRP1/anti-EGFRvIII (αTYRP1/αE3) which is cross-reactive to human and murine TYRP1 or the anti-human melanoma-associated chondroitin sulfate proteoglycan (MCSP, also known as CSPG4)/anti-EGFRvIII BiAb (αMCSP/αE3). Tumor cells were stained with the cell proliferation dye eFluor 450 according to the manufacturer’s protocol (eBioscience). Depending on the tumor cell size 2–4×10⁴ cells per well were co-cultured with SAR T cells in an effector to target cell ratio of 2:1 in a 96-well plate. Tumor cells were detached using trypsin. Dead cells were stained using the violet fixable viability dye (BioLegend) for 15 min at room temperature. Following this, cell surface proteins were stained for 20 min at 4°C. For the characterization and quantification of the SAR T cells antibodies against CD3 (OKT3), CD4 (OKT4), CD8a (RPA-T8), PD-1 (EH12.2H7), 4-1BB (4B4-1), CD69 (FN50) and EGFR (A-13) (all from BioLegend) were used. Tumor and T cell counts were normalized to counting beads (Invitrogen).
Proliferation assaysSAR T cell proliferation was measured using a flow cytometry-based assay that compared fold proliferation of CD3+ (17A2, BioLegend) T cells over a period of 48 hours normalized to the number of T cells per bead at indicated concentrations and effector to target ratio.
Biodistribution studyFor the biodistribution study of the anti-TYRP1/anti-E3 BiAb (αTYRP1/αE3 BiAb), 2×10⁶ YUMM1.1 TYRP1-LUC-GFP tumor cells were intravenously injected into C57Bl/6 mice. IVIS imaging was used to verify tumor engraftment and distribution after 13 and 20 days. αTYRP1/αE3 or αMesothelin/αE3 control BiAb (5 µg/mouse or 10 mg/kg) were injected intraperitoneally (i.p.) into tumor-bearing (for each antibody n=3) and non-tumor-bearing mice (for each antibody n=2) on day 20. Experimental readout was taken 48 hours later. In addition to the metastasis in the lung, organs with the highest TYRP1 expression relative to baseline (skin and heart) were also harvested. Organ tissue was embedded and frozen in optimal cutting temperature compound before preparation for immunofluorescence staining and imaging.
ImmunofluorescenceThe 5 µm tissue cryosections were stained on chipcytometry slides (Zellkraftwerk) with an antibody (polyclonal, AF555, Thermo Fisher Scientific) against the human IgG1-based αTYRP1/αE3 BiAb, a rabbit anti-GFP antibody (polyclonal, Novus Biologicals), a secondary antibody against rabbit IgG (polyclonal, PerCP, Jackson ImmunoResearch) and Hoechst 33 342 (Thermo Fisher Scientific). The fluorescence was measured using the ZellScannerONE (Zellkraftwerk).
PCR and quantitative real-time PCRAll DNA constructs were generated by overlap extension PCR24 and recombinant expression cloning into the retroviral pMP71 vector20 using standard molecular cloning protocols.26 RNA was extracted from cells using the InviTrap Spin Universal RNA extraction Kit (Stratec). Complementary DNA was synthesized using the SuperScript II kit (Life Technologies). Real-time PCR reactions were performed using SYBR Green PCR Master Mix (Applied Biosystems) and sequence specific primers for human MCSP, human and murine TYRP1.28–30 The amplification was performed with CFX Connect Real-Time PCR Detection System (Bio-Rad Laboratories) running up to 50 cycles of 5 s at 95°C followed by 30 s at 60°C after an initial step of 95°C for 2 min. Melting curves from 65°C to 95°C were performed to evaluate the specificity of the PCR. The messenger RNA (mRNA) expression levels of human TYRP1 and MCSP were normalized to the expression of phosphoglycerate kinase. The mRNA expression levels of murine TYRP1 were normalized to the expression of β-actin.
Cytokine release assaysMurine and human SAR T cell stimulation assays were set-up at indicated concentrations and effector to target ratios. Murine SAR T cells were co-cultured with B16, YUMM1.1 TYRP1 and Panc02-OVA cell lines. Human SAR T cells were co-cultured with MV3, A375 cell lines and human melanoma samples. Cytokine quantification was measured by ELISA for the following: interferon (IFN)-γ (BD), IL-2 (BD), tumor necrosis factor (TNF)-α (R&D Systems) and granzyme B (R&D Systems).
Statistical analysisTwo-tailed student’s t-test was used for comparisons between two groups, while two-way analysis of variance with Bonferroni post-test (multiple time points) was used for comparisons across multiple groups. A log-rank (Mantel-Cox) test was used to compare survival curves. All statistical tests were performed with GraphPad Prism V.8 software, and p<0.05 was considered statistically significant and represented as *p<0.05, **p<0.01 and ***p<0.001. No statistical methods were used to predetermine sample size. Investigators were blinded to treatment allocation during experiments and outcome assessment.
ResultsMCSP and TYRP1 are differentially expressed in melanomaTo identify suitable target structures, we assessed the expression of TYRP1 and MCSP in human melanoma cell lines as well as melanoma samples from treated and untreated patients. Both genes were shown to be highly expressed in melanoma relative to PBMC and human pancreatic cancer cell line PANC-1 control samples both at RNA and protein level (figure 1A–C, online supplemental figure 1A, online supplemental table 1). Analysis of The Cancer Genome Atlas RNA sequencing (RNA-seq) expression data also revealed MCSP to be differentially regulated in cutaneous melanoma tissue relative to skin tissue from healthy donors (figure 1D). Although the median expression of TYRP1 in cutaneous melanoma tissue was similar to the expression in skin from healthy donors, there was a far greater variability in its expression in patients with melanoma with a clear differential expression in a subset of patients (figure 1D). The expression of the targets was also analyzed across different cell types within the same patient (figure 1E), taking advantage of a single cell RNA-seq data set—GSE72056 of 3993 cells from 19 patients,31 which revealed a distinct, only partially overlapping pattern of expression for each antigen in tumor tissue (figure 1F and G). Furthermore, MCSP expression on malignant cells was well-maintained in patients that received treatment (figure 1H). TYRP1 expression pattern was similar in pre-treatment and post-treatment samples but characterized by a high spread (figure 1H).
 Figure 1
 MCSP and TYRP1 are differentially expressed on melanomas. (A) RT-PCR MCSP and TYRP1 gene analysis of human melanoma cell lines, patient-derived melanomas and controls. (B) Microscopic analysis of TYRP1 expression on permeabilized MV3, A375 and PANC-1 cells using αTYRP1/αE3 BiAb (αTYRP1) and anti-human IgG secondary antibody. (C) Microscopic analysis of MCSP expression on MV3, A375 and PANC-1 cells using αMCSP/αE3 BiAb (αMCSP) and anti-human IgG secondary antibody. (D) TCGA analysis of RNA-seq expression of TYRP1 and MCSP in skin from healthy donors and cutaneous melanoma (cutaneous melanoma: n=469; skin from healthy donor: n=556). Scales are depicted in a log2 scale and messenger RNA normalization was estimated by the TCGA using the RSEM (RNA-seq by expectation maximization) method. (E) UMAP showing 3993 (following quality control) healthy and malignant cells from 19 previously published patients (GSE72056). Normalized gene expression values were logarithmized. Colors highlight the different cell types. Annotations of cells were provided by the authors of the respective study. (F) Expression of MCSP and TYRP1 in different cell types. Normalized gene expression values were log-transformed and visualized in a UMAP embedding. (G) Expression of MCSP and TYRP1 per cell type. Color intensity indicates mean gene expression per cell type, dot size indicates the proportion of cells expressing the respective gene per cell type. Normalized expression values were log-transformed. (H) Expression of MCSP and TYRP1 across 14 samples from melanoma patients pre-treatment or post-treatment. Color intensity indicates mean gene expression per patient, dot size indicates the proportion of malignant cells expressing the respective gene per patient. Normalized expression values were log-transformed. Statistical analysis in (D) was performed with the unpaired two-tailed Student’s t-test. Experiments in subfigure (A) show mean values±SD calculated from three replicates, violin plots and the median values in (D) calculated from n independent biological replicates. Experiments in subfigures (B) and (C) show one representative of two independent experiments. CAF, cancer-associated fibroblast; MCSP, melanoma-associated chondroitin sulfate proteoglycan; NK, natural killer; PBMC, peripheral blood mononuclear cell; PGK1, phosphoglycerate kinase 1; RNA-seq, RNA sequencing; TCGA, The Cancer Genome Atlas; TYRP1, tyrosinase-related protein 1; RSEM, RNA-seq by expectation maximization.
αMCSP/αE3 and αTYRP1/αE3 BiAb bind MCSP+ and TYRP+ melanoma cellsBiAb-mediated T cell activation is dependent on antibody aggregation on the target cell before their presentation to T cells in a polyvalent form. Our previous work on the SAR platform could show that BiAb must have a single specificity for E3 to ensure conditional SAR T cell activation in the presence of the target antigen.20 This informed the BiAb design used in this study, with a trivalent and bispecific format with two specificities for the tumor antigen (TYRP1 or MCSP) and a single specificity for E3 (online supplemental figure 1B,C). The binding properties and apparent dissociation constant (KD) of BiAb (anti-MCSP/anti-E3 BiAb (αMCSP/αE3) and anti-TYRP1/anti-E3 BiAb (αTYRP1/αE3)) to both their targets (online supplemental figure 1D,E) and EGFRvIII (online supplemental figure 1F) were analyzed by flow cytometry. The previously characterized αMesothelin/αΕ3 BiAb binding the SAR and mesothelin was used as a non-melanoma targeting control construct in subsequent experiments.20
αMCSP/αE3 and αTYRP1/αE3 BiAb can mediate SAR T cell activation, proliferation and differentiationSAR constructs could be retrovirally transduced into primary murine and human T cells with high efficiencies (figure 2A). Following transduction and expansion protocols, CD4+ and CD8+ human SAR T cells were shown to be of similar frequencies and to predominantly have an effector memory phenotype (figure 2B,C). We assessed SAR T cell activation and cytokine release in both murine and human T cells. For murine T cells, we incubated SAR T cells with two TYRP1-expressing cell lines, B16 and YUMM1.1 TYRP1 and with the antigen-negative, pancreatic cancer cell line Panc02-OVA (online supplemental figure 1G–I) in the presence of αTYRP1/αE3 BiAb. Murine SAR T cells specifically released IFN-γ, IL-2, TNF-α and granzyme B and expressed the activation markers programmed cell death protein 1 (PD-1) and CD69 on co-culture with TYRP1+ melanoma cell lines, unlike in co-culture with antigen-negative Panc02-OVA tumor cells (online supplemental figure 2A,B). SAR T cells only proliferated in the presence of TYRP1-expressing tumor cells and BiAb (online supplemental figure 2C). Human SAR T cells were incubated with the MCSP+ and TYRP1+ cell lines, A375 and MV3, respectively. Only in the presence of the MCSP-targeting BiAb molecule and the target antigen, human SAR T cells released IFN-γ, IL-2, TNF-α and granzyme B. In contrast, untransduced T cells (Unt) and control-E3del-transduced T cells remained inactive and did not produce cytokines or cytotoxic granules regardless of the presence of the BiAb and target antigen (figure 2D). The frequency of CD69, PD-1 and 4-1BB-expressing SAR T cells was increased in the presence of either one of the two BiAb molecules and antigen-expressing target cells (figure 2E). CD4+ and CD8+ T cell proliferation was congruent with the activation observed, as stimulated SAR T cells proliferated more than control T cells or SAR T cells in the absence of BiAb (figure 2F).
 Figure 2
 αMCSP/αE3 and αTYRP1/αE3 BiAb activate SAR T cells to mediate specific cytotoxicity against human melanoma cell lines. (A) Expression of the constructs E3 and E3del on murine T cells and human T cells from healthy donors (n=4–5). E3, E3 SAR-transduced T cells. E3del, T cells transduced with E3 SAR lacking intracellular signaling domains. (B) Frequency of CD4 and CD8 expression on human T cells. (C) Frequency of effector memory (CCR7− and CD45RO+), central memory (CCR7+ and CD45RO+), naïve (CCR7+ and CD45RO−) and effector (CCR7− and CD45RO−) phenotype on human T cells. (D) ELISA for granzyme B, IFN-γ, IL-2 and TNF-αon supernatant of human T cells in co-culture with human melanoma cell line A375 (E:T 2:1) and with or without αMCSP/αE3 BiAb (αMCSP, 1 µg/mL). Supernatant was taken after 24, 48 and 72 hours (n=3–6). (E) Frequency of CD69, PD-1 and 4-1BB expression on T cells after 48 hours of co-culture with A375 or MV3 (E:T 2:1) and either with or without αMCSP/αE3 or αTYRP1/αE3 BiAb (αMCSP or αTYRP1, 1 µg/mL) (n=3–6). (F) Following 48 hours of co-culture, the CD3+ T cell count per bead was assessed by flow cytometry. Counts were normalized to conditions without BiAb (n=3–6). (G) The percentage lysis of melanoma cell lines A375, MV3, and antigen-negative, pancreatic cancer cell line PANC-1 by SAR T cells and either of the two BiAb was calculated using a flow cytometry-based readout after 48 hours of co-culture (n=3–6). The values shown were normalized to the Unt T cells without BiAb control condition which was taken as 0% lysis. Statistical analysis was performed using the paired two-tailed Student’s t-test. Statistics shown in (D) were calculated based on the 24-hour time points. Experiments show mean values±SD calculated from n independent biological replicates. BiAb, bispecific antibodies; E:T, effector to target ratio; IFN, interferon; IL, interleukin; MCSP, melanoma-associated chondroitin sulfate proteoglycan; PD-1, programmed cell death protein-1; SAR, synthetic agonistic receptor; TNF, tumor necrosis factor; TYRP1, tyrosinase-related protein 1; Unt, untransduced T cells.
SAR T cells can target and lyse MCSP-expressing and TYRP1-expressing melanomasUsing flow cytometry-based and impedance-based assays, we evaluated whether SAR T cells could selectively lyse MCSP-expressing and TYRP1-expressing melanoma cells in the presence of a bridging BiAb. Human SAR T cells specifically eliminated antigen-positive A375 and MV3 melanoma cells when co-cultured together with either an αMCSP/αE3 or αTYRP1/αE3 BiAb whereas no lysis was detected with the antigen-negative pancreatic cancer cell line PANC-1 (figure 2G). Similarly, murine SAR T cells only lysed TYRP1+ B16 and YUMM1.1 TYRP1 melanoma cells in the presence of an αTYRP1/αE3 BiAb (online supplemental figure 2D,E). TYRP1-specific and MCSP-specific BiAb conditionally activated human SAR T cells in co-culture with patient-derived melanoma samples. SAR T cells showed increased expression of the activation markers CD69, PD-1 and 4-1BB, secretion of IFN-γ and proliferation, relative to E3 only or Unt T cell in presence of either of the BiAb (figure 3A–C). Also, TYRP1-specific and MCSP-specific BiAb redirected SAR T cells to target and lyse all patient-derived melanoma samples tested, whereas Unt and BiAb controls had no effect on tumor cell lysis (figure 3D).
 Figure 3
 αMCSP/αE3 and αTYRP1/αE3 BiAb activate SAR T cells to mediate specific cytotoxicity against patient-derived melanoma samples. (A) Human T cells were co-cultured with patient-derived melanoma samples (effector to target ratio 2:1) and either αMCSP/αE3 or αTYRP1/αE3 BiAb (αMCSP or αTYRP1, 1 µg/mL) for 48 hours. The frequency of CD69, PD-1 and 4-1BB on T cells was assessed using flow cytometry. (B) Supernatant was taken and analyzed with ELISA for IFN-γ.The values were normalized to the numbers of plated T cells. (C) The CD3+ T cell count per bead was measured and normalized to conditions without BiAb. (D) The percentage lysis of the patient-derived melanoma samples by SAR T cells and either of the two BiAb was calculated based on flow cytometric readout after 48 hours of co-culture. The values shown were normalized to the tumor cells only control conditions. Statistical analysis was performed using the paired two-tailed Student’s t-test. Experiments show mean values±SD. Each data point represents the mean of 2–3 biological replicates. BiAb, bispecific antibodies; IFN, interferon; MCSP, melanoma-associated chondroitin sulfate proteoglycan; PD-1, programmed cell death protein 1; SAR, synthetic agonistic receptor; TYRP1, tyrosinase-related protein 1; Unt, untransduced T cells.
Cleavable proteins do not impact SAR-BiAb platform efficacy and safetyWith elevated levels of MCSP having been reported in the sera of patients with melanoma,32 we sought to better understand the potential impact of soluble MCSP or TYRP1 on the SAR T cell-BiAb approach. Therefore, soluble recombinant MCSP and TYRP1 proteins were used. Proteins were added in ascending concentrations to a T cell-tumor cell co-culture to study T cell killing efficiency and kinetics. Ascending concentrations of MCSP and TYRP1, including concentrations at a physiological level, did not impair SAR T cell killing (figure 4A and online supplemental figure 3A). We also sought to test whether free soluble protein targets would induce unwanted off-tumor SAR T cell activation. We found that soluble MCSP and TYRP1 did not induce SAR T cell activation in the presence of either relevant BiAb, both at physiological and supraphysiological concentrations that were tested. There, no significant changes in IFN-γ levels were observed when comparing E3 and BiAb conditions to controls containing soluble recombinant MCSP or TYRP1 (figure 4B and online supplemental figure 3B). It should be noted that in this setting a higher basal SAR T cell activation was observed with the αTYRP1/αE3 compared with the αMCSP/αE3 BiAb. It appears that the SAR T cell-BiAb platform is not easily impacted by alternative soluble sources of targeted proteins and requires immobilization of these on the tumor cell surface, as previously described for other targets in one of our previous studies.20 These findings align with the fact that the BiAb was designed only to bind a membrane-proximal epitope that remains on the cell surface following cleavage.
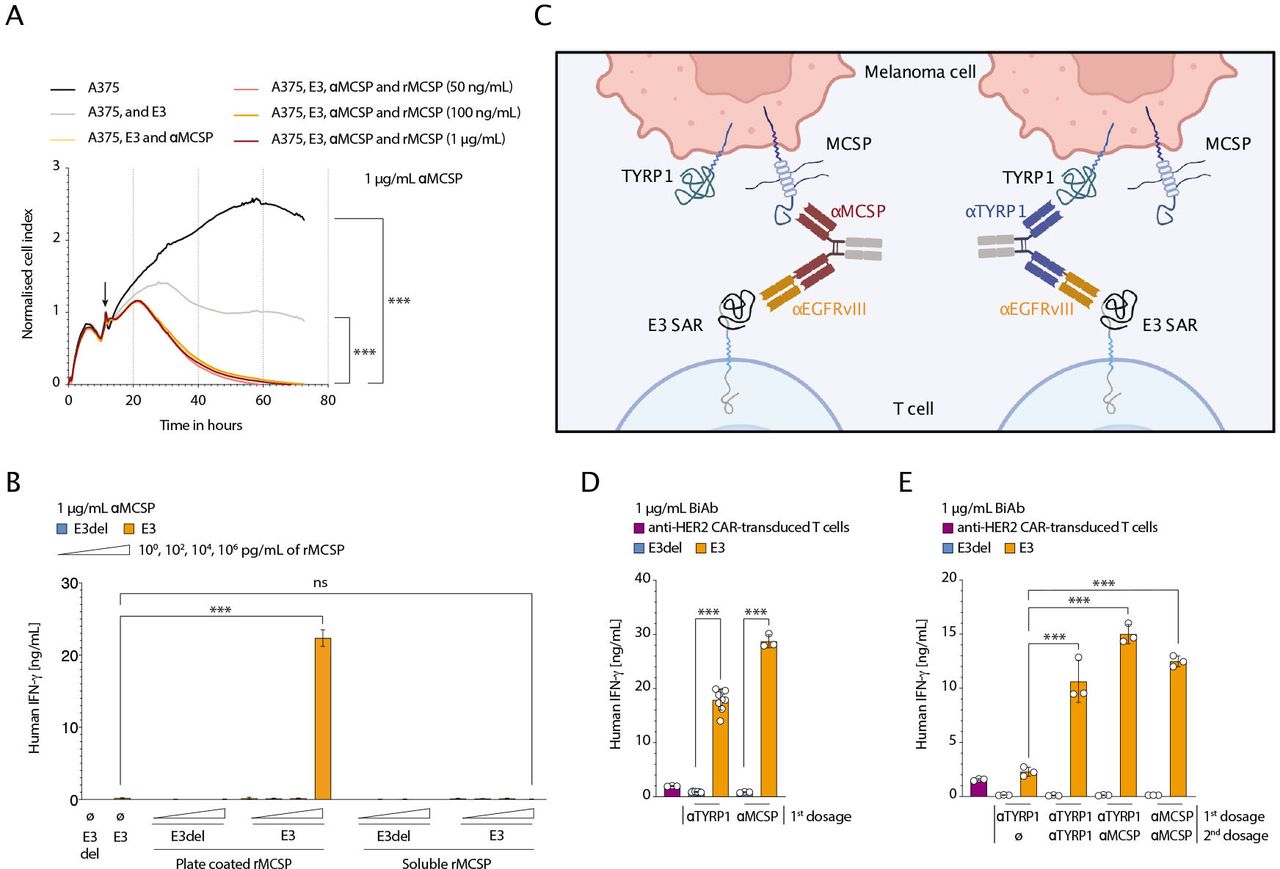 Figure 4
 Modular, selective and reversible activation of SAR T cells, irrespective of soluble forms of MCSP tumor antigen. (A) A375 melanoma cells were plated and co-cultured with human SAR T cells (E:T 2:1) and αMCSP/αE3 BiAb (αMCSP, 1 µg/mL). Different concentrations of soluble, recombinant MCSP (rMCSP) were added. The tumor cell lysis over time was assessed using xCELLigence (n=3). The cell index was normalized to the respective time point of T cell addition as indicated by an arrow. (B) Human SAR or E3del control T cells and αMCSP/αE3 BiAb (1 µg/mL) were plated in wells either coated with different concentrations of rMCSP or where different concentrations of soluble rMCSP were added to the medium. After 48 hours the supernatant was taken and analyzed for IFN-γ using ELISA (n=3). (C) Schematic overview of SAR-transduced T cells targeting TYRP1+ MCSP+ melanoma cells via an αTYRP1/αE3 or αMCSP/αE3 BiAb. (D and E) A modularity stress test was carried out using αMCSP/αE3 or αTYRP1/αE3 BiAb (αMCSP or αTYRP1, 1 µg/mL). SAR or E3del control T cells were co-cultured with A375 tumor cells (E:T 2:1). HER2 CAR T cells were used as a control and co-cultured with HER2+ A375 tumor cells (no BiAb was added). At assay start, co-cultures received either αMCSP/αE3 or αTYRP1/αE3 BiAb (first dosage). At 24 hours, the T cells were washed to remove residual BiAb and transferred to freshly plated A375 tumor cells. Co-cultures were then either redosed with the same BiAb, redosed with the BiAb against the other target, or not redosed after initial dosing (second dosage) and incubated for another 24 hours. At 24 (D) or 48 hours (E), supernatants were taken and ELISA for human IFN-γ were performed (n=3). Analyses of differences between groups for (A) were performed using two-way analysis of variance with correction for multiple testing by the Bonferroni method. For statistical analysis of (B), (D) and (E), the unpaired two-tailed Student’s t-test was used. Experiments show mean values±SD calculated from at least three biological replicates and are representative of three independent experiments. BiAb, bispecific antibodies; E:T, effector to target ratio; IFN, interferon; EGFRvIII, epidermal growth factor receptor variant III; MCSP, melanoma-associated chondroitin sulfate proteoglycan; SAR, synthetic agonistic receptor; TYRP1, tyrosinase-related protein 1; HER2, human epidermal growth factor receptor.
Modular, selective and reversible activation of SAR T cells against melanomaMelanomas are heterogeneous and stand to benefit from a modular and controllable therapeutic approach. Use of the melanoma differentiation antigens shared with other cells calls for control over these effects to antagonize potential unwanted excessive toxicities. While classic CAR T cell activity is maintained in the presence of a target antigen, SAR T cell activation is modular and controllable (figure 4C).19 To demonstrate this in the melanoma setting, we used an in vitro stimulation assay to show how BiAb-dependent SAR activation enables greater control over T cell function (online supplemental figure 3C). As expected, following a 24-hour co-culture with MCSP+ TYRP1+ A375 tumor cells, SAR T cells could be activated in the presence of either of the two BiAb molecules (figure 4D). The same SAR T cells were then transferred to a new plate containing freshly plated A375 cells where they were co-cultured for a further 24 hours under different stimulation conditions. We found IFN-γ expression was maintained when SAR T cells were redosed with either one of the two BiAb molecules (figure 4E). However, the concentration of IFN-γ decreased in the absence of BiAb redosing, indicating the reversibility of SAR T cell activation. This was distinct from the lack of controllability seen with human anti-HER2 CAR T cells when targeting HER2+ A375 tumor cells, which continued to sense HER2+ tumor cells33 (figure 4E).
At the same time, sequential targeting of multiple antigen types would allow for more refined patient-specific tailoring of treatment and prevention of antigen-negative relapse. Through redosing with αMCSP/αE3 BiAb (first dosing with αTYRP1/αE3), the transferred SAR T cells remained activated, as shown by an elevated IFN-γ concentration after 48 hours of co-culture (figure 4E).
By sequentially redirecting SAR T cells towards different melanoma targets with high efficiency, the modularity of the platform was demonstrated (figure 4D, E). Overall, this approach has the potential to target a variety of melanoma-associated antigens with a level of flexibility and controllability that is superior to that of CAR T cells.
SAR T cell-BiAb combination mediates effective tumor control in vivoTo probe the in vivo function of the SAR T cell-BiAb combination, we established and used both syngeneic and xenograft melanoma models. We engrafted the YUMM1.1 TYRP1-LUC-GFP murine melanoma cell line into C57BL/6 mice. The MV3 and A375 human melanoma cell lines and a sample from a patient with primary melanoma (sample 2) were implanted into NSG mice. In the syngeneic model, following adoptive transfer, SAR T cells were shown to persist well, where SAR+ T cells could be tracked in the perip
留言 (0)