
記住我


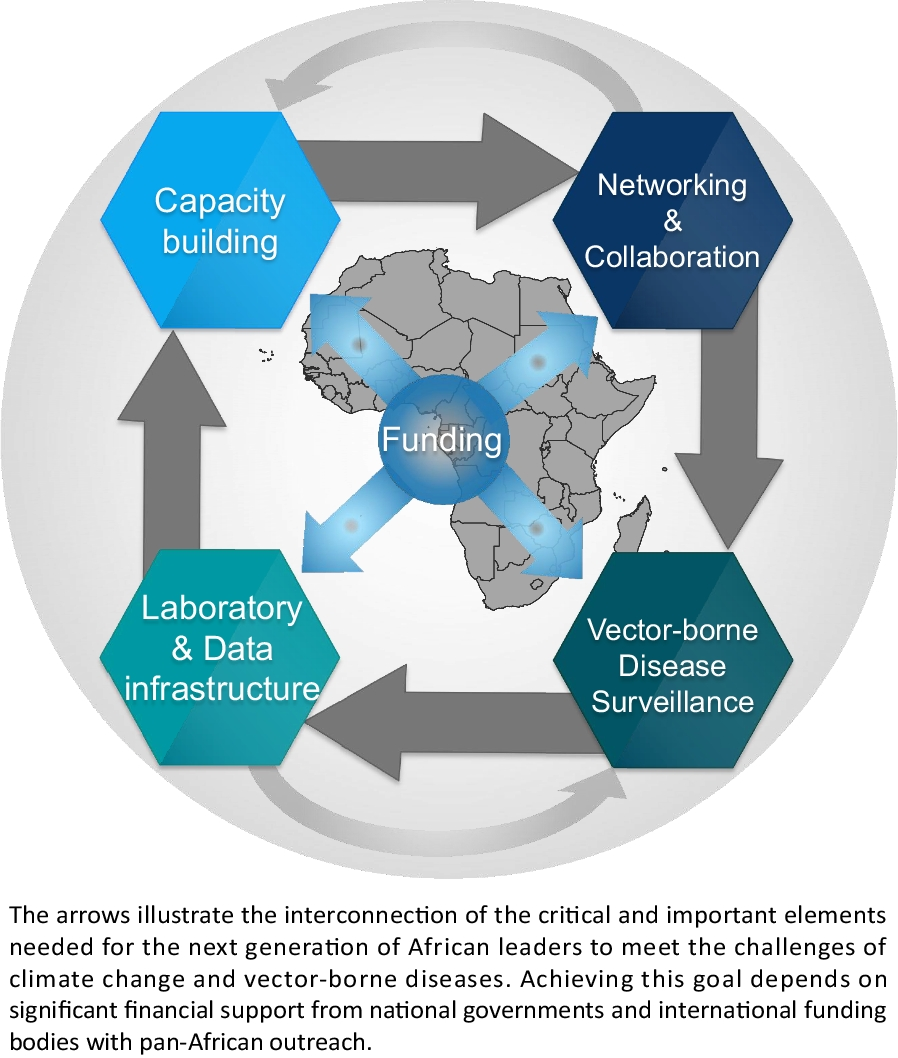
Northeast Thailand has been a high endemic area for human O. viverrini infection and also reported the highest incidence of O. viverrini-associated bile-duct cancer (i.e., cholangiocarcinoma) in the world [22]. The study area is located in the southern Kalasin Province, a lowland floodplain of the Chi River (Fig. 1). Prevalence of O. viverrini infection remained high at 37.3% in 2016 for the sub-district [23] where the two surveyed villages are situated. The study focuses on a wetland environment, with a mosaic landscape of river, pond, rice paddy, and human settlement. The products and services (e.g., water supply, rice farming and fishing) from the wetland ecosystem are central to local livelihood practices. Two villages (‘Ban’ in Thai), Ban Nam (BN) and Ban Tong (BT) (pseudonyms) from the area were selected, because of their differences in physical environment, and proximities to a river system. BN is adjacent to a river and a large pond, while BT is more than 4 km away from the river, surrounded by rice paddies and farmland (Fig. 1).
Fig. 1
A Location of the study area in Northeast Thailand. B Surveyed villages Ban Nam (BN) and Ban Tong (BT), and their landscape surroundings. Fishing activities using C the ‘lift net fishing’ structure and D poles for ‘brushwood fishing’ are evident in the study area, showing the strong connection with the environment for ecosystem services
Field sampling and laboratory analysis of snail and waterTo investigate research question one on whether freshwater ecosystems of village surroundings contribute to ecosystem disservices of O. viverrini transmission, two types of samples, snail and water, were collected. Field work was done in 2019 between June and September. Sampling plots were set to include all water bodies within 100 m from the edge of the household area of each village, which comprised mostly rice paddies.
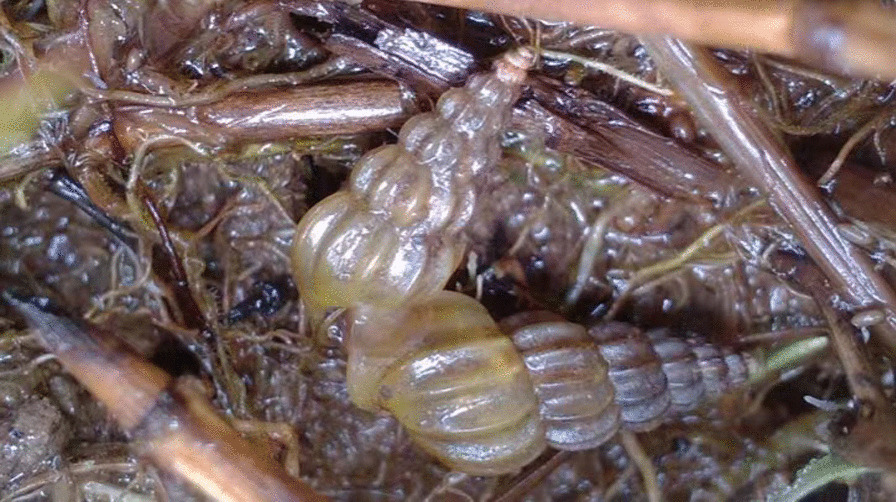
Snail sampling was performed to understand the extent to which the first intermediate Bithynia snail host dominated the freshwater ecosystems in the village surroundings and the parasitic infections in snails. The time search method [24] with 10-minute search was carried out by two researchers concurrently to collect as many snails as possible at each sampling plot. The researchers moved around the periphery of a water body sampling plot to collect snails by either hand-picking or using a scoop net, depending on the plot conditions. The collected snails were brought back to the laboratory for species identification to further compute their relative abundances. The standard cercarial shedding method for detecting parasitic infection in snails [25] was done for Bithynia snails to determine their parasitic infections. Under a light microscope, the emerged cercariae of different parasites, including O. viverrini, were identified by morphology according to the keys in [26]. Infection rates of different parasites in Bithynia snails were then calculated.
Because prior literature has shown low O. viverrini prevalence in the first intermediate snail host [27], water sampling was done to examine fecal contamination in the village surroundings as a proxy for potential O. viverrini transmission [28, 29]. Fecal contamination was measured using Escherichia coli concentration, as the presence of E. coli in water indicates potential contamination by human and other mammalian feces, which could carry parasite eggs for disease transmission. To detect E. coli concentration, the Colisan Easygel testing kit (Micrology Laboratories) was used for its usefulness in providing quantitative estimations on E. coli content in the water environment [30]. From each sampling plot, 5 ml of water was collected and poured into the testing kit, stored in an ice box, and brought back to the laboratory. Next, the samples were poured into pretreated petri dishes for incubation at 35 ℃ for 24 h. Thereafter, purple colonies resulted from the interactions between the Easygel medium and the enzymes produced by E. coli were counted and quantified as the colony forming units (CFUs) per 100 ml of water based on Eq. (1):
$$CFU\,per\,100\,ml = \frac} \times 100.$$
(1)
Questionnaire surveyTo investigate research question two on the effect of ecosystem services on raw fish consumption habits and research question three on the influence of raw fish dish sharing on O. viverrini infection risk, questionnaire survey was conducted to gather information on 120 villagers’ raw fish consumption habits, sharing practices and O. viverrini awareness. The survey was conducted in Thai with the aid of local translators who had been introduced about the life cycle of the parasite, public health information of the infection, and the contexts of the survey questions asked. Convenience sampling was used to recruit participants based on their availability at the time of the visit and their willingness to take part in the survey. The participants were also invited to raise queries at any time during the survey should any clarification be needed regarding the questions asked.
To ensure quality control, the survey took the form of structured interviews with the questionnaire consisting of multiple sections of mostly multiple-choice questions. This ensures that the questions asked and the options provided for response were consistent across the villages. The option ‘Others’ is also provided for participants to elaborate should their answers not be found in the list of options provided. The first section of the questionnaire surveyed villagers’ basic information (e.g., household number, gender). The subsequent sections included questions on (a) types and frequencies of raw fish dishes consumed, (b) consumption reasons, (c) O. viverrini awareness and prevention, and (d) raw fish dish sharing and fish procurement locations.
For the types and frequencies of raw fish dishes consumed, participants were asked if they have consumed any of the three Isan raw fish dishes, koi pla, pla som and pla ra, and their consumption frequencies (i.e., daily, weekly, monthly, or annual special occasions). Koi pla, or freshly made raw fish salad, is a mixture of finely chopped raw fish, lime juice, herbs and spices. Pla som, sticky rice-fermented fish or sour fish, is a lightly fermented fish dish, mixed with raw fish, salt, garlic and rice, with two to seven days of fermentation. Pla ra, a highly salted fish dish, has long-term fermentation from several months to one year, and is also often used as a seasoning ingredient. The risk of O. viverrini infection could be higher for consuming kio pla and pla som because the former is eaten soon after it is made and the fermentation time for the latter is not long enough to kill the parasites. Indeed, viable O. viverrini metacercariae have been detected in these two dishes [31]. Nevertheless, pla ra may still contain metacercariae depending on the fermentation time and the amount of salt used. Some pla ra sold in local markets have been detected with metacercariae despite the degeneration of their morphology [32].
For consumption reasons, five options based on prior studies (e.g., [19, 33, 34]) were compiled, including: Preference for taste/delicious; family/Isan tradition; social gathering; main source of meat/protein; and convenience. Participants could select more than one option, as there could be multiple reasons for consumption. For O. viverrini awareness and prevention, participants were asked about their sanitation practices (i.e., open defecation or not), awareness of the health consequence associated with raw fish consumption, and their willingness to avoid raw fish consumption should they be aware of the health consequence. For raw fish dish sharing and fish procurement locations, participants were surveyed for the households with which they shared the raw fish dishes and where they obtained fish from to make their raw fish dishes.
Data analysisExamining ecosystem disservices of parasitic infectionTo assess if the village surrounding water bodies potentially provided ecosystem disservices of O. viverrini transmission, the following indicators were calculated. Snail species compositions were calculated as relative abundances of individual species in percentages. The proportions of the sampling plots with infected Bithynia snails and fecal contaminations were derived. Cerarial shedding of parasitic infection rates in snails and the means and ranges of fecal contamination in water samples were computed. Proportions of the participants who practiced open defection were analyzed from the questionnaire survey. Then, the two-sample t-test was used to assess the statistical difference between all quantitative indicators of the two villages, unless otherwise specified. All statistical analyses of this study were performed using the statistical software R 3.6.3 on R Studio [35], with the statistical significance level set at P < 0.05.
Investigating consumption habits and their relations to cultural and provisioning ecosystem servicesTo investigate the linkages between raw fish consumption and ecosystem services, participants’ questionnaire responses on preference for taste/delicious, family/Isan tradition and social gathering were grouped as relevance to cultural ecosystem services, and the percentage of these responses was computed. Likewise, participants’ responses on main source of meat/protein and convenience were grouped as provisioning ecosystem services.
The consumption frequencies of different dishes were first computed to the average days per year for comparison. Then, comparison was made between male and female because gender has been considered as a major demographic variable influencing food consumption behavior [36]. Prior study has suggested that males like to eat raw fish dishes particularly koi pla [33], as it embodies strength and power, which are traditionally associated with masculinity [19]. Univariate linear regression analysis was then performed for each village following Eq. (2). In each regression model, gender was used as the independent variable (X) with female as the baseline gender and male as the variable gender. The consumption frequencies of higher risk dishes, i.e., koi pla, pla som and a combination of both, were individually used as the corresponding dependent variables (Y).
$$Y=\alpha +\beta X+\varepsilon,$$
(2)
where a denotes the intercept for the baseline gender, β denotes the regression coefficient for the variable gender, and ε denotes the error term for each model. In addition, the gendered differences of reasons for raw fish consumption were analyzed following Eq. (2) to investigate the potential influences of specific motivation on any particular raw fish dishes. In each regression model, gender was again used as the independent (X) variable with female as the baseline gender and male as the variable gender, while the five reasons for consumption was used as the dependent variable (Y). Likewise, α denotes the intercept for the baseline gender, β denotes the regression coefficient for the variable gender, and ε denotes the error term for each model.
To understand the potential influences various perceptual and behavioral factors had on consumption habits, three sets of multivariate linear mixed effect regressions were performed for each village following Eq. (3):
$$Y=\beta X+\mu Z+\varepsilon,$$
(3)
where Y is the dependent variable representing consumption frequency (of combinations of koi pla, pla som and pla ra), willingness to avoid consumption (model ran with binomial distribution) and O. viverrini infection status (model ran with binomial distribution), respectively in each of the three sets of analyses. β represents the regression coefficient for X, the fixed effects vector comprising independent variables, including consumption frequency, two consumption reasons of ecosystem services (i.e., cultural and provisioning), three perceptual and behavioral factors (i.e., awareness of health consequence, willingness to avoid consumption, and participation in food sharing activities), and gender. The variable for consumption frequency was removed as a fixed effect variable when it was used as the dependent variable, and the perceptual factor of willingness to avoid consumption was removed as a fixed effect variable when it was used as a dependent variable. To account for the variation in characteristics between village BN and BT, a random intercept of Z was included in the models with their corresponding coefficient of µ. Lastly, ε represents the error term for the model.
Data on O. viverrini infection status used in Eq. (3) were obtained from the local health center that coordinated O. viverrini prevalence survey with the Cholangiocarcinoma Screening and Care Program (CASCAP) from 2016 to 2019. The overall human infection prevalence was calculated first for the two villages. O. viverrini infection status of individual villagers who participated in the questionnaire survey of this study was then extracted from the CASCAP data for the analyses of this study.
Analyzing raw fish dish sharing networks, fish procurement locations and O. viverrini infection riskParticipants’ responses on the households with which they shared the dishes, and where they obtained fish from to make their raw fish dishes were analyzed to assess if villages had varying networks of sharing and different environmental connections for fish procurement. Because prior study suggested that greater connectivity among households might increase human O. viverrini infection risk [18], network analysis was conducted to assess the potential association between household connections through raw fish dish sharing and O. viverrini infection risk. The graph theory approach was used to show the relative positions and relationships between individual entities and their connections in a network [37], with the entities and the relationships among them respectively conceptualized as a set of nodes and links. Accordingly, nodes were used to represent households that reported raw fish sharing behavior and the fish procurement locations. Links were used to represent the connection between two households that shared raw fish dishes and between the households and their fish procurement locations. No physical distances were used as the analyses were based on household connections of fish dish sharing activities or fish procurement locations.
Two sets of network graphs were created using the igraph R package [38]. The first set of the graphs focused on comparing the degree of raw fish dish sharing between BN and BT households, and the following indices were quantified: number of nodes, number of components, network density, mean degree centrality, and mean betweenness centrality. A component is a group of connected nodes; a higher number of components suggests more groups of sharing activities in individual village. Network density is computed as the proportion of the number of links to all possible links in the given network, illustrating the interconnectedness of the sharing activities. Degree centrality of a node measures the number of other distinct nodes connected to it by a link; hence, the higher the degree centrality, the more prominent the node is in the network because of its potential to directly interact with more entities. Alternatively, betweenness centrality measures the frequency of which a node sits on the shortest path between a pair of nodes, indicating the effectiveness of the node in bridging nodes in a network. As degree centrality is indicative of the level of social connectivity of a household in its food sharing network, degree centrality calculated from the first set of networks without accounting for connections to fish procurement sites, were used as one of the fixed effect independent variables in aforementioned the linear mixed effect models with Eq. (3).
The second set of the graphs incorporated fish procurement locations and their connections to households into the first set. For both sets of graphs, household nodes with O. viverrini positive infection, negative infection, or not tested were visualized. The probable influence of connections to fish procurement locations and sharing activities on O. viverrini infection risk was assessed.
留言 (0)