
記住我
Microglial cells are small stellate cells that play an essential role in brain homeostasis (Wright-Jin and Gutmann, 2019). They are involved in synaptogenesis, neurotransmission and neurogenesis, which gives them the ability to control the activity of neuronal circuits. Moreover, they regulate blood brain barrier permeability and can sense metabolic circulating signals from the periphery supporting their role in neuroendocrine functions. As the main immune cells in the brain, they can perform phagocytosis, antigen presentation, and secrete chemoattractant substances and inflammatory mediators in response to injury and infection.
Dysfunction of microglia and/or modification of the microglial homeostatic state clearly contributes to the pathogenesis of some brain diseases (Sirkis et al., 2021; Paolicelli et al., 2022), including peroxisomal leukodystrophies such as X-linked adrenoleukodystrophy (X-ALD, MIM 300100). X-ALD, the most frequent peroxisomal disorder, is associated with mutations in the ABCD1 gene and is characterized by an impaired peroxisomal β-oxidation pathway and very long-chain fatty acid (VLCFA) accumulation in plasma and tissues of patients (Mosser et al., 1993; Trompier and Savary, 2013; Kemp et al., 2016). Functional replacement of microglia by monocyte/macrophage cells using allogeneic hematopoietic stem cell transplantation and cell-based gene therapy has proven to be therapeutically effective for X-ALD patients (Cartier et al., 2009; Eichler et al., 2017; Weinhofer et al., 2018). Metabolic defects in microglia are indeed suggested to be key contributors to the pathology of X-ALD. Moreover, it has also been proposed that a primary microglial dysfunction might directly initiate neurodegenerative processes since microglial alteration precedes myelin breakdown in X-ALD (Gong et al., 2017; Bergner et al., 2019).
Using the CRISPR/Cas9 gene editing technology, we recently established novel cell models to study the impact of peroxisomal defects in BV-2 murine microglial cells (Raas et al., 2019a,b). The BV-2 cells were chosen because they maintain transcriptomic signature resembling that of primary cells and many microglial features such as phagocytosis and the ability to respond to inflammatory stimulation (Henn et al., 2009; Das et al., 2015). Despite thousands of articles using BV-2 cells as a model, the cell line is not fully representative of primary cells especially upon LPS treatment with a lower reactivity than what is observed with primary cells (Das et al., 2016). Moreover, primary microglia present a spatial and temporal heterogeneity particularly under pathological status (Masuda et al., 2019). While fully aware of the limitations of the model, we decided to use the BV-2 cell line and targeted the Abcd1 and Abcd2 genes, which encode for partially redundant peroxisomal ABC transporters of CoA esters of VLCFAs (Mosser et al., 1993; Lombard-Platet et al., 1996; Genin et al., 2011; Tawbeh et al., 2021), and the Acyl-CoA oxidase 1 (Acox1) gene, which controls the first step of peroxisomal β-oxidation and whose defect is associated with a rare leukodystrophy (MIM 264470; Fournier et al., 1994; Nohammer et al., 2000; Ferdinandusse et al., 2007; Vamecq et al., 2018). Peroxisomal ABC transporters show overlap in their substrate specificity, with ABCD1 being more specialized in the transport of saturated and monounsaturated VLCFAs while ABCD2 would show an extended specificity to polyunsaturated fatty acids (PUFAs; Mosser et al., 1993; Lombard-Platet et al., 1996; Genin et al., 2011; Tawbeh et al., 2021). Both transporters provide the substrates of ACOX1 for further degradation. Since BV-2 cells express both Abcd1 and Abcd2 genes, VLCFA accumulation was only observed in the Abcd1−/−Abcd2−/− and Acox1−/− microglial cells, as expected (Raas et al., 2019a,b). Lipid droplets and lipid inclusions likely due to cholesteryl esters of VLCFA, some of the hallmarks of X-ALD, were also observed, especially in the Abcd1−/−Abcd2−/− genotype (Raas et al., 2019a,b).
To further clarify how peroxisomal defects impact microglia, we used next generation sequencing (NGS)-based approach to obtain an accurate and unbiased vision of the differentially expressed genes (DEGs) in microglial cells with specific peroxisomal gene mutations. RNA-sequencing (RNA-seq) indicated the induction of specific transcriptomic programs in the mutant genotypes. Nevertheless, intersectional analysis revealed a common transcriptomic program in the four genetic mutants. Gene ontology analysis permitted to highlight deregulated gene clusters involved in immune system process, signaling pathways, lipid metabolism, lysosome, and autophagy. We also demonstrated the induction of a disease-associated microglial (DAM) signature in microglia cells bearing one or several peroxisomal gene mutations. A DAM signature is a transcriptomic response shared by most common neurodegenerative diseases (Keren-Shaul et al., 2017; Butovsky and Weiner, 2018; Dubbelaar et al., 2018). We confirmed these transcriptional modifications at the protein level for several dysregulated genes and explored some functional consequences on plasma membrane (cholesterol accumulation), lysosomal alterations and autophagy. Moreover, we observed an increased secretion of five selected proteins belonging to the DAM signature, which prompted us to launch a pilot study in X-ALD adult patients.
Materials and methods Resource availabilityThe data discussed in this publication have been deposited in NCBI’s Gene Expression Omnibus (Edgar et al., 2002) and are accessible through GEO Series accession number GSE200022.
The data supporting the findings and the excel files containing the gene lists used to create the figures are available from the corresponding author (SS) upon request.
Cell cultureMouse microglial BV-2 cell line was purchased from Banca-Biologica e Cell Factory (catalog no. ATL03001). Single or double mutant BV-2 cells, deficient for the peroxisomal proteins Abcd1, Abcd2 or Acox1 (Abcd1−/−, Abcd2−/−, Abcd1−/−/Abcd2−/−, and Acox1−/−), were obtained by CRISPR/Cas9 editing (Raas et al., 2019a,b). Sanger sequencing confirmed the absence of CRISPR/Cas9-induced mutations in the two genomic sites with the highest predicted likelihood of off-target binding strongly, suggesting the absence of off-target events. WT and mutant BV-2 cells were grown in DMEM supplemented with 10% heat-inactivated FBS (Corning), 100 U/mL penicillin and 100 μg/mL streptomycin (Gibco). Cultures were maintained at 37°C in a humidified atmosphere containing 5% CO2. For RNA-seq experiments, as BV-2 WT and mutant cells were included as controls in a study involving treatments (study which will be the subject of another article), a treatment with 0.01% ethanol and 0.5 mM α-cyclodextrin corresponding to the vehicle was applied.
Blood and plasma samplesFrozen plasma samples from male X-ALD patients were obtained from the X-ALD Biobank of Dijon (agreement for research usage CRB.FC-MAD 12236.4, Centre de Ressources Biologiques (CRB) Ferdinand Cabanne, Dijon, France). There is no restriction on the use of these human samples to identify putative biomarkers. Control plasma samples were obtained after centrifugation (1,300 g for 10 min) from fresh blood samples obtained from male healthy donors (agreement for the transfer of blood products for non-therapeutic use between Etablissement français du sang Bourgogne Franche-Comté, France and University of Bourgogne DECO-21-0051). Analyzes were carried out in samples from 3 patients with arrested cALD (ages 36, 16, and 30 years, with onset ages of 21, 10, and 14 years, respectively for patients cALD1, cALD2 and cALD3), 3 AMN patients (ages 43, 42, and 44 years, with onset ages of 33, 25, and 36 years, respectively for AMN1, AMN2, and AMN3), and 10 healthy donors aged 40 to 45 years. Last examination of cALD patients revealed a severe dementia (cALD1), a mildly abnormal gait and moderate dementia (cALD2) and a near-normal situation (cALD3). Their C26:0 plasma level at the date of sampling was 2.40 μmol/L (cALD1), 3.39 μmol/L (cALD2), 5.96 μmol/L (cALD3; normal value < 1.45 μmol/L). Patients cALD1 and 2 received Lorenzo’s oil.
RNA-sequencingTotal RNA was extracted from 3 independent batches of BV-2 cells for each genotype (WT, Abcd1−/−, Abcd2−/−, Abcd1−/−Abcd2−/−, and Acox1−/−) using RNeasy kit (Qiagen). RNA sequencing libraries were prepared using the Illumina TruSeq Stranded mRNA LT Sample Preparation Kit and sequencing was performed on Illumina HiSeq4000 sequencer as single-end 1×50 base reads. Reads were preprocessed using cutadapt (Martin, 2011) version 1.10 in order to remove adapter and low-quality sequences (Phred quality score below 20) and reads shorter than 40 bases were discarded for further analysis. Reads mapping to rRNA sequences were also discarded [this mapping was performed using bowtie (Langmead and Salzberg, 2012) version 2.2.8]. Reads were then mapped onto the mm10 assembly of Mus musculus genome using STAR (Dobin et al., 2013) version 2.5.3a. Gene expression was quantified using htseq-count (Anders et al., 2015) version 0.6.1p1 and annotations from Ensembl version 91. Differential gene expression analyses were performed using R 3.3.2 and DESeq2 version 1.16.1 Bioconductor library (Love et al., 2014). p values were adjusted for multiple testing using the Benjamini and Hochberg method (Benjamini and Hochberg, 1995).
Differential gene expression analysis and bioinformaticVenn diagrams were obtained using Venny 2.1. MA-Plot and Volcano plot were obtained using the VolcaNoseR web app. Gene ontology analysis and gene set enrichment analysis were performed using the DAVID resources (Huang et al., 2007; Huang da et al., 2009) for association with KEGG pathways and the Enrichr platform (Kuleshov et al., 2016) for association with Wikipathways 2019 Mouse and Elsevier pathway collection. Significance level of 0.05 was used when not correcting for multiple testing. A cutoff of 0.05 for adjusted p-value was chosen for multiple testing correction using the method from Benjamini and Hochberg (BH). DEGs were selected from genes presenting an adjusted p-value lower than 0.05 and an absolute log2 FC higher than 0.58. Expression-based heatmaps and hierarchical clustering were performed with Heatmapper (Babicki et al., 2016) using average linking and Pearson distances.
Lipid analysisThe levels of cholesterol precursors were measured by gas chromatography–mass spectrometry (GC–MS) from cellular homogenates, prepared from pellets of 107 cells suspended in water (100 μL) and mixed with structural homologous internal standards as previously described (Raas et al., 2019a). Peak integration was performed manually. Metabolites were recognized by retention time and fragmentation patterns, and quantified from total-ion count against internal standards using standard curves for the measured sterols (Leoni et al., 2017).
Western blottingCell lysate proteins (30 μg) were separated by SDS-PAGE and transferred to PVDF membranes. Membranes were first blocked in 5% fat-free milk in PBST (Phosphate buffer saline (PBS), 0.1% Tween 20) and then probed with primary antibodies in 1% fat-free milk in PBST. The following antibodies were used with the indicated dilution: anti-APOE (1:2,000, Abcam ab183597), anti-ATG13 (1:1,000, Abcam ab201467), anti-ATP6V1B2 (1 μg/mL, Abcam ab73404), anti-ATP6V0D2 (1:1,000, Sigma-Merck SAB2103221), anti-CTSB (1:500, Sigma-Merck IM27L), anti-CTSK (1:1,000, Santa Cruz sc-48353), anti-CD36 (1:1,000, R&D Systems AF2519), anti-DHCR24 (1:500, Cell Signaling 2033), anti-GPNMB (1:5,000, Abcam ab188222), anti-GRN (1:1,000, Abcam ab187070), anti-LAMP-2 (1:250, Santa Cruz sc-20,004), anti-LAMTOR4 (1:500, Cell Signaling 12,284), anti-LC3 (1:1,000, Sigma-Merck L8918), LGALS3 (1:1,000, Abcam ab190167), anti-mTOR (1:1,000, Cell Signaling 2,983), anti-p-mTOR(Ser2448; 1:1,000, Cell Signaling 5,536), anti-P62 (1:1,000, Abcam ab56416), anti-SPP1 (1:3,000, R&D Systems AF808), Ulk1 (1:1,000, Cell Signaling 8054) and p-Ulk1(Ser757; 1:1,000, Cell Signaling 14,202). Membranes were washed in PBST and incubated with the appropriate HRP-conjugated secondary antibodies (1,5,000) in 1% fat-free milk in PBST. After 5 washes, immunoreactivity was revealed by incubating membranes with the HRP SuperSignal West Femto Maximum Sensitivity Substrate (ThermoFisher Scientific) and the signal was detected by the Chemidoc XRS system (Bio-Rad). Densitometric analysis was performed using the Image Lab software (Bio-Rad) on membranes obtained from 3 biological replicates for each genotype. Proteins amount loading control and normalization was achieved by probing the membranes with α-tubulin (1,4,000, Sigma-Merck T5168) or β-actin (1,10,000, Sigma-Merck A5441) antibodies.
CytometryBV2 WT and mutant cells were recovered by trypsinization and resuspended in DMEM-Ham F-12 (1:1) supplemented with 1% Nutridoma–SP (Roche 11011375,001; lipid free synthetic serum complement) at a concentration of 106 cells/mL. Filipin III (Merck F4767) binding kinetics (256 s) were performed on a LSR II UV flow cytometer (Becton Dickinson) equipped with a 355 nm UV laser line. Emitted fluorescence was filtered by a 450 nm+/−25 nm dichroic mirror. Filipin III (final concentration of 1 μg/mL) was added to the cells after a 60 s-recording of the natural fluorescence baseline. Cells were maintained in a 37°C water bath throughout the experiment.
Electron microscopyTransmission electron microscopy was used to visualize WT and mutant BV-2 cells cultured for 24 h. Cell sample preparation and diaminobenzidine staining to visualize peroxisomes were performed as previously described (Raas et al., 2019a).
ELISABV2 cells were cultured in 6-well plates for 48 h. Cell culture supernatants were subjected to enzyme-linked immunosorbent assay (ELISA) using commercially available ELISA kits to detect cathepsin b (CTSB; Abcam ab119585), osteoactivin (GPNMB; Invitrogen EM59RB), progranulin (GRN; Invitrogen EMGRN), galectin-3 (LGALS3; Invitrogen EMLGALS3) and osteopontin (SPP1; Invitrogen EMSPP1) according to manufacturers’ instructions. Samples were diluted to meet the concentration range of the standard curve. At least three biological replicates for each sample were tested in triplicates and each experiment was repeated at least two times. Osteopontin was quantified in plasma samples (control, AMN, cALD) using Human osteopontin ELISA kit (Invitrogen BMS2066) according to manufacturers’ instructions. Measurements were performed from 1:50 dilution of plasma samples in triplicates and the experiment was repeated twice. Absorbance measurements were performed on TECAN M200 Infinite Pro microplate reader.
Statistical analysesThe different statistical tests which were applied for densitometric analyses of western blotting experiments and ELISA quantifications are indicated in the figure legends.
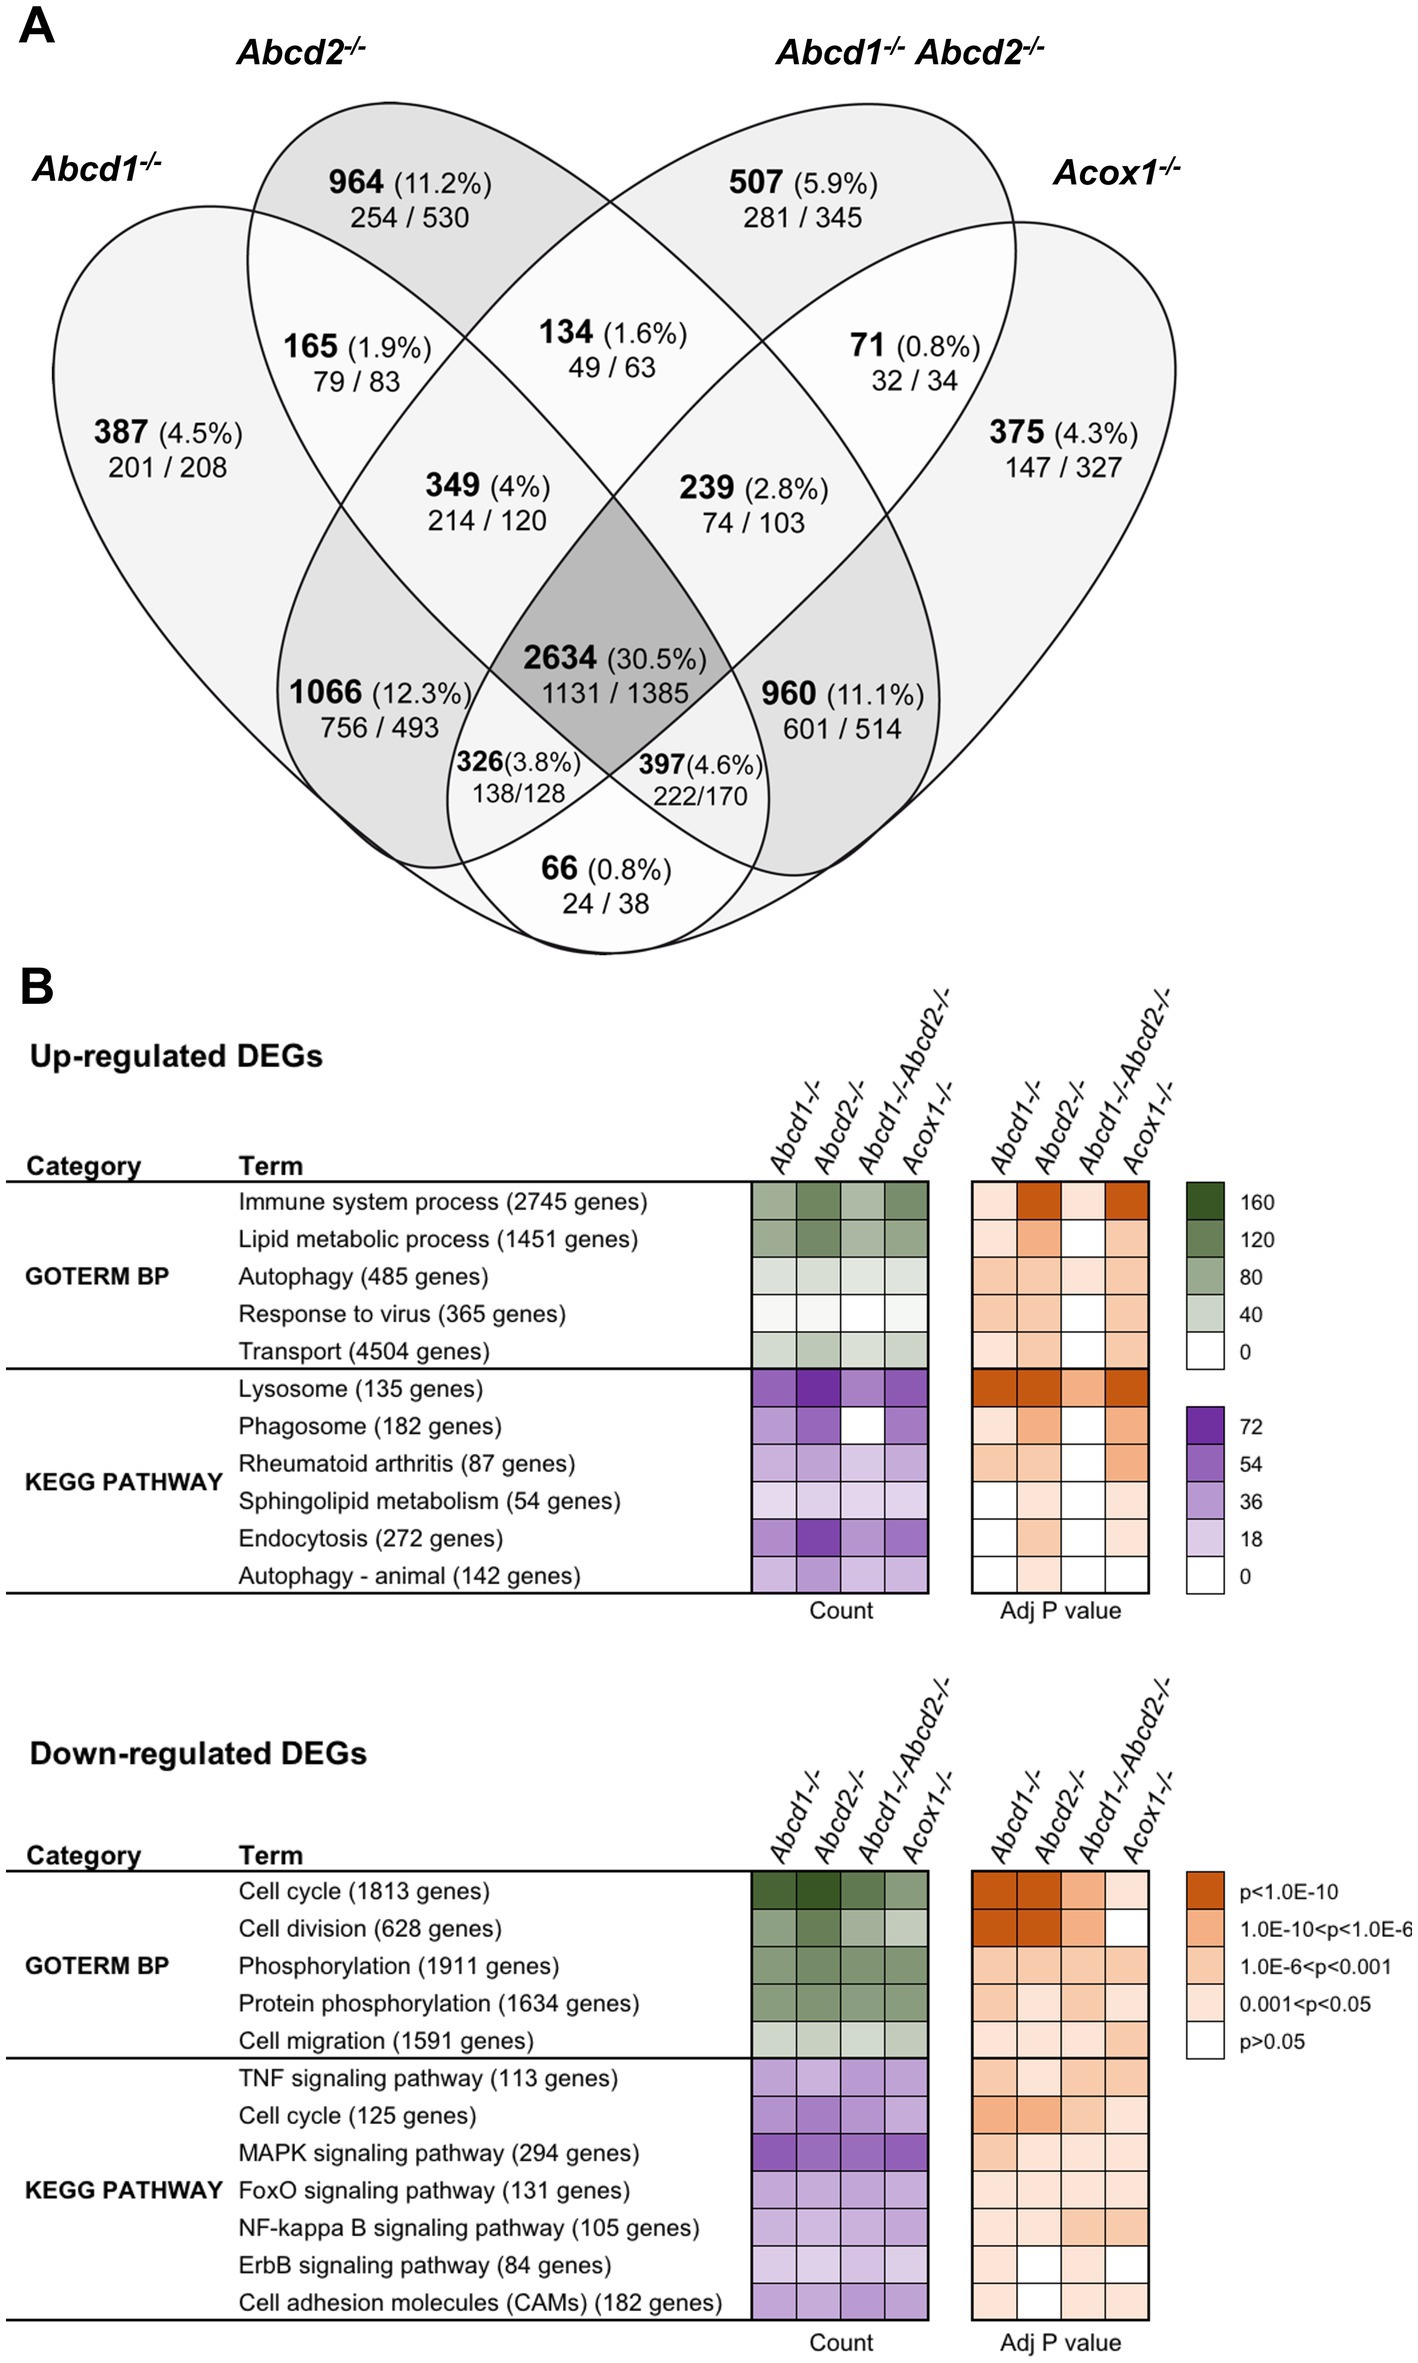
Results Genotype comparisonUsing a cut off adjusted p-value lower than 0.05 and an absolute log2 fold change (log2 FC) higher than 0.58 (1.5-fold induction or repression), we found more than 5,000 genes significantly and differentially expressed for each genotype as compared to the WT cells (Figure 1A). Of these DEGs, a total of 2,634 genes representing about one-third of the total DEGs were shared by each mutant genotype. In the 200 most expressed genes in WT cells, 27 were found differentially expressed in the 4 mutant cell lines. Of note, most of these genes were found associated either with lysosomes (induction of Ctsb, Ctsk, Ctsz, Lamp1, Atp6v1b2, Atp6v1c1, Grn, Psap) or with the DAM signature (induction of Tyrobp (DAP12), ApoE, Gpnmb, Spp1, Grn, Lgals3 and repression of Isyna1). Analysis performed exclusively on the upregulated genes revealed 1,131 genes shared by all mutant cells. Counterpart analysis on the repressed genes revealed 1,385 DEGs.
Figure 1. Differentially expressed genes (DEGs) between mutant and WT cells. (A) Comparative analysis of the sets of DEGs using Venn diagram (n = 3 for each genotype). The significant genes (number and percentage) were selected using a cut off adjusted p-value (DESeq2 Wald test with Benjamini and Hochberg p-value adjustment) lower than 0.05 and an absolute log2 FC higher than 0.58 (higher than 1.5-fold change in both directions) and are indicated in each group [Abcd1−/− (5,390 DEGs: 2765 up, 2,625 down), Abcd2−/− (5,842 DEGs: 2894 up, 2,948 down), Abcd1−/−Abcd2−/− (5,326 DEGs: 2675 up, 2,651 down), and Acox1−/− (5,068 DEGs, 2,369 up, 2,699 down)]. Numbers below correspond to the genes found in each group when the analysis was performed exclusively on upregulated genes (left) or downregulated genes (right). (B) Gene set enrichment analysis in mutant BV-2 cells presenting a selection of the main gene ontology biological process and KEGG pathway terms found in the 4 mutant genotypes. Functional annotation was obtained using DAVID online tools from upregulated and downregulated differentially expressed genes, respectively, in each mutant genotype. Gene count (green for GO Biological process and magenta for KEGG pathway) and Benjamini-corrected p-values are mentioned in color-coded form and available in a source data file. The number of genes contained in each term is indicated.
Single genotypes analysis revealed unique gene expression profile for each genotype. The comparison of genotypes two by two surprisingly indicates a greater overlapping between Abcd2−/− and Acox1−/− cells with 4,230 intersecting DEGs comprising 960 genes DEGs exclusive to these two genotypes (Figure 1A). When we compared the transcriptional profiles of Abcd1−/− and Abcd1−/−Abcd2−/− cells, we observed 4,105 intersecting DEGs including 1,066 DEGs exclusive to these two genotypes. When we look at the transcriptional profiles of mutant cells presenting VLCFA accumulation and supposed to have the most important cellular dysfunction, i.e., Abcd1−/−Abcd2−/− and Acox1−/− (Raas et al., 2019a,b), they showed 3,270 DEGs including 3,025 genes differentially expressed in the same direction (1,375 upregulated and 1,650 downregulated) and 245 genes with a mirror regulation. Only 71 genes were found differentially expressed exclusively in these two genotypes (Figure 1A).
To characterize the enriched biological processes and pathways in our screen, the DEGs were subjected to a functional enrichment analysis using the DAVID online toolkit. A selection of the most enriched terms with Benjamini adjusted p-values (false discovery rate) below 0.05 is presented in Figure 1B. From the gene set enrichment analysis restricted to upregulated genes in mutant cells compared to WT cells, “Immune system process” (GO:0002376) was the most significant enriched GO terms in the four deficient genotypes and was followed by “Lipid metabolic process” (GO:0006629) and “Autophagy” (GO:0006914). When analyzing downregulated DEGs, “cell cycle” (GO:0007049), “Cell division” (GO:0051301), and “Phosphorylation” (GO:0016310) were found most enriched. Enrichment analysis restricted either to upregulated or downregulated genes uncovered significant involvement in Kyoto Encyclopedia of Genes and Genomes (KEGG) pathways (Figure 1B). From the analysis of the upregulated gene sets, “Lysosome” (mmu04142), “Phagosome” (mmu04145), and “Autophagy - animal” (mmu04140) ranked first. Interestingly, “Phagosome” was not found in the Abcd1−/−Abcd2−/− cells illustrating genotype specificities. On the other hand, the analysis of the downregulated DEGs demonstrated a significant enrichment in many signaling pathways related to inflammation control (Figure 1B).
We extended our analysis to Wikipathways 2019 Mouse and Elsevier Pathway collection in order to perform statistical analyses that highlight the biological processes significantly altered as a consequence of gene expression changes. From the 1,131 upregulated genes found in the intersection of the 4 mutant genotypes, “TYROBP causal network” (WP3625; Zhang B. et al., 2013) was the first and most significantly enriched pathway (Adjusted p-value = 0.0101). From the repressed DEGs and gene set enrichment analysis using the Elsevier Pathway collection, “Lipoxins and Resolvins in Inflammation Resolution” (Adjusted p-value = 0.0253) was the most significant hit.
Lipid related genesPeroxisomal defects in cellulo and in vivo are known to affect lipid metabolism in an extensive manner (Lodhi and Semenkovich, 2014). With their ability to interact with diverse organelles, peroxisomes affect both anabolic and catabolic pathways. It leads to the accumulation or defects of various lipid metabolites, which serve as metabolic precursors, signaling molecules impacting membrane and cellular functions, and regulators of transcription factors including nuclear receptors. In the BV-2 microglial cell models, saturated VLCFA accumulation was observed in the Abcd1−/−Abcd2−/− cells and Acox1−/− mutants along with increase in lipid droplets (Raas et al., 2019a,b). Depending on the genotypes, we noticed some modifications of the levels of monounsaturated and polyunsaturated long-chain fatty acids. In addition, we observed cholesterol accumulation in the Abcd1−/− and Abcd1−/−Abcd2−/− cells as well as modifications of oxysterols levels. Whorled lipid inclusions, which likely result from the accumulation of cholesteryl esters of VLCFA, were observed in the Abcd1−/−Abcd2−/− cells. The high rank of the GO term “Lipid metabolic process” in our functional enrichment analysis is in agreement with the observed modifications impacting lipids and reflects a wide reprogramming of lipid metabolism.
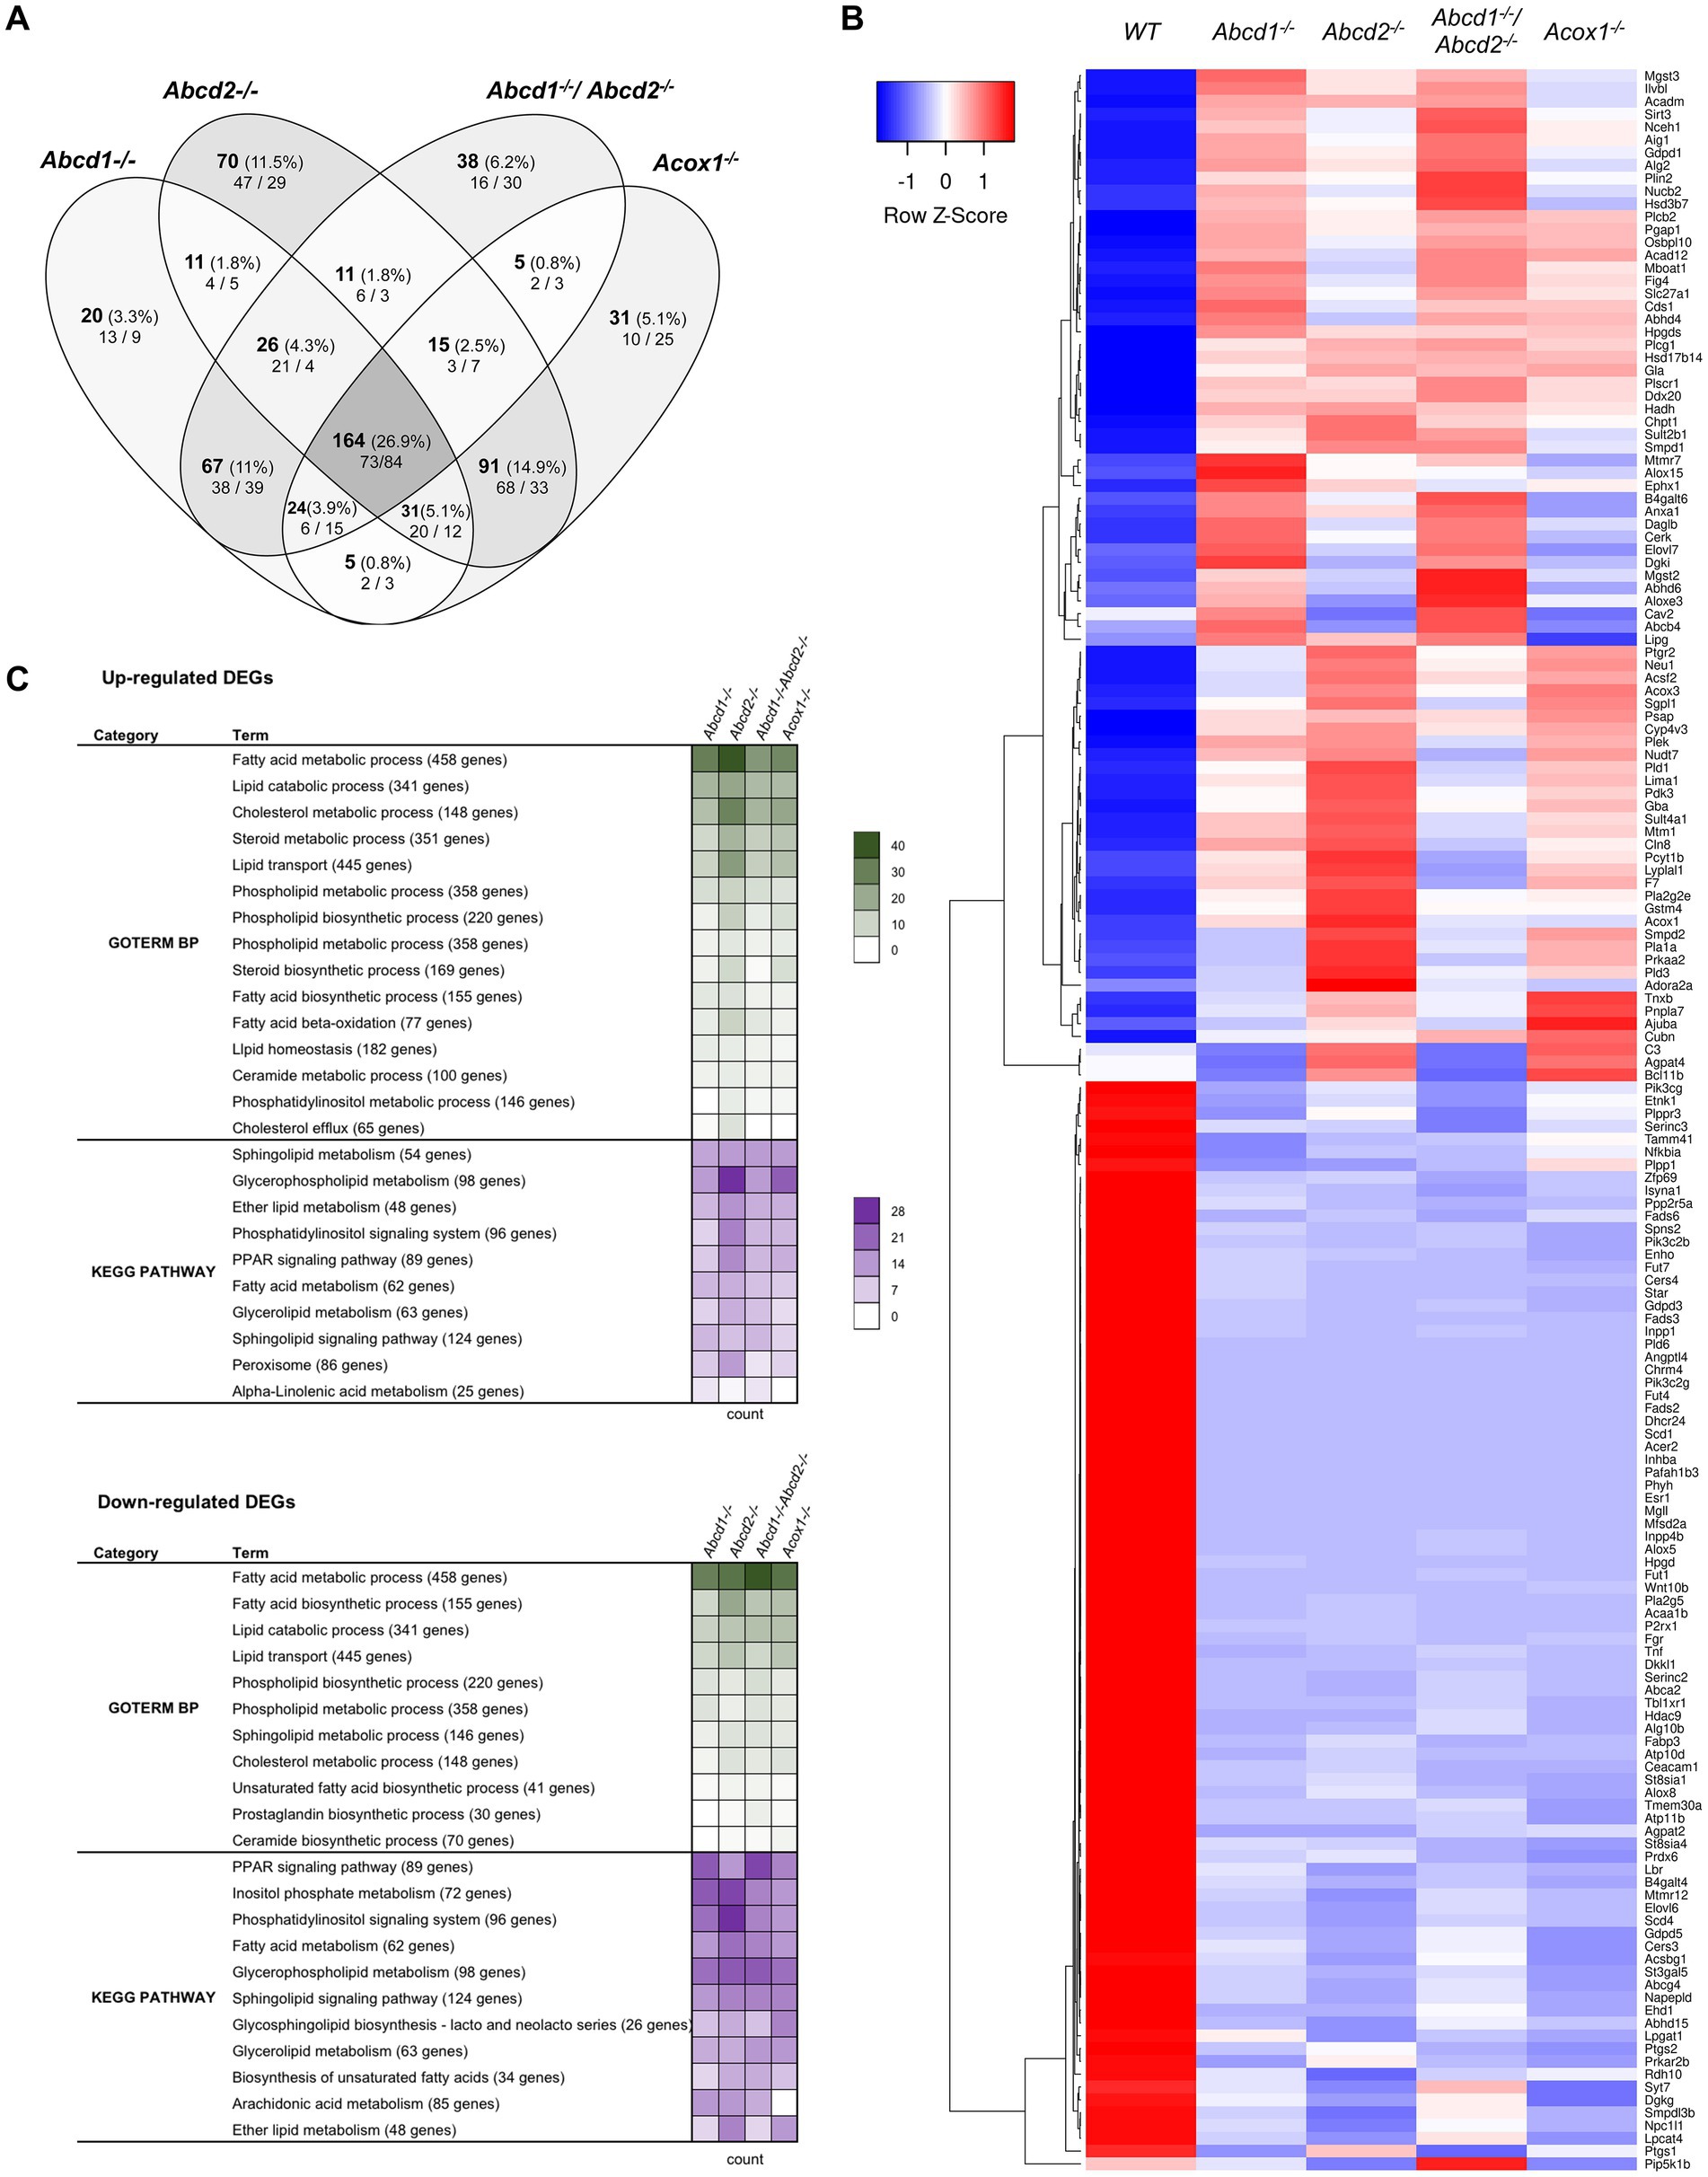
From the 1,190 genes associated with lipid metabolism and expressed in BV-2 cells, a total of 609 genes were found differentially expressed with the chosen cut off (348 for Abcd1−/−, 419 for Abcd2−/−, 350 for Abcd1−/−Abcd2−/−, and 366 for Acox1−/− cells; Figure 2A). Like in the global analysis, Venn diagram demonstrated that the most important group of DEGs (164 genes) belong to the intersection of the 4 mutant genotypes (Figure 2A). The heatmap analysis of these genes indicates a greater overlapping between Abcd2−/− and Acox1−/− cells with 91 DEGs in common, and between Abcd1−/− and Abcd1−/−Abcd2−/− cells with 67 shared DEGs (Figure 2B). MA Plot showed that hits concern both low- and high-expressed genes (e.g., ApoE) while Volcano plot illustrated an equilibrated repartition of DEGs with the most significantly and differentially expressed genes being downregulated (Supplementary Figure 1). A majority of the genes belonging to these pathways were indeed moderately induced or repressed but several genes such as Fads2, Scd1, Acer2, Dhcr24 were found drastically downregulated in every mutant genotype. GO and KEGG pathway enrichment demonstrated an overall modification of the expression of genes associated with lipid metabolism widely impacting fatty acids catabolism and biosynthesis, membrane lipid metabolism, lipid transport, cholesterol metabolism, ether-lipid metabolism, and lipid-related signaling pathways (Figure 2C).
Figure 2. Reprogramming of lipid metabolism in mutant cells. (A) Comparative analysis of the sets of DEGs using Venn diagram (n = 3 for each genotype). From the 1,190 genes associated with the GO term “Lipid metabolic process” and expressed in BV-2 cells, the significant genes (number and percentage) were selected using a cut off adjusted p-value (DESeq2 Wald test with Benjamini and Hochberg p-value adjustment) lower than 0.05 and an absolute log2 FC higher than 0.58 (higher than 1.5-fold change in both directions) and are indicated in each group [Abcd1−/− (348 DEGs: 177 up, 171 down), Abcd2−/− (419 DEGs: 242 up, 177 down), Abcd1−/−Abcd2−/− (350 DEGs: 165 up, 185 down), and Acox1−/− (366 DEGs: 184 up, 182 down)]. Numbers below correspond to the genes found in each group when the analysis was performed exclusively on upregulated genes (left) or downregulated genes (right). (B) Expression-based heatmap showing hierarchical clustering (left) using average linking and Pearson distances based on the 164 DEGs of the intersection between the 4 mutant genotypes (right). Each point corresponds to the Row Z-score collected from the means of the reads normalized and divided by median of transcripts length in kb from 3 independent cell samples for each genotype. (C) Biological processes and gene ontology pathways related to lipid metabolism corresponding to over and under-expressed genes in mutant BV-2 cells. Functional annotation was obtained using DAVID online tools from upregulated and downregulated DEGs in each mutant genotype. A selection of the most represented terms is presented with their number of associated genes mentioned in color-coded form (green for GO Biological process and magenta for KEGG pathway) and available in a source data file. The number of genes contained in each term is indicated.
Fatty acid metabolismWe found many genes belonging to both fatty acid biosynthesis and oxidation pathways (Figures 2B,C; Supplementary Figure 1). Both peroxisomal and mitochondrial catabolic pathways were impacted. Among the peroxisomal β-oxidation genes, the most striking observation was a strong repression of Acaa1b (3-ketoacyl-CoA thiolase B). Genes controlling mitochondrial β-oxidation Cpt2 (carnitine palmitoyltransferase 2), Acads and Acadm (short and medium fatty acyl-CoA dehydrogenase encoding genes respectively), Hadh (hydroxyacyl-CoA dehydrogenase, which plays an essential role in the mitochondrial β-oxidation of short chain FA) were also among the hits (Figure 2B; Supplementary Figure 1). Since VLCFA accumulation is not exclusively related to the β-oxidation defect and may also be associated with an increase in de novo synthesis, we looked at the expression of the Elovl genes encoding FA elongases (Jump, 2009; Kihara, 2012). Elovl6 (elongation of saturated and monounsaturated fatty acids C16:0-CoA or shorter) was found repressed in all mutant cells while Elovl4 (elongation of extremely long saturated FAs and PUFAs > C26) and Elovl7 (elongation of C16–C20-CoA) were induced except in Acox1−/− cells. Elovl7 was among the most significantly upregulated DEGs in both Abcd1−/− and Abcd1−/−Abcd2−/− cells (Figure 2B; Supplementary Figure 1). Elovl1, which encodes for the main enzyme responsible for C26:0 synthesis (Ofman et al., 2010), was found very weakly but significantly induced in all mutant genotypes. Moreover, among the four 3-hydroxyacyl-CoA dehydratase encoding genes involved in VLCFA synthesis (Ikeda et al., 2008), Hacd4 was found upregulated and Hacd3 weakly repressed in every mutant genotype (Supplementary Figure 1). Concerning the acyl-CoA synthetase encoding genes which participate both in biosynthesis and oxidation pathways, Acsbg1 was found repressed, especially in Abcd2−/− and Acox1−/− cells (Figure 2B; Supplementary Figure 1). On the contrary, the genes encoding acyl-CoA synthetase genes for medium-chain (Acsf2 and Acsf3), long-chain (Acsl1), and very long-chain (Slc27a1), were found upregulated (Figure 2B; Supplementary Figure 1).
Unsaturated fatty acid metabolism was in the enriched pathways of mutant cells in accordance with the observed variations in the levels of these fatty acids (Raas et al., 2019a,b). Four stearoyl-CoA desaturases encoded by Scd genes catalyze the rate-limiting step in the production of MUFAs from C16:0 and C18:0. Scd2, the most expressed gene (10-fold more than Scd1), remained unchanged regardless of the genotype. Scd1 expression was considerably reduced in every mutant genotype (Figure 2B; Supplementary Figure 1). Scd3 and Scd4, although poorly expressed in BV-2 cells, were also repressed in every mutant genotype (Figure 2B; Supplementary Figure 1). The high expression level of Scd2 and the substrate specificity shared with Scd1 may explain why total MUFA levels have remained almost unchanged. Concerning PUFAs, the levels of AA and DHA remained unchanged in the Abcd2−/− and Acox1−/− cells but were increased in Abcd1−/− and Abcd1−/−Abcd2−/− cells (Raas et al., 2019a,b). Fads2 encodes for a Δ6-desaturase which is the rate-limiting enzyme of the long-chain PUFA biosynthesis such as arachidonic acid (AA, C20:4, n-6) and eicosapentaenoic acid (EPA, 20:5, n-3) and which controls the last step of desaturation for docosahexaenoic acid (DHA, 22:6, n-3) and docosapentaenoic acid (DPA, 22:5, n-6) synthesis. Paradoxically, Fads2 expression was hugely decreased in the 4 mutant cells (Figure 2B; Supplementary Figure 1). Fads3 and Fads6 genes, which are weakly expressed, were also found repressed in every mutant genotype while Fads1 (the gene encoding a Δ5-desaturase forming AA and EPA) remained unchanged (Figure 2B; Supplementary Figure 1). Mobilization of fatty acids or other lipid derivatives from membrane lipids or triacylglycerols represents a very abundant source of signaling molecules which play a major role in the control of inflammation, especially in the brain (Joensuu et al., 2020). A large number of genes encoding lipases and phospholipases was observed among the hits, most of them being upregulated. A few ones such as Mgll, an important regulator of neuroinflammation in the brain, were strongly repressed (Figure 2B; Supplementary Figure 1). Mgll encodes for the monoglyceride lipase which controls hydrolysis of the endocannabinoid 2-arachidonoylglycerol in the brain generating AA and glycerol (Grabner et al., 2016). Interestingly, the entire pathway leading to produce endocannabinoid arachidonoyl ethanolamine (anandamide), which plays an important role in microglia and brain homeostasis (Tanaka et al., 2020), was found particularly deregulated (induction of Abhd6, Camk2a, Daglb, Faah, and repression of Mgll, Dagla, Alox8, Napepld; Figure 2B; Supplementary Figure 1). Since inhibition of FAAH was shown to be neuroprotective (Tanaka et al., 2020), the observed alterations may contribute to neurodegenerative process in peroxisomal disorders.
Many other phospholipase encoding genes were found among the DEGs indicating that the production of several signaling lipids such as diacylglycerol, inositol-trisphosphate, N-acylethanolamine, or phosphatidic acid is likely affected. Among the Pla2 genes which control the release of unsaturated fatty acids such as AA, a precursor of inflammatory mediators, we observed a repression of Pla2g4c and Pla2g5, as well as an induction of Pla2g2e in every mutant genotype (Figure 2B; Supplementary Figure 1). Pla2g2d and Pla2g7 were induced in Abcd1−/−, Abcd2−/−, and Abcd1−/−Abcd2−/− cells (Supplementary Figure 1). Interestingly, genes involved in AA or DHA metabolism were found deregulated (induction of Aloxe3 and Alox15, repression of Alox5 and Alox8; Figure 2B; Supplementary Figure 1). Among the genes associated with leukotriene metabolism, Ltc4s, Mgts2 and Mgts3 were induced while Lta4h remained unchanged. Genes involved in the synthesis of the prostaglandins were also among the hits. Finally, Tbxa1s, which is responsible for thromboxane synthesis was repressed in Abcd1−/− and Abcd1−/−Abcd2−/− cells (Supplementary Figure 1). In summary, our transcriptional analysis suggests a large modification of the metabolic pathways controlling the levels of pro-inflammatory eicosanoids (leukotrienes and prostaglandins) and anti-inflammatory docosanoids (resolvins) in the mutant microglial cells.
Lipid dropletsLipid droplets play a major role in fatty acid homeostasis and participate actively to the inter-organelle exchanges associated with lipids (Renne and Hariri, 2021). From the preliminary observations in the BV-2 mutant cells showing lipid droplets and lipid inclusions (Raas et al., 2019a,b), modification of the transcriptome associated with lipid droplets was expected. About 40 genes related to lipid droplets were indeed found differentially expressed, a majority being upregulated. Lipid droplets are now considered to be highly dynamic organelles consisting of a core of triglycerides and cholesteryl-esters surrounded by a monolayer of phospholipids and proteins such as perilipins. Among the main actors regulating the generation and the maturation of lipid droplets, we noticed the induction of the perilipin encoding genes, Plin2 and Plin3 (Figure 2B; Supplementary Figure 1). The Rsad2 gene, which encodes for Viperin was the most induced gene of this group. Viperin is localized in the lipid droplets and participates in the antiviral response and in the regulation of lipid synthesis (Hinson and Cresswell, 2009). Concerning the lipid composition of the lipid droplets, the increased labeling of neutral lipids observed by Oil Red O staining in mutant cells (Raas et al., 2019a,b) is likely due to cholesteryl-esters and not triglycerides. The Soat1 and Soat2 genes encoding sterol-O-acyltransferase-2 that produces cholesteryl esters from cholesterol and LCFA or VLCFA were indeed upregulated. Interestingly, Bscl2, which encodes for Seipin, was found significantly repressed but only in Abcd1−/− and Abcd1−/−Abcd2−/− cells and could be associated to the ultrastructure differences concerning lipid droplets observed in the mutant cells (Supplementary Figure 1). Seipin was indeed shown to facilitate contacts between lipid droplets and endoplasmic reticulum and its deficiency was shown to result in lipid droplet size heterogeneity (Salo et al., 2019).
Glycerophospholipids and sphingolipidsPathway analysis of DEGs revealed a strong representation of genes associated with membrane lipids (glycerophospholipids, plasmalogens and sphingolipids). This was particularly true for upregulated DEGs. De novo synthesis of phospholipids from glycerol-3-phosphate to form phosphatidylcholine, phosphatidylethanolamine and phosphatidylinositol and their remodeling consisting of various exchanges of fatty acids are essential for membrane functions (Yamashita et al., 2014). In general, saturated fatty acids are present at the sn-1 position while unsaturated occupy the sn-2 position. Besides their role associated with membrane properties, phospholipids also act as reservoirs for bioactive lipids (eicosanoids, docosanoids, lysophospholipids, anandamides) thanks to the activity of various phospholipases, transacylases or acyltransferases. Many genes of the glycerophospholipid metabolism were found differentially upregulated in the 4 mutant genotypes (Figure 2B; Supplementary Figure 1). We observed a repression of Agpat2 and Plpp1 and upregulation of Cds1 in the mutant cells, genes associated with the formation of phosphatidic acid (Agpat2) and then its conversion to diacylglycerol to yield phosphatidylcholine and phosphatidylethanolamine (Plpp1) or cytidine diphosphate diacylglycerol to yield phosphatidylinositol and cardiolipin (Cds1). Genes encoding phospholipases D which control conversion of phosphatidylcholine or phosphatidylethanolamine into phosphatidic acid, were induced. Genes encoding diacylglycerol kinases phosphorylating diacylglycerol to phosphatidic acid, were differentially expressed (induction of Dgki and repression of Dgka and Dgkg). The phosphatidylcholine pathway appears to be induced since we observed upregulation of Pld1, Pcyt1b, Chpt1, and Lpcat2 (Figure 2B; Supplementary Figure 1). Remodeling of glycerophospholipids and lysophospholipids is also apparently widely affected and differs between the genotypes. For instance, we observed the induction of and Cept1 in Abcd2−/− and Acox1−/− cells. Conversely Agpat4 was repressed in Abcd1−/− and Abcd1−/−Abcd2−/− cells. Many other acyltransferase encoding genes and phospholipid phosphatase encoding genes figured in the DEGs (Supplementary Figure 1).
Sphingolipid metabolism and sphingolipid catabolic processes came out on a high rank in the sorting of gene ontology (Figure 2C). Sphingolipid metabolism has progressively received attention in neurodegenerative diseases and is now considered as a key component of neuroinflammation regulation (Assi et al., 2013; Lee et al., 2020). We observed that a majority of genes related to sphingolipid metabolism were significantly upregulated in the mutant cells (Figure 2B; Supplementary Figure 1). A few genes were downregulated and among them, Acer2, which controls the hydrolysis of long- and very long-chain ceramides and dihydroceramides to yield sphingosine, and Cers4, the ceramide synthase 4 encoding gene (Figure 2B; Supplementary Figure 1). It is noteworthy that the most expressed ceramide synthase encoding genes in BV-2 cells (Cers2, Cers5, Cers6) were not differentially expressed. Some of these results (induction of Smpd1, Cerk, Sphk1, and repression of Acer2, Cers3, Cers4) are in agreement with the transcriptomic data obtained from patient fibroblasts with cerebral or adrenomyeloneuropathy forms of X-ALD showing that the anabolic pathway toward sphingolipids and glycosphingolipids is downregulated (Lee et al., 2019). Concerning glycosphingolipid biosynthesis, many genes belonging to this pathway were repressed and Fut4, which is involved in the synthesis of lactosphingolipids, was among the most downregulated genes (Figure 2B; Supplementary Figure 1).
CholesterolChronic neurodegenerative disorders are increasingly thought to be associated with dysregulation of cholesterol homeostasis in the brain. Enrichment analysis revealed many genes participating to cholesterol metabolism, transport and homeostasis. Trem2, which was found induced in all mutant genotypes, was recently described as a key transcriptional regulator of cholesterol transport and metabolism (Nugent et al., 2020). The expression level of genes encoding the main transcriptional regulators (Srebf1 and Srebf2) was found unchanged. However, a significant but moderate upregulation (Log2FC varying between 0.42 and 0.62 depending on genotypes) of Insig2 was observed in all mutants (Insig1 remaining stable) while Scap was repressed in Abcd2−/− and Acox1−/− cells. In the presence of elevated levels of cholesterol, Insig2 is known to bind SCAP and prevent the proteolytic processing of SREBPs, thereby inhibiting cholesterol synthesis. Nr1h3, which encodes for the oxysterol nuclear receptor LXRα, was also induced. Hdac9, which was shown to repress cholesterol efflux (Cao et al., 2014) was strongly downregulated, especially in Abcd2−/− and Acox1−/− cells. Nfkbia, which is associated with positive regulation of cholesterol efflux was also repressed. This observation is consistent with the discrepancy found between mutant cells showing that cholesterol accumulate selectively in the Abcd1−/− and Abcd1−/−Abcd2−/− cells (Raas et al., 2019a,b).
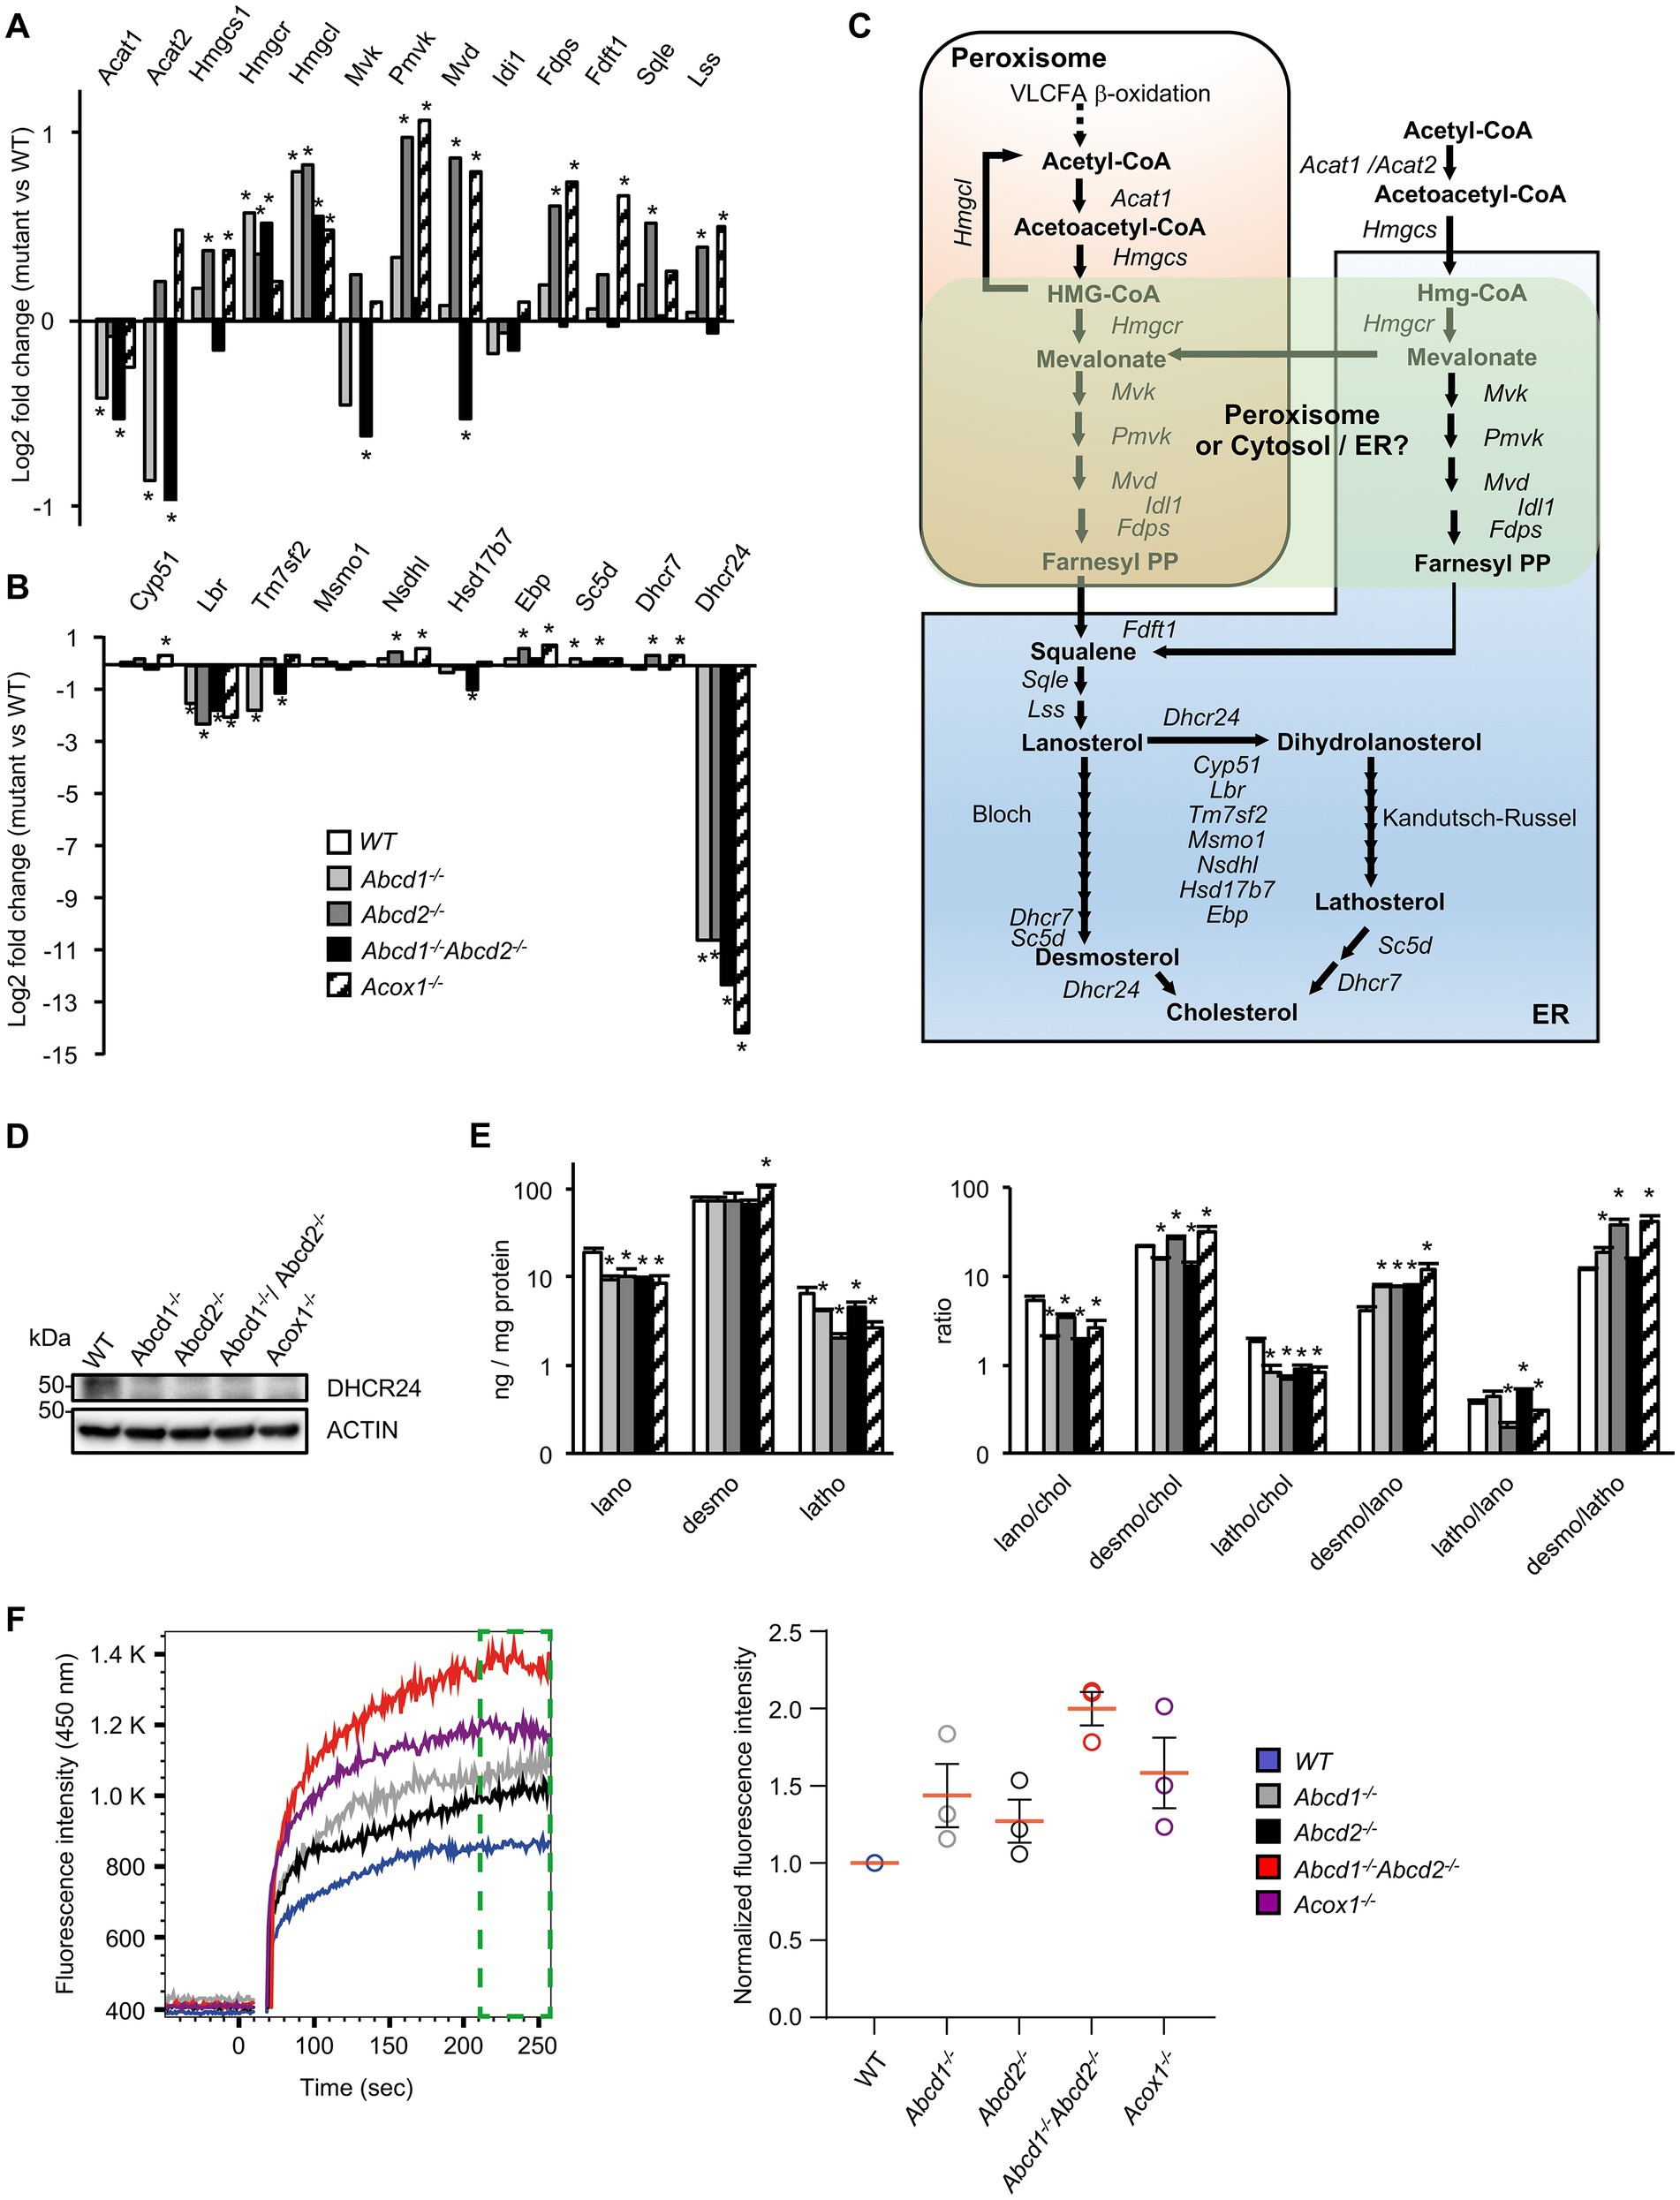
Although many genes of the cholesterol and oxysterol biosynthetic pathways remained quite stable, genes encoding key enzymes of the initial steps of cholesterol synthesis (from acetyl-CoA to lanosterol) were weakly but significantly induced especially in Abcd2−/− and Acox1−/− cells (Figures 2B, 3A,C; Supplementary Figure 1). The involvement of peroxisomes in these initial steps of cholesterol biosynthesis remains controversial with conflicting reports about peroxisomal location of several enzymes such as HMGCR of MVK for instance (Kovacs et al., 2002; Hogenboom et al., 2004a,b; Figure 3C). In the Bloch and Kandutsch-Russell pathways which drives conversion of lanosterol to cholesterol through several steps of reduction, Lbr and Dhcr24 were found repressed in all mutants while Tm7sf2 was repressed only in the Abcd1−/− and Abcd1−/−Abcd2−/− cells (Figures 3B,C; Supplementary Figure 1). Nsdhl and Ebp were weakly induced in the Abcd2−/− and Acox1−/− cells (Figure 3B; Supplementary Figure 1). It is noteworthy that the Kandutsch-Russell pathway (lathosterol pathway) is used for more than 70% of cholesterol biosynthesis in the brain. The expression of Dhcr24, which encodes for the 24-dehydroxycholesterol reductase (also called seladin-1) catalyzing the final conversion of desmosterol into cholesterol in the Bloch pathway but also the exchange between the Bloch and Kandutsch-Russell pathways, was found hugely decreased in every mutant genotype (Figures 2B, 3B; Supplementary Figure 1). Western blotting experiments confirmed the loss of expression of Dhcr24 in mutant BV-2 cells (Figure 3D). Although there was a moderated upregulation of genes of the squalene synthesis pathway, the analysis of the cholesterol precursors revealed an approximately 2-fold decrease in lanosterol content and of the lanosterol/cholesterol ratio in the mutant cells (Figure 3E). The level of lathosterol and the lathosterol/cholesterol ratio were also reduced in the mutant cells suggesting that the Kandutsch-Russell pathway is inhibited. The defect in DHCR24 is associated with a rare autosomal recessive developmental disorder called desmosterolosis characterized by desmosterol accumulation (Waterham et al., 2001). Surprisingly, the desmosterol level remained quite stable except in the Acox1−/− cells (37% increase; Figure 3E). The desmosterol/cholesterol ratio was weakly increased in the Abcd2−/− and Acox1−/− cells and weakly decreased in the Abcd1−/− and Abcd1−/−Abcd2−/− cells in which cholesterol accumulates (Raas et al., 2019a).
Figure 3. Cholesterol metabolism and membrane cholesterol in mutant cells. (A) Differential gene expression between mutant and WT BV-2 cells (n = 3 for each genotype) concerning the genes involved in lanosterol biosynthesis. The histogram represents the log2 FC for each gene based on RNA-seq data. * indicates an adjusted p-value lower than 0.05 (DESeq2 Wald test with Benjamini and Hochberg p-value adjustment). (B) Differential gene expression between mutant and WT BV-2 cells concerning the genes involved in cholesterol biosynthesis from lanosterol (Bloch and Kandutsch-Russell pathways). The histogram represents the estimated log2 FC for each gene based on RNA-seq data. * indicates an adjusted p-value lower than 0.05 (DESeq2 Wald test with Benjamini and Hochberg p-value adjustment). (C) Schematic representation of cholesterol biosynthesis. Enzymatic steps are represented by arrows and the associated genes are indicated. The peroxisomal location of the initial steps of cholesterol biosynthesis remains controversial especially the steps concerning Hmgcr, Mvk, Pmvk, and Mvd (green windows). (D) Western blotting analysis of DHCR4 from cell lysates of WT and mutant BV-2 cells. For densitometric analysis, see Supplementary Figure 3. Source data are available online for this figure. (E) Cholesterol precursors levels in WT and mutant BV-2 cells and their ratio. Gas chromatography mass spectrometry (GC–MS) analysis was performed from cellular homogenates (3 independent experiments). Histograms represent the mean levels of cholesterol precursors (ng/mg protein) with their respective standard deviation and their ratios. Statistical significance at p < 0.05* determined by Mann–Whitney test analysis is indicated. (F) Analysis of cholesterol accumulation in plasma membrane of WT and mutant BV-2 cells. Left panel, Filipin III binding kinetics in living cells recorded by flow cytometry during 256 s. Right panel, median fluorescence intensities calculated from the last minute filipin III binding kinetics (green gate on the left panel) were normalized as a fold of the BV2 WT fluorescence (n = 3 independent experiments).
Once synthetized, cholesterol can be esterified, oxidized, used for steroidogenesis or transported. As cited above, the sterol-O-acyltransferase encoding genes Soat1 and Soat2 were indeed found upregulated. The expression of Agt, which positively regulate cholesterol esterification, was also induced (Figure 2B; Supplementary Figure 1). On the other hand, Nceh1, which catalyzes the hydrolysis of intracellular cholesteryl-esters, was found induced (Figure 2B; Supplementary Figure 1). Several important genes involved in cholesterol trafficking and lipoprotein metabolism such as Apoe and Apoa2, were also found upregulated. Interestingly, APOE is the main cholesterol carrier in the brain and was shown to mediate a switch toward a neurodegenerative phenotype in human microglia in association with TREM2 (Krasemann et al., 2017). Lrp1, which encodes low density lipoprotein receptor-related protein 1, was found induced (Figure 2B; Supplementary Figure 1). Of note, among the triglyceride lipase encoding genes which contribute to lipoprotein degradation (Loving and Bruce, 2020), Lipg was induced except in the Acox1−/− cells, Lipn was induced except in the Abcd1−/−Abcd2−/− cells, and Lipa (lysosomal lipase) was weakly induced in every mutant genotype (Figure 2B; Supplementary Figure 1). Among the ABC transporters associated with cholesterol efflux (Wang et al., 2008), many inductions were observed, suggesting increased efflux of cholesterol but with genotype specificities (Figure 2B; Supplementary Figure 1). Of note, Npc1 and Npc2 genes, which are involved in the transport of LDL-derived cholesterol from lysosomes to the cytoplasm (Saha et al., 2020), were induced in Abcd2−/− and Acox1−/− cells while Npc1l1, although weakly expressed, was repressed in every mutant genotype (Figure 2B; Supplementary Figure 1). The loss of these genes triggers endolysosomal accumulation of unesterified cholesterol and lipids and is associated to Niemann–Pick disease (Vance, 2012). In contrast, the expression of Syt7, which is involved in the contact between peroxisomes and lysosomes and in the cholesterol transport from lysosomes to peroxisomes (Chu et al., 2015), was decreased in every mutant genotype. Star, which transports cholesterol from the outer to the inner mitochondrial membrane and regulates the rate limiting step in steroidogenesis, was repressed in all mutant cells (Figure 2B; Supplementary Figure 1).
To document the consequences of the alterations concerning genes related to cholesterol metabolism and transport, we evaluated the free cholesterol content of the plasma membrane by Filipin III binding kinetics in BV-2 living cells by flow cytometry. We evidenced that Filipin III accumulates more in the plasma membrane of the mutant cell lines compared to BV2 WT cells and in a more pronounced manner in Abcd1−/−Abcd2−/− and Acox1−/− cells (Figure 3F). Excess of free cholesterol in the plasma membrane might originate from either a modification of the equilibrium between ordered versus disordered phases affecting lipid membrane organization or modified exchanges between the cellular compartments or enzymatic conversions (Litvinov et al., 2018).
OxysterolsOxysterol levels were found modified in mutant cells (Raas et al., 2019a) and either oxidative stress or gene regulation may explain this observation. Among the genes involved in oxysterol metabolism (Mutemberezi et al., 2016), only a few genes were deregulated. Ephx1, which encodes for cholesterol epoxide hydrolase and forms dihydroxycholesterol, Hsd3b7, which converts 7α-hydroxycholesterol to 7α-hydroxy-4-cholesten-3-one, and Sult2b1, involved in the formation of sulfoconjugates of 25- and 24-hydroxysterols, were found induced in every mutant genotype (Figure 2B; Supplementary Figure 1). Sult4a1, whose function is unknown was also found induced. Cyp11a1 which encodes for the enzyme catalyzing the synthesis of 22R-hydroxycholesterol was induced in every mutant genotype except Acox1−/− cells (Supplementary Figure 1). CYP46A1 converts cholesterol to 24S-hydroxycholesterol, a transport derivative of cholesterol from the brain to the systemic circulation, allowing cholesterol excess elimination in human brain (Petrov and Pikuleva, 2019). Although its expression level seems to be very low in BV-2 cells, Cyp46A1 was weakly induced in mutant cell lines. The expression level of Cyp27a1 remained unchanged while that of other main cytochrome P450 genes (Cyp7a1, Cyp7b1, Cyp3a4, Cyp3a5, Cyp39a1) and other genes (Ch25h, Sult2a1) involved in oxysterol metabolism were undetectable.
A “disease-associated microglial signature”-like including upregulation of lysosomal and autophagy-related genesLysosome, together with endosome and autophagy, emerged as main terms of gene ontology enrichment analysis (Figure 1B). Moreover, the “Tyrobp (DAP12) causal network” figured in first position of the Wikipathways upregulated in the BV-2 mutant cells. Trem2 and Tyrobp are considered as hub genes for microglial functions and the TREM2-APOE pathway has been shown essential to drive the transcriptional phenotype associated with dysfunctional microglia in neurodegenerative diseases (Jay et al., 2017; Krasemann et al., 2017; Gratuze et al., 2018; Ulland and Colonna, 2018; Deczkowska et al., 2020). Trem2 encodes a membrane receptor for diverse ligands (LPS, phospholipids, glycolipids, lipoproteins and apolipoproteins) playing an essential physiological role in addition to be central in pathological conditions being responsible to the DAM signature (Butovsky and Weiner, 2018). Indeed, TREM2 recruits DAP12/TYROBP to mediate a complex signaling cascade controlling phagocytosis, cell survival, cell differentiation and inflammation (Konishi and Kiyama, 2018). The three hub genes (Apoe, Tyrobp, Trem2) were found significantly induced in the mutant cells (except for Apoe in Acox1−/− cells). Of note, the expression of CD36 which encodes for a FA translocase playing an important role in microglial activation (Stuart et al., 2007) and phagocytosis of myelin debris (Grajchen et al., 2020), was found repressed in Abcd1−/−Abcd2−/− cells and induced in Abcd2−/− and Acox1−/− cells. Microglial dysfunction and lysosomal activity are tightly connected (Gabandé-Rodríguez et al., 2019). In a first step, we therefore focused on lysosome-associated genes and then explored the DEGs in mutant cells with reference to the transcriptomic DAM signature found in microglia in case of neurodegenerative disease.
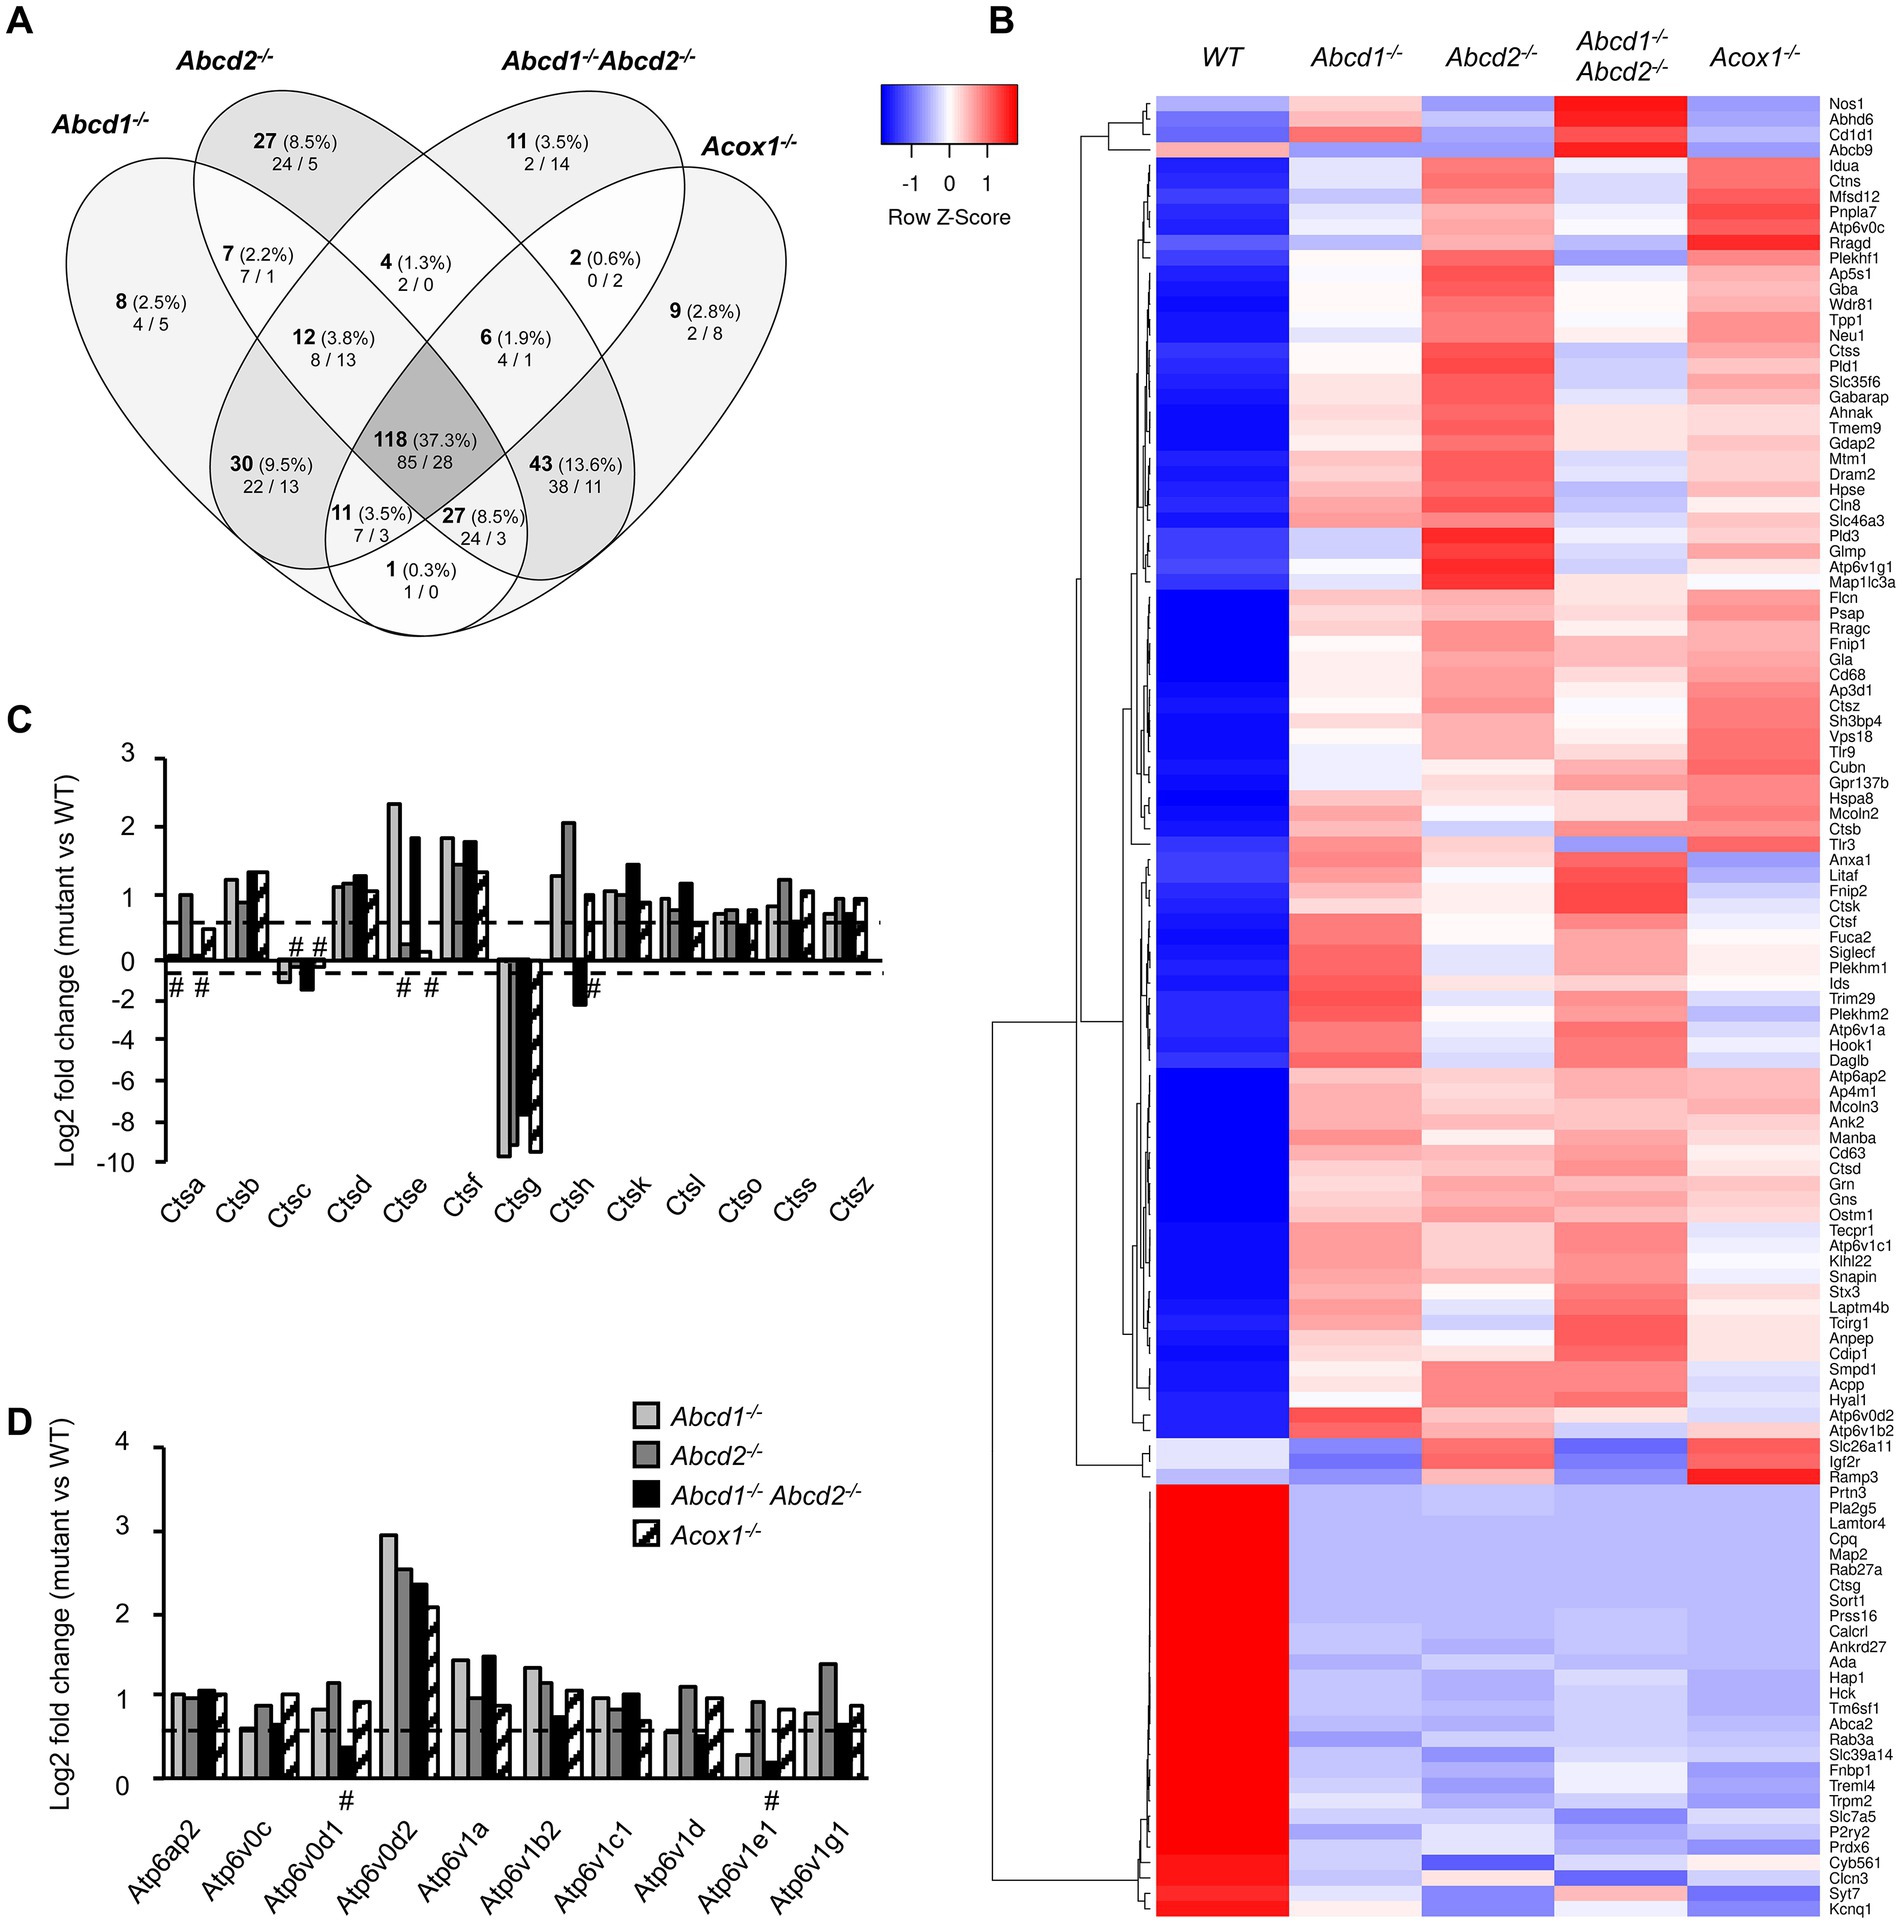
Lysosome and autophagyThe KEGG term “Lysosome” was the first term to come out from upregulated DEGs genes and from global analysis. From the 513 genes associated with the term “Lysosome” (list combined from KEGG and Gene Ontology search) and expressed in BV-2 cells, a total of 316 were found differentially expressed with a majority of upregulated genes (158 in Abcd1−/−, 192 in Abcd2−/−, 130 in Abcd1−/−Abcd2−/−, and 161 in Acox1−/−; Figure 4A; Supplementary Figure 2). Eighty-five genes were found upregulated and 28 downregulated in the 4 mutant genotypes, showing two clustering patterns indicating a higher proximity between Abcd1−/− and Abcd1−/−Abcd2−/− and between Abcd2−/− and Acox1−/− respectively (Figure 4B). Genes involved in metabolism and hydrolysis of various substrates, transport, motility, autophagy, and acidification were found in the hits. Among these genes, Lamtor4, Map2, Pla2g5, Cpq, and Ctsg emerged as the most repressed genes with log2 FC ratio exceeding −8 (Supplementary Figure 2). Of the most expressed DEGs, Apoe, cathepsin encoding genes (Ctsa, Ctsb, Ctsk, Ctsl, Ctsz), Lamp1, Grn, and vacuolar ATPase encoding genes (Atp6v1b2, Atp6v1c1), were all upregulated in mutant cells (Supplementary Figure 2). Noteworthy, Lamp2, although less expressed than the genes above, was also upregulated (Supplementary Figure 2). The expression of Tfeb, which encodes for a transcription factor controlling lysosomal biogenesis (Napolitano and Ballabio, 2016) was not modified suggesting that biogenesis of lysosomes was likely not modified by peroxisomal defect. In contrast, lysosomal metabolic, degradative, and signaling functions appear to be widely affected and mainly activated. In addition, motility and positioning of lysosomes should be affected regarding the virtual knock out of Map2, which encodes for a microtubule-associated protein 2 (Pu et al., 2016), and the induction of Hook1 (Hook microtubule tethering protein 1) and Plekhm2 (SKIP, kinesin-interacting protein). Cathepsins form an important group of proteases in the endosomal-lysosomal compartment and 14 cathepsin genes were found expressed in BV-2 cells. Ctsk and Ctsb, which code for two lysosomal proteins also known to be secreted and play an important role in the brain, particularly in microglia (Dauth et al., 2011; Nakanishi, 2020a), figured in the most expressed cathepsin genes (Supplementary Figure 2). With the exception of the poorly expressed Ctsw gene, cathepsin genes were found mostly upregulated in the mutant cells (Figures 4B,C). We also observed upregulation of all V-ATPase encoding genes expressed in BV-2 cells along with the Atp6ap1 and Atp6ap2 genes which encode accessory subunits involved in V-ATPase regulation (Jansen and Martens, 2012; Figures 4B,D). Western blotting analysis of several lysosomal proteins was performed to confirm the transcriptomic data. Upregulation of both cathepsins B and K and two other lysosomal proteins, progranulin (GRN) and galectin-3 (LGALS3, a cytosolic protein recruited to damaged lysosomes), was observed in the mutant cells (Figure 5A; Supplementary Figure 3). Upregulation of ATP6V0D2 was observed in the mutant cells except in the Abcd2−/− genotype. However, we failed to show increased expression of ATP6V1B2 and LAMP2, except in Abcd1−/− cells for the latter (Figure 5A; Supplementary Figure 3).
Figure 4. DEGs associated with lysosome and autophagy. (A) Comparative analysis of the sets of DEGs using Venn diagram (n = 3 for each genotype). From the 513 genes associated with lysosome and expressed in BV-2 cells, the significant genes (number and percentage) were selected using a cut off adjusted p-value lower than 0.05 (DESeq2 Wald test with Benjamini and Hochberg p-value adjustment) and an absolute log2 FC higher than 0.58 (higher than 1.5-fold change in both directions) and are indicated in each group [Abcd1−/− (214 DEGs: 158 up, 56 down), Abcd2−/− (244 DEGs: 192 up, 52 down), Abcd1−/−Abcd2−/− (194 DEGs: 130 up, 64 down), and Acox1−/− (217 DEGs: 161 up, 156 down)]. Numbers below correspond to the genes found in e
留言 (0)