
記住我


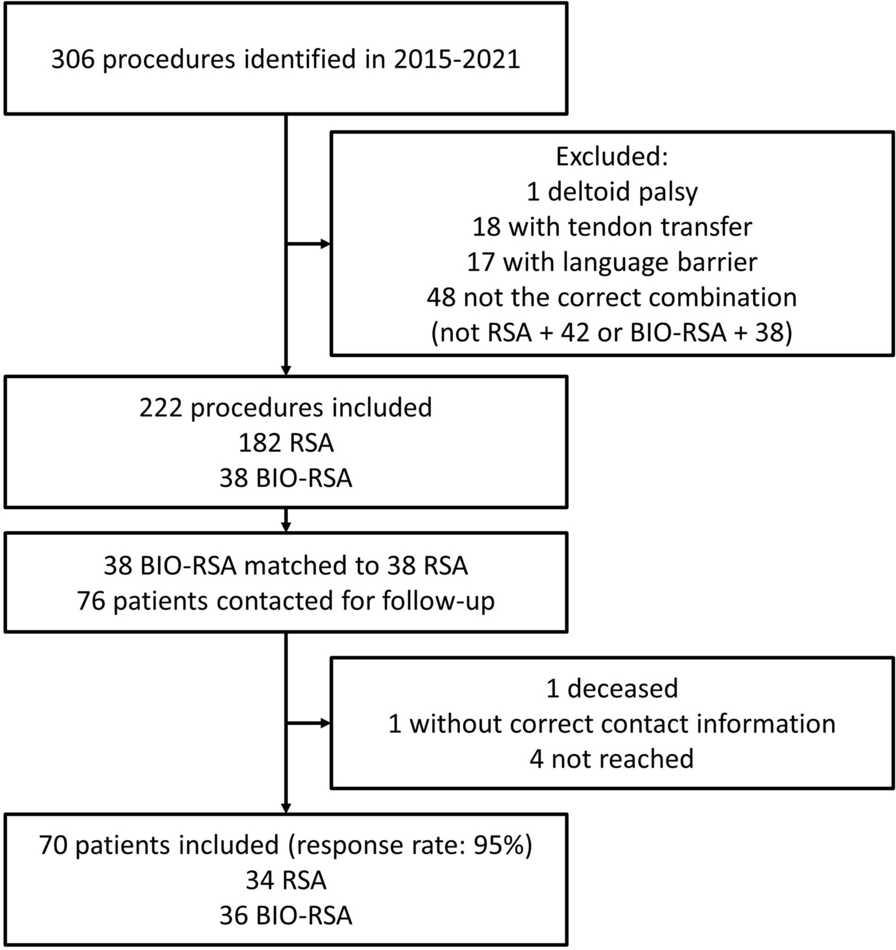


After searching the above databases for all existing studies, we identified 30 records from MEDLINE, 232 from Embase and 123 from CENTRAL. Two additional records were identified from the reference lists of the eligible studies, and five ongoing trials were identified after searching the trial registers and consulting specialists. A total of 392 records were identified, from which 12 duplicates were removed. After screening all the records by titles and abstracts, 358 were excluded. We assessed the remaining 22 full-text articles and excluded 18 records for the below-stated reasons (Fig. 1, Additional file 1 in Appendix 2). Ultimately, four studies were included in the qualitative synthesis and meta-analysis [2,3,4,5].
Fig. 1
PRISMA flow diagram of the study
Study characteristicsThe qualitative systematic review included four studies with 586 patients (302 in the suprapatellar nailing group and 284 in the infrapatellar nailing group) (Table 1) [2,3,4,5]. The included studies were published between 2016 and 2022, and the enrolled sample sizes ranged from 63 to 266. All the included studies compared the outcomes between suprapatellar and infrapatellar intramedullary nailing for distal tibial fractures. All included studies were retrospective cohort studies. The mean age for the two groups in each study was around 30 to 40 years. The follow-up period in these studies was at least 1 year. The outcomes and measurements included pain severity measured with the visual analogue scale (VAS), knee function measured by the Lysholm score, ankle function measured by the American Orthopedic Foot and Ankle Society (AOFAS) score, surgical times, the need for open reduction, and radiologic outcomes, including coronal and sagittal angulations and malalignment rates. The details of the included studies are shown in Table 1.
Table 1 Study characteristicsFracture patterns and details of the surgeryThe details regarding fracture patterns and surgical details are shown in Tables 2 and 3. Three of the included studies used the Müller Arbeitsgemeinschaft für Osteosynthesefragen/Orthopaedic Trauma Association (AO/OTA) fracture classification [12]. The AO/OTA classification describes the fracture in defined terminology according to its location, segment, and complexity (intraarticular or extraarticular). All patients in two of the studies had type 43A fractures (distal tibial extraarticular fractures) only [4, 5], whereas another study enrolled patients with fracture types 43 A/C1/C2 (43C1: simple articular, simple metaphyseal, distal tibial fracture; 43C2: simple articular, multifragmentary metaphyseal, distal tibial fracture) [3]. Concerning fracture location, two studies measured the fracture distance to the tibial plafond [2, 5], one study enrolled fractures within two Müller squares [4], and the fourth study included participants with fractures between the shaft and plafond [3]. Avilucea et al. [2] and Hague et al. [4] reported the ratio of open fractures and concomitant fibular fractures, whereby the incidence of open fractures ranged from 22.2% to 49.6%. The incidence of concomitant fibular fracture ranged from 88.0% to 94.7%, and adjunctive fibular fixation was needed by 3–20%.
Table 2 Fracture characteristics and surgical detailsTable 3 Summary of findingsStudy qualityWe used the NOS scale to assess the quality of the four included studies. All four studies achieved 4 points for proper selection of the intervention and control cohorts. Only one study showed considerable risk in comparability on account of the baseline inequality between the two groups [4]. All four studies scored well in outcome domains. Details of the quality assessment of the studies can be accessed in Additional file 1 in Appendix 3.
Primary outcomesPain level at 1 year following surgeryTwo of the included studies, comprising 195 patients, reported pain levels measured by VAS 1 year after surgery [3, 5]. However, the meta-analysis revealed no significant difference between the two groups with regard to pain level (SMD: − 0.91, 95% CI − 3.21 to 1.39; P = 0.44; I2 = 98%, Fig. 2). We therefore could not conclude whether the SP or IP approach led to better pain reduction in patients with distal tibial fractures. The sumamry of primary outcomes are provided in Table 3.
Fig. 2
Forest plot of pain at 1 year after surgery. There was no significant difference between the two groups concerning the level of pain reduction (SMD: − 0.92, 95% CI − 3.19 to 1.35; P = 0.43; I2 = 98%). MD median difference, CI confidence interval
Function 1 year after surgeryKnee functionTwo studies, comprising 195 patients, reported knee function at 1 year using Lysholm scores [3, 5]. The SP group had a higher Lysholm score than the IP group (MD: 3.90; 95% CI − 0.83 to 5.36; P = 0.007; I2 = 0%, Fig. 3). However, the magnitude of the difference did not reach the minimal clinically important difference (MCID) in the Lysholm knee score [13]. Therefore, we could not conclude that the SP approach afforded better knee function 1 year after the index surgery when compared with the IP approach.
Fig. 3
Forest plot of knee function by Lysholm score 12 months after surgery. The SP group had a higher Lysholm score than the IP group (MD: 3.90 points; 95% CI 0.83 to 5.36; P = 0.007; I2 = 0%). MD median difference, CI confidence interval
Ankle functionTwo included studies, comprising 195 patients, reported ankle function as assessed by the AOFAS score [3, 5]. The SP group had a higher AOFAS score than the IP group (MD: 8.25 points; 95% CI 3.35 to 13.15; P = 0.001; I2 = 91%, Fig. 4). This difference was also clinically significant [14]. We therefore concluded that the SP approach offered clinically better ankle function 1 year after the distal tibial fracture surgery than the IP approach.
Fig. 4
Forest plot of ankle function assessed by the AOFAS score 12 months after surgery. The SP group had a clinically significantly higher AOFAS score than the IP group (MD: 8.25 points; 95% CI 3.35 to 13.15; P = 0.001; I2 = 91%). AOFAS American Orthopedic Foot and Ankle Society, MD median difference, CI confidence interval
Secondary outcomesDegrees of angulationThree of the included studies, comprising 523 patients, assessed the radiologic outcome following surgery [2, 4, 5]. All used a digital imaging system. As regards coronal alignment, the result of the meta-analysis revealed that IP had more degrees of coronal angulation than SP (MD: − 2.09°, 95% CI − 2.47 to − 1.71; P < 0.001; I2 = 75%, Fig. 5a). However, as regards sagittal alignment, there was no significant difference between the two groups in the degrees of sagittal angulation (MD: − 1.40°, 95% CI − 3.43 to 0.64; P = 0.18; I2 = 99%, Fig. 5b). We therefore concluded that SP provided a better outcome in regard to coronal angulation than IP. The sumamry of secondary outcomes are provided in Table 3.
Fig. 5
Forest plots of a coronal angulation and b sagittal angulation. Compared to SP, IP had greater coronal angulation (MD: − 2.09°; 95% CI − 2.47 to − 1.71; P < 0.001; I2 = 75%) but similar sagittal angulation (MD: − 1.40°; 95% CI − 3.43 to 0.64; P = 0.18; I2 = 99%). CI confidence interval, MD mean difference
MalalignmentAll of the included studies, comprising 596 patients, assessed the radiologic alignment following surgery [2,3,4,5]. Three included studies defined malalignment as > 5° of angulation in the coronal or sagittal plane. One study reported coronal and sagittal malalignment separately. After a discussion, we chose the worst scenario for each group and subjected it to meta-analysis. The meta-analysis showed that SP nailing had a lower risk of postoperative malalignment than IP nailing (OR: 0.22, 95% CI 0.06 to 0.75; P = 0.02; I2 = 77%, Fig. 6). Taking the IP group with a risk of malalignment of 26.1% as the reference, the NNT for malalignment was 6 (95% CI 5 to 20) [2].
Fig. 6
Forest plot of the malalignment. The SP group had a lower risk for postoperative malalignment than the IP group (OR: 0.22; 95% CI 0.06 to 0.75; NNT: 6 (95% CI 5 to 20); P = 0.02; I2 = 77%). CI confidence interval, NNT number needed to treat, OR odds ratio
Surgical detailsThree of the included studies, comprising 461 patients, reported the need for open reduction [2, 3, 5]. The pooled result revealed that SP nailing had a lower risk of the need for open reduction than IP nailing (OR: 0.58, 95% CI 0.35 to 0.97; P = 0.04; I2 = 0%, Fig. 7). The NNT of the need for open reduction was 16 (95% CI: 10 to 233), taking the IP group with 17.2% as the reference [2]. One episode of open reduction could be prevented for every 16 patients treated with SP nailing. Fracture reduction seemed easier in the SP group than in the IP group. Hence, the SP group also had a shorter surgical time than the IP group (MD: − 15.14 min, 95% CI − 21.28 to − 9.00; P < 0.001; I2 = 59%, Fig. 8).
Fig. 7
Forest plot of the need for open reduction. The SP group had a lower risk for open reduction than the IP group (OR: 0.58; 95% CI 0.35 to 0.97; NNT: 16 (95% CI 10 to 233); P = 0.04; I2 = 0%). CI confidence interval, NNT number needed to treat, OR odds ratio
Fig. 8
Forest plot of the surgical time. The SP group had a shorter surgical time than the IP group (MD: − 15.14 min; 95% CI − 21.28 to − 9.00; P < 0.001; I2 = 59%). CI confidence interval; MD mean difference
ComplicationsNone of the included studies reported this outcome.
Subgroup analysisDue to the limited study number, we were unable to perform subgroup analyses.
留言 (0)