
記住我


Females of multiple mammalian species, including mice, rats, and humans, are better protected from sensorineural hearing loss (SNHL). Females also have enhanced supra-threshold peripheral auditory processing independent of hearing loss (Balogová et al., 2018; Milon et al., 2018; for review, see Lin et al., 2022) which has been recorded using auditory brainstem responses (ABRs). Indeed, females were found to have higher wave I amplitudes in mice (Milon et al., 2018), rats (Balogová et al., 2018), and humans (Kjær, 1979, 1980; Wharton and Church, 1990). Most of these previous studies show that females have higher amplitudes in later waves (i.e., higher-order auditory nuclei), thus the cochlear nerve is not the only location in the auditory processing pathway for this sex difference. Still, our current study focuses on potential sex effects at the level of the auditory nerve (wave I). ABR wave I is a measure of the response of multiple afferent fibers in the auditory nerve to sound, so larger ABR wave I amplitude suggests that females have greater synchrony of spiral ganglion neuron (SGN) afferent fibers or recruitment of more SGNs of a specific population at higher sound levels (Young et al., 2021). While sex hormones including estradiol and testosterone modulate auditory afferent synchrony in fish (Sisneros et al., 2004) and mice (Shuster et al., 2021), the underlying molecular mechanism of the sex difference in peripheral auditory processing in healthy inner ears of female and male mammals remains almost entirely unexplored. Understanding how healthy peripheral auditory systems differ between males and females is essential for tailoring specific hearing loss treatments and maintaining optimal auditory processing in both biological sexes.
Fast excitatory transmission of information about sound between cochlear inner hair cells and SGN afferents is mediated by α-amino-3-hydroxy-5-methyl-4-isoxazole propionic acid receptors (AMPARs; Puel et al., 1991; Ruel et al., 1999, 2000; Glowatzki and Fuchs, 2002; Sebe et al., 2017). The larger wave I amplitude in females could result, at least in part, from SGNs that are more synchronous due to more temporally precise AMPAR-driven excitatory postsynaptic currents (EPSCs). AMPARs are tetramers assembled as dimers of dimers (Rosenmund et al., 1998; Tichelaar et al., 2004). In the mature cochlea, SGNs express GluA2, GluA3, and GluA4 subunits (Niedzielski and Wenthold, 1995; Matsubara et al., 1996). AMPARs can affect the speed of postsynaptic depolarization by changes in overall expression level that affect current density, or by changes in subunit relative abundance that affect channel permeability and gating kinetics (Trussell, 1997, 1999). AMPAR subunits influence channel permeability to sodium and calcium, and the gating kinetics of the channel is determined by the flip-and-flop splice variants (Mosbacher et al., 1994). Each AMPAR subunit occurs in two possible isoforms, flip and flop, depending on the splicing of a segment in the mRNA sequence that encodes the protein region just before the fourth transmembrane domain (Sommer et al., 1990; Dingledine et al., 1999). Subunits of the alternatively spliced flop isoform have faster gating kinetics than the flip isoform, especially Gria3 and Gria4 (Mosbacher et al., 1994). We hypothesized that sex differences in SGN synchrony result, at least in part, from differences in the speed and reliability of synaptic transmission due to differences in the expression of AMPAR subunits and their splice variants in females and males.
This study sought to determine whether differential expression of AMPAR subunits could contribute to the underlying sex difference in ABR wave I amplitude, indicating higher SGN synchrony in C57BL/6J female mice. To test our hypothesis, we used in situ hybridization to quantify Gria2, 3, and 4 mRNA levels in type I SGNs from the basal, middle, and apical cochlear regions. In addition, we quantified the relative abundances of flip and flop mRNA isoforms for each subunit with RT-qPCR. Our study shows that females have larger ABR wave I amplitude, confirming this sex difference in C57BL/6J mice. Females also had more overall AMPAR mRNA, in particular Gria3 flop. We conclude that of the three AMPAR subunits in the mature cochlea, Gria3 has the greatest potential to mediate the difference in wave I amplitude between females and males.
Materials and methods AnimalsA total of eighty-five C57BL/6J mice were used in this study. Auditory brainstem response (ABR) experiments were conducted on a cohort of mice with an average age of postnatal day 37 (P37, range = 34–40; female n = 17, male n = 13), and a cohort with an average age of P60 (range = P57–P73; female n = 10, male n = 13). Throughout the remainder of the study, these mice will be referred to as the P37 and P60 cohorts, respectively. For in situ hybridization (female n = 4, male n = 4) and RT-qPCR (female n = 12, male n = 12), mice were aged P34–50. C57BL/6J mice in these age ranges are sexually mature (Bell, 2018). ABR data were collected on two sexually mature age cohorts to ensure that the sex difference in ABR wave I amplitude was maintained in the age ranges used for in situ hybridization and RT-qPCR. C57BL/6J mice were used in this study because they are the most commonly used strain for genetic modifications. We wanted to establish this sex difference in WT C57BL/6J mice for potential future experiments examining the mechanisms of this sex difference in genetically modified mice. The age range of the C57BL/6J mice used in this study is before the age where early-onset age-related hearing loss has been previously documented in this strain, which was P100 for high frequencies beyond the age range used in this study (Henry, 2002), and P150 for a broadband threshold shift (Henry, 2004). Mice were housed in a room with ambient noise levels averaging 15–20 dB SPL (unweighted mean SPL, 3 kHz–90 kHz, Sensory Sentinel, Turner Scientific), and a 12-h light/12-h dark daily photoperiod. Mice were fed ad libitum. All procedures were carried out in accordance with the National Institute of Health Guide for the Care and Use of Laboratory Animals and were approved by the University of Pittsburgh Institutional Animal Care and Use Committee.
Auditory brainstem responsesAuditory brainstem responses (ABRs) were recorded and analyzed in a similar protocol to that used by Clarkson et al. (2016) and García-Hernández et al. (2017). However, the sound was presented in the open field in this study. Recordings were done in a Faraday cage in a sound attenuation chamber. During ABR experiments, mice were continuously anesthetized with 1.5% isoflurane in oxygen, and body temperature was kept constant via isothermal heat pads. The hydration and internal temperature of the mice were not measured; however isothermal heat pads were heated under similar conditions for each experiment. Thus, the external environment was controlled between mice. The speaker was calibrated in the chamber using a microphone (PCB electronics, model no. 377C01, Depew, NY) placed 10 cm from the multi-field magnetic speaker (MF1, Tucker-Davis Technologies (TDT), Alachua, FL), which was the same distance as the mouse’s external ear to the speaker during experiments. Broadband click and pure tone burst stimuli (4, 8, 12, 16, 24, and 32 kHz) were presented in the open field. For clicks, stimuli were presented for 0.1 ms starting at 90 dB and decreased to 10 dB in 5 dB steps, while pure tone stimuli were presented for 5 ms (2.5 ms linear rise/fall time with no plateau) at 90 dB and decreased to 20 dB in 10 dB steps. All stimuli were presented at 21 sweeps/s (i.e., stimulus period = 47.619 ms). Subdermal electrodes were placed on the vertex of the skull (recording electrode), ipsilateral (right) ear mastoid through the cheek (reference electrode), and contralateral (left) ear mastoid through the cheek (ground electrode). All ABRs were recorded in 10 ms increments. Incoming signals were digitized and recorded using a RA4LI headstage, RA4PA preamplifier/digitizer, and RZ6 signal processor (TDT). Data were collected in real-time using PC interface BioSigRZ software (TDT). All recordings were averaged over 512 sweeps and were band-pass filtered from 300 to 3,000 Hz. ABR click and pure tone threshold were operationally defined as the lowest stimulus level at which ABR waveforms could be visualized. Wave I latencies and amplitudes were calculated from click ABR recordings. Latency of wave I was defined as the time from the onset of the stimulus to the peak of wave I in ms, and wave I amplitude was defined as the peak of wave I to the subsequent trough in μV.
In situ hybridizationMice were anesthetized via intraperitoneal injection with a mixture of ketamine (60 mg/kg) and xylazine (6.5 mg/kg) and transcardially perfused with 0.1 M phosphate buffer (PB) followed by 4% paraformaldehyde (PFA) in 0.1 M phosphate-buffered saline (PBS) in RNAse-free water. Cochleae were carefully removed and perilymphatically perfused with 4% PFA in 0.1 M PBS and then immersion fixed for 1–3 h on ice. Immediately following immersion-fixation, cochleae were moved to 10% EDTA in 0.1 M PBS and gently agitated overnight at 4°C for decalcification. The next morning, cochleae were washed in 0.1 M PBS, serially dehydrated in 10%, 20%, and 30% sucrose in 0.1 M PBS, and frozen on dry ice in molds with tissue freezing medium (Electron Microscopy Sciences, Hatfield, PA), and stored at −20°C for one month. The right cochlea of each mouse was sectioned at 12 μm thickness using a cryostat. Four sections were adhered per slide in series and stored at −80°C for 6 months prior to in situ hybridization.
Each in situ hybridization experiment used slides from at least one male and one female. Slides were chosen for each experiment in an attempt to control for equal numbers of SGNs per mouse at each cochlear region. In situ hybridization was carried out using probes, amplifiers, and fluorescent dyes from the RNAscope multiplex fluorescent assay developed by ACDBio (Newark, CA). This included probes for Gria2 (cat. no. 416091-C2), Gria 3 (cat. no. 426251-C3), and Gria4 (cat. no.422801-C1) as well as a kit necessary for amplification and labeling steps (RNAscope Multiplex Fluorescent Reagent Kit v2, cat. no. 323100). The probes do not differentiate between the flip and flop isoforms of each subunit. Probe specificity was validated in each experiment by including a slide that was incubated with a positive control probe mixture (3-Plex positive control probe, cat no. 320881), and a slide that was incubated with a negative control probe mixture (3-Plex negative control probe, cat no. 320871) in each experiment. Due to the limitations of the assay, only two RNA probes were targeted in each experiment. Therefore, in half of the experiments, Gria2 and Gria3 were targeted in tandem, while in the other half, Gria2 and Gria4 were targeted in tandem. Gria2 was targeted in every experiment both to serve as a control between experiments and to allow for calculating the index of Gria3 and Gria4 relative to Gria2 mRNA in individual SGNs (see Section “Statistical analysis” below). In all experiments, the Gria2 probe was labeled with Opal 690 dye, while Gria3 and Gria4 were labeled with Opal 570 dye (Akoya Biosciences, Marlborough. MA, cat. no. FP1497001KT and FP1488001KT, respectively). Following hybridization, amplification, and labeling, slides were mounted in ProLong Gold with DAPI (Invitrogen, Eugene, OR, cat. no. P36931), cover-slipped, and stored at 4°C away from light for up to one month prior to confocal imaging.
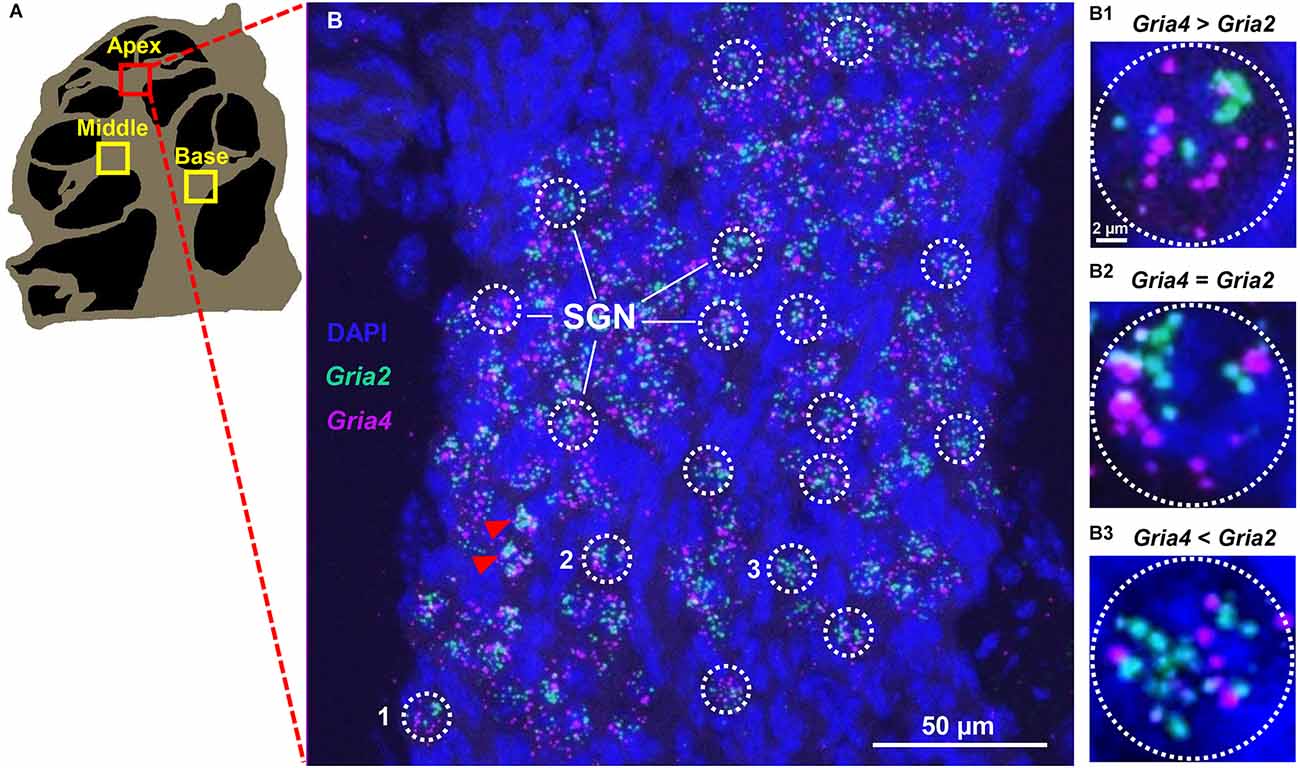
Confocal imaging and fluorescence puncta quantificationAll slides were imaged with a Nikon A1 confocal inverted stage microscope (Nikon Instruments, Inc.) at the University of Pittsburgh Center for Biologic Imaging. DAPI, Opal 570, and Opal 690 were imaged simultaneously from lasers with excitation/emission spectra filters set at 405/425–475, 561/570–620, and 640/663–738 nm, respectively with a 40× 1.3 NA oil immersion lens and pinhole set to 1 airy unit. Images were collected in z-stacks of 0.25 μm increments using NIS Elements software (Nikon). Image stacks were combined into one z-projection containing all three fluorescence channels using Image-J. Opal 690 (Gria2) puncta were pseudo-colored to green, Opal 570 (Gria3 or Gria4) puncta were pseudo-colored to magenta, and DAPI remained blue (see Figure 1). ROIs (approximately 12 μm in diameter) for puncta counts were defined as separate type I-like SGNs, which were identified in each image by the presence of opal 690 (green) and opal 570 (magenta) puncta clustered around large DAPI-stained nuclei (see Figure 1). To ensure that clusters of transcript puncta were segregated to one SGN, we spot-checked multiple z-stacks for each cochlea to ensure that there was no overlap of SGNs in the z-plane. Amounts of Gria3 or Gria4 and Gria2 puncta were manually counted in individual SGNs semi-quantitatively: green and magenta puncta were counted separately using the Image-J point tool. On rare occasions, puncta were observed in large clusters where individual puncta could not be distinguished. Puncta with diameters exceeding 14 pixels were considered clustered, and these SGNs were excluded from the analysis, similar to the methods in Balaram et al. (2019). Puncta with diameters less than 2 pixels were considered noise and were not counted within SGNs. Gria2 and Gria3 counts are likely under-reported because these subunits tended to cluster the most. However, only up to four SGNs per image (out of over 30 in most images) were excluded from the analysis, and many of those images spot-checked (18 out of 30) had no clustering. See red arrowheads in Figures 1B, 3A for examples of SGNs that were excluded due to clustering. The intensity of puncta fluorescence was not considered in the analysis. On average, puncta from 30 SGNs were quantified per image. Throughout all experiments, four-six slides containing four cochlear sections each were probed per mouse. All fluorescence analysis was performed by observers blind to the sex of the animal.
Figure 1. Specific expression of Gria2 and Gria4 mRNA puncta on SGN. (A) A computer-generated sketch of a cochlear section through the modiolus. The spiral ganglion (indicated with squares) is located on the modiolar side of sensory epithelia and contains a group of neuron cell bodies (the spiral ganglion neurons, SGNs). (B) A representative maximum-intensity projection of a confocal stack of images of SGNs of the apical cochlea turn of a male mouse with mRNA signal for Gria2 (green) and Gria4 (magenta), and DAPI nuclei staining (blue). The mRNA signal for Gria2 and Gria4 is observed as puncta grouped around large DAPI nuclei. ROIs (white dotted line circles) correspond to individual SGNs. Red arrowheads point to SGNs that were excluded due to puncta clustering. (B1–3) High magnification of the three SGNs (1, 2, and 3) containing different ratios of Gria2 and Gria4 puncta. In (B1), the SGN has more Gria4 puncta than Gria2. In (B2), the SGN has equal amounts of Gria4 puncta and Gria2. In (B3), the SGN has less Gria4 puncta than Gria2. See Section “Methods” and Figure 6 for details of the quantitative analysis.
Quantitative reverse transcription-polymerase chain reactionMice were anesthetized with isoflurane and euthanized via cervical dislocation and decapitation. Immediately following decapitation, the cranium was opened. The inner ears were removed, flash-frozen in liquid nitrogen, and stored at −80°C for up to one month until reverse transcription-polymerase chain reaction (RT-PCR). In preparation for RT-PCR, both inner ears from each mouse were homogenized by hand with mortar and pestle and RNA was extracted with Trizol (Ambion by life technology). The pellet was resuspended and the supernatant containing RNA from each inner ear (including auditory and vestibular tissue) was prepared for RT- PCR using the SuperScript Strand Synthesis System kit (Invitrogen, cat. no. 11904018). The resulting cDNA was stored at −20°C for 1 week or less prior to quantitative PCR (qPCR). qPCR was performed at the Genomics Research Core at the University of Pittsburgh using EvaGreen qPCR kit (MidSci, Valley Park, MO, cat. no. BEQPCR_R) and DNA primers for Gria2, Gria3, and Gria4 flip and flop, which were the same primers used successfully in a previous RT-qPCR experiment by Hagino et al. (2004); see Table 1 in this reference for sequence information. In a 25 μl PCR reaction mixture, 2 μl cDNA samples were amplified in a Chromo 4 detector (MJ Research, Waltham, MA). GAPDH and 18S rRNA were used as housekeeping genes. Each sample (consisting of cDNA product of both cochleae from each mouse) was run in triplicate, and average cycle thresholds (CTs) were used for quantification. Relative abundances of each splice isoform for males compared to females were calculated using the following equation: 2−ΔΔCT, where ΔΔCT = (CTMale − CTGAPDH or CT18S rRNA) − (CTFemale − CTGAPDH or CT18S rRNA). For a more in-depth explanation of this equation see Schmittgen and Livak (2008).
Statistical analysesAll statistical tests were calculated using GraphPad Prism or IBM SPSS software. ABR thresholds, wave I latency and wave I amplitude were compared between males and females using separate two-way mixed ANOVAs for P37 and P60 mice. For comparisons of click wave I latency and wave I amplitude, the within-subjects independent variable (IV) was sound level (90–50 dB in 5 dB increments). In contrast, for ABR thresholds the within-subjects IV was sound frequency (click, 4, 8, 12, 16, 24, and 32 kHz). For these two-way mixed ANOVAs, the between-subjects IV was sex. For latency and amplitude, linear regressions were calculated to compare the slope of ABR wave I latency or amplitude as a function of sound level between males and females of P37 and P60. For wave I amplitude slopes, Tukey pairwise comparisons were calculated between each group.
For RNAscope mRNA quantification data, three separate two-way ANOVAs were conducted to compare Gria2, 3, and 4 mRNA quantities between males and females (IV1, sex) in the basal, middle, and apical cochlear turns (IV2, region). To quantify possible differences in the expression of Gria2 vs. Gria3 and Gria2 vs. Gria4 in individual SGNs, we calculated a Gria3/2 and Gria4/2 index with the following equation, derived from Balaram et al. (2019): (Gria3 or Gria4 − Gria2)/(Gria3 or Gria4 + Gria2). A positive-value index means that a SGN has more Gria3 or Gria4 relative to Gria2; a value of zero means that Gria3 or Gria4 and Gria2 puncta levels in a SGN are equal; and a negative value means that a SGN has more Gria2 puncta relative to Gria3 or Gria4. The indices were then compared across cochlear regions and sex using separate two-way ANOVAs for each index. Due to the nature of our experimental design, we planned to investigate sex differences of Gria2, 3, and 4 mRNA counts and Gria3/2 and Gria4/2 indices in each separate cochlear region. Therefore, we conducted independent samples t-tests for comparisons of these measures between the sexes in each cochlear region a priori.
For RT-qPCR data, separate independent samples t-tests were conducted between males and females to compare flip and flop relative abundances for Gria2, 3, and 4.
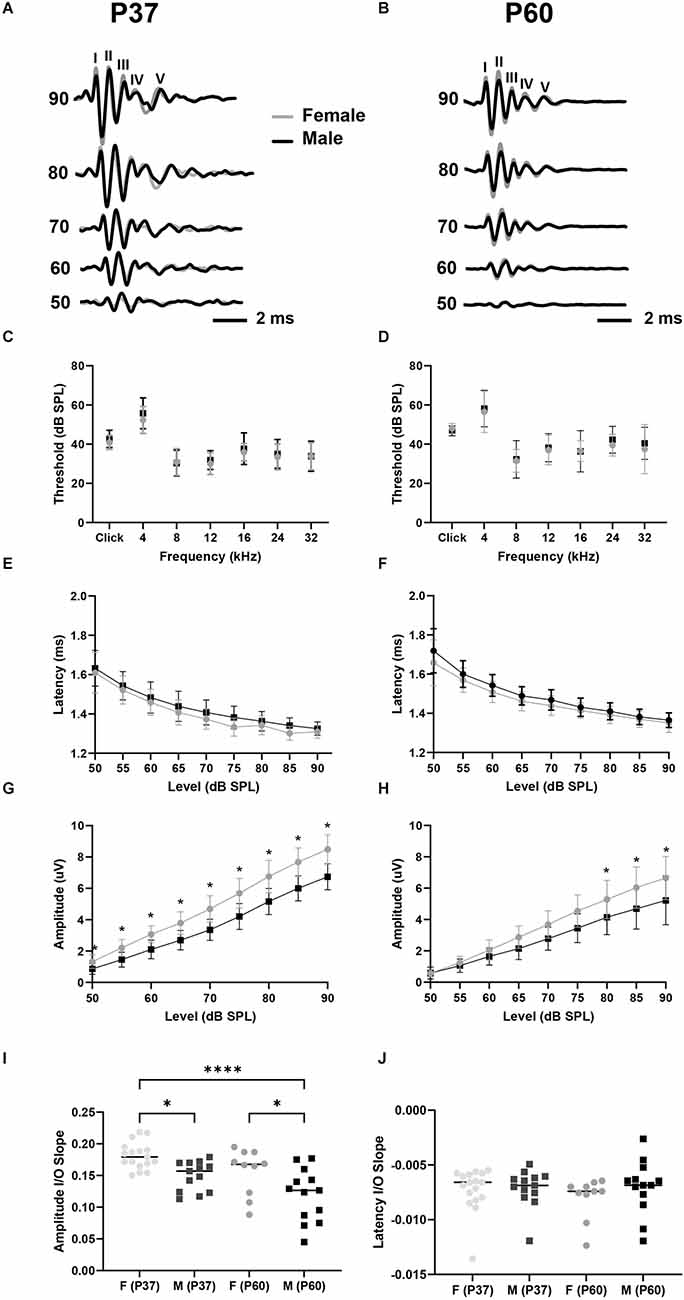
Results Female mice have larger wave I amplitudes than malesWe first tested for potential sex differences in ABR threshold and wave I latency and amplitude in our colony of C57BL/6J mice (Figure 2). These parameters are physiological measures of hair cell health (threshold), SGN speed of conduction (wave I latency), and SGN health and synchronous activity (wave I amplitude; see Liberman and Kujawa, 2017; Young et al., 2021). Our data showed that ABR clicks- and tone-thresholds varied by frequency (i.e., broadband click, 4, 8, 12, 16, 24, and 32 kHz pure tones), but not by sex for both P37 and P60 aged cohorts (two-way mixed ANOVA with a main effect of frequency on ABR threshold, no main effect of sex, nor an interaction of sex and frequency; Figures 2C,D; see Table 1 for ANOVA statistics). We next analyzed wave I latencies. Data showed that click wave I latency decreased with increasing sound levels (50–90 dB), but did not vary by sex (two-way mixed ANOVA with main effect for sound level, no main effect of sex, nor an interaction of sex and sound level; Figures 2E,F). There was no difference in slopes of click wave I latency as a function of stimulus level between the sexes of either age cohort (Figure 2J; Table 1). In contrast, we found that click wave I amplitude differed depending on sex and increased with sound levels (50–90 dB) for both age cohorts (two-way mixed ANOVA with main effect of sex, the main effect of sound level, and an interaction between sex and sound level; Table 1). In P37 mice, pairwise comparisons revealed that there was a sex difference at all tested sound levels with a visualized ABR (50–90 dB SPL; p < 0.05). In P60 mice, females had significantly larger wave I amplitude than males from 80 to 90 dB SPL (p < 0.05; Figures 2G,H). Similarly, analysis of the slope of ABR wave I amplitude as a function of stimulus level revealed that females had higher slopes than males at P37 and P60 (Figure 2I). Wave I amplitudes were also examined for all pure tone stimuli (4, 8, 12, 16, 24, and 32 kHz) for P60 mice. Though not significant, females had slightly higher ABR wave I amplitudes at all frequencies except for 4 kHz (data not shown). Thus, the significant difference for click wave I amplitudes is likely due to a cumulative effect from cochlear regions above 4 kHz. Together, our ABR analysis of sexually mature female and male mice showed no sex differences in click and pure tones thresholds and wave I latency. However, a sex difference in wave I amplitude suggests greater SGN synchrony in females at supra-threshold sound levels, and variability begins to increase at P60, particularly in males.
Figure 2. Female mice have larger wave I amplitudes than males. (A,B) Representative ABR waveforms evoked with clicks from P37 female (gray line, n = 17) and male (black line, n = 13) mice (A) and P60 female (n = 10) and male (n = 13) mice (B). Waves—V are labeled. (C,D) ABR analysis showed no sex differences in click and pure tones thresholds for P37 (C) or P60 (D) mice. (E,F) There was no sex difference in ABR click wave I latency for P37 (E) or P60 (F) mice. (G,H) Female mice aged P37 have larger click wave I amplitude than male mice at sound intensities equal to and above 50 dB SPL (G), and female mice aged P60 have larger click ABR wave I amplitude at sound intensities equal to and above 80 dB SPL (H). (I) Linear slopes of click wave I amplitude as a function of sound level are larger for females aged P37 compared to males aged P37 and P60, and slopes are higher for females aged P60 compared to males aged P60. (J) Linear slopes of click wave I latencies do not differ between sexes at any age. Error bars represent ± SD. Lines on (I,J) scatterplots denote the median. *p < 0.05, ****p < 0.0001.
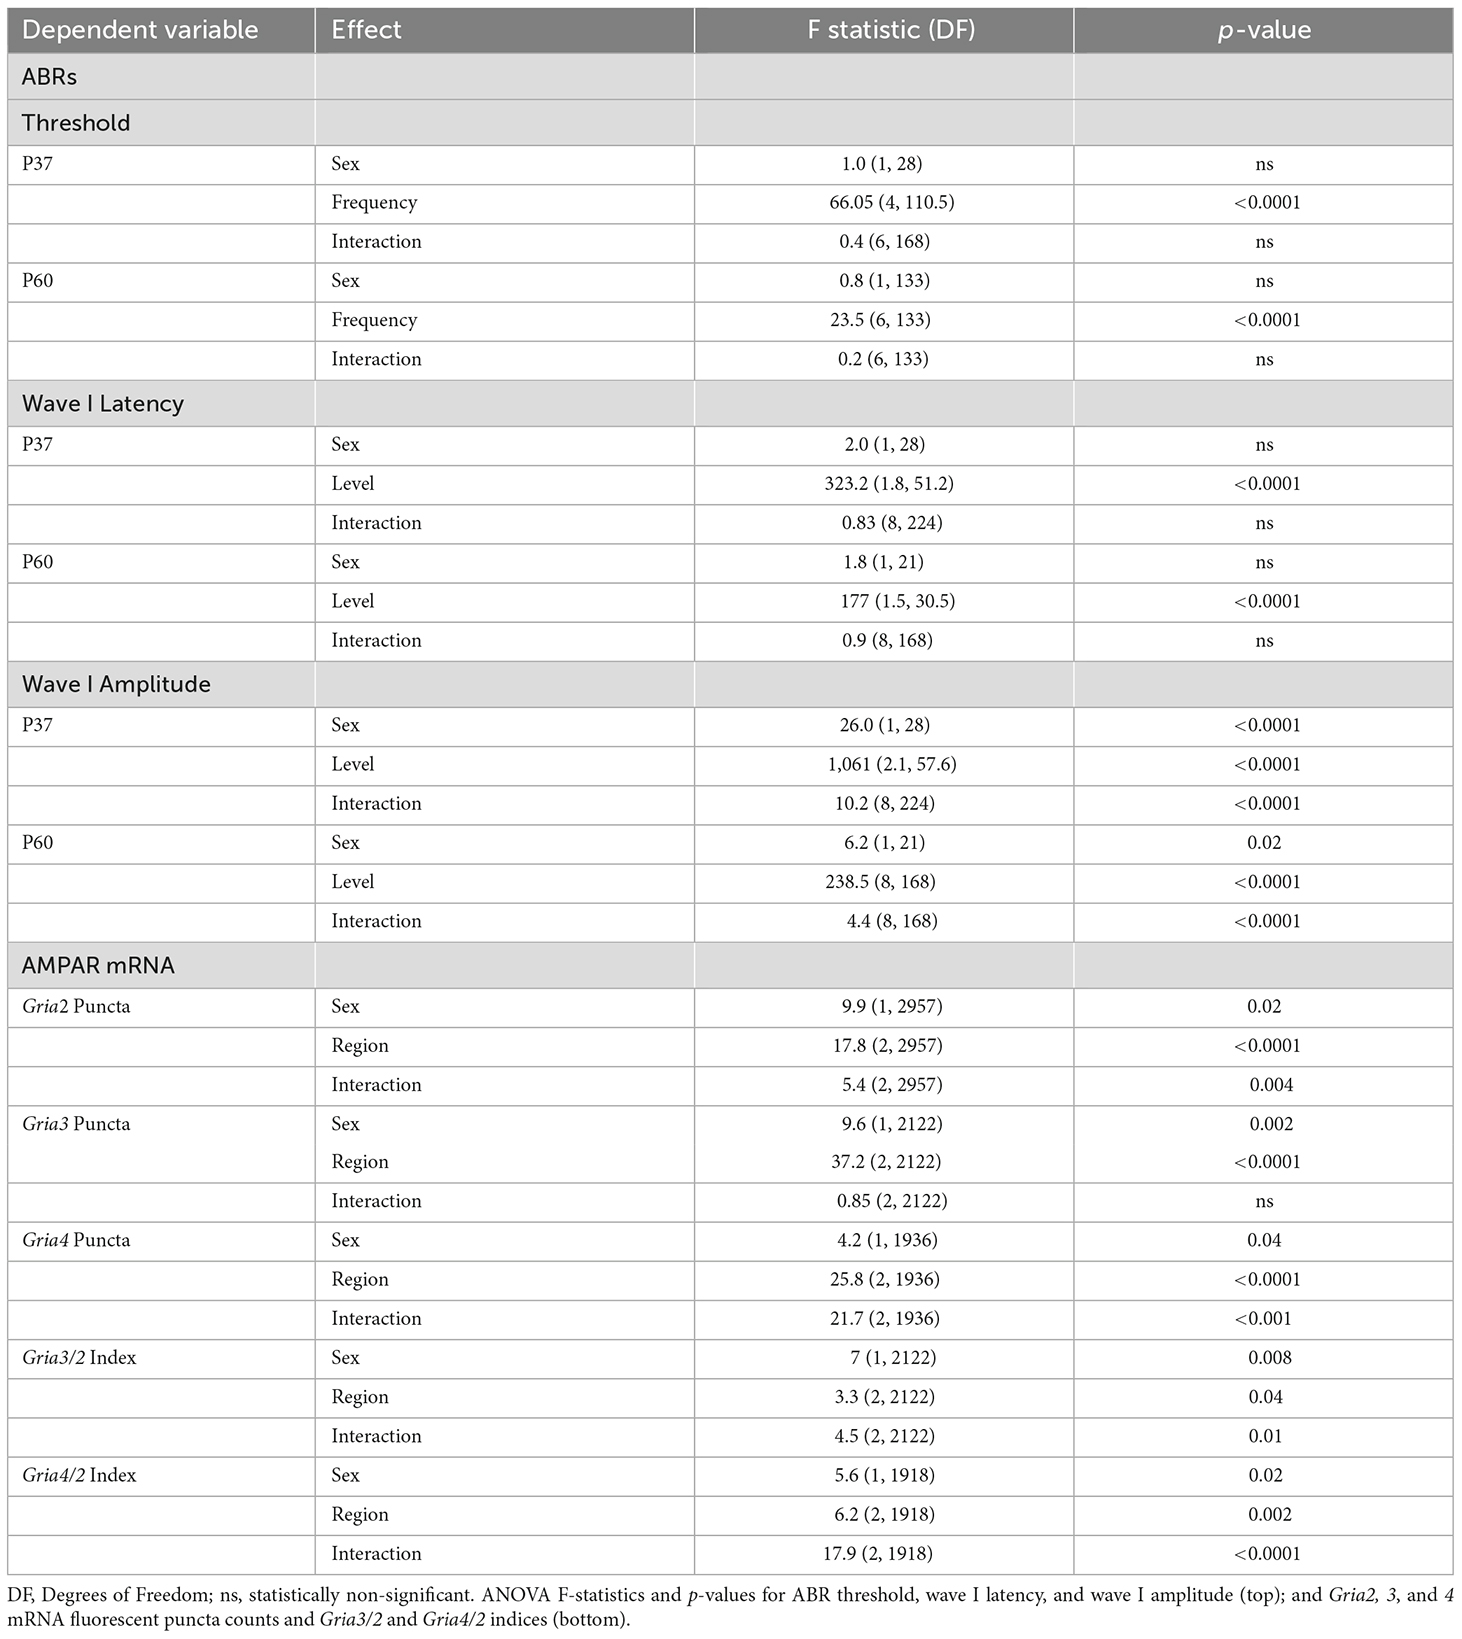
Table 1. Summary of ANOVA statistics.
Slight differences in Gria2, Gria3, and Gria4 mRNA expression along the rosenthal canal of female and male miceIn both females and males, puncta of the RNAscope signal for Gria2, Gria3, and Gria4 were only observed within and along the Rosenthal canal of the cochlea and around large DAPI nuclei of SGNs (Figures 1, 3A, 4A, 5A). We compared total mRNA levels for Gria2, Gria3, and Gria4 between females and males. In addition, for determining whether mRNA levels for Gria2–4 followed a tonotopic organization and whether there were sex-specific differences in their distribution, we quantified the puncta for each of the genes in SGNs of the basal (high-frequency sounds), middle (middle frequency sounds), and apical (low-frequency sounds) cochlea turns.
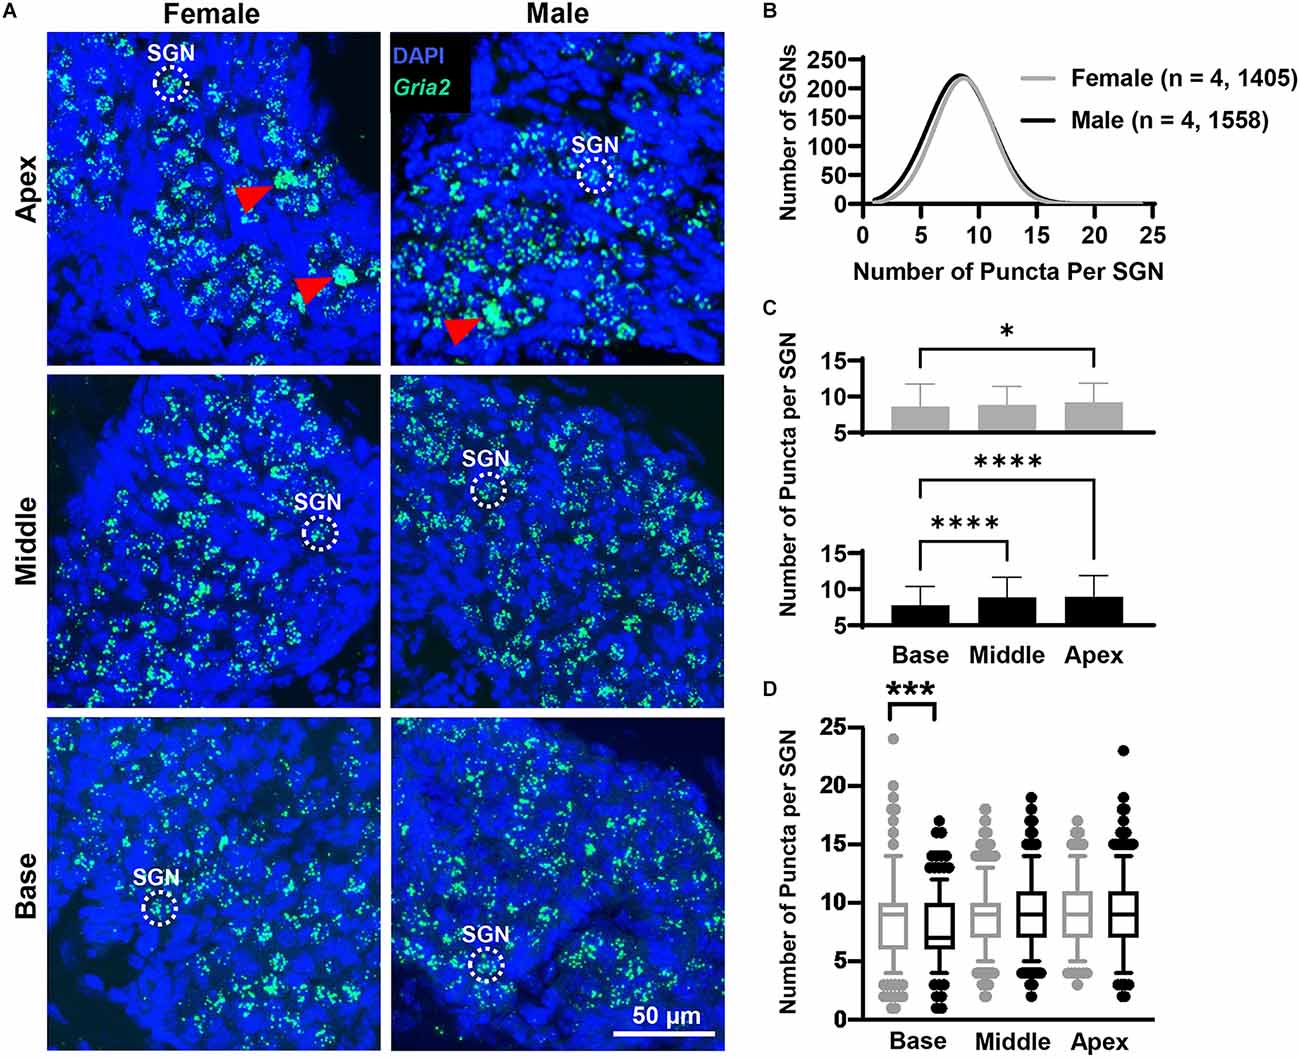
Figure 3. Gria2 mRNA counts analyzed by cochlear region and sex. (A) Representative fluorescent confocal stack of images of Gria2 (green) and DAPI (blue) in the basal middle, and apical cochlea turns for females and males. Red arrowheads point to SGNs that were excluded due to puncta clustering. (B) Histogram representing the distribution of Gria2 mRNA counts in female (gray line) and male (black line) mice throughout the entire cochlea. Numbers in parentheses indicate the number of mice, followed by the total number of SGNs. (C) Bars show the mean Gria2 mRNA puncta on different cochlea turns on SGNs of female (gray bars, top) and male (black bars, bottom) mice. Error bars represent ± SD. (D) Whisker plots of Gria2 mRNA puncta on different cochlea turns on SGNs of females (gray) and males (black). Females had more Gria2 mRNA in the basal turn compared to males. Whiskers display the 5 and 95 percentiles. Samples consisted of the total number of SGNs for which Gria2 puncta were counted in females and males. See Table 2 for sample sizes by region. Independent samples t-test, *p < 0.05, ***p < 0.0005, ****p < 0.0001, see “Results” Section for specific p-values.
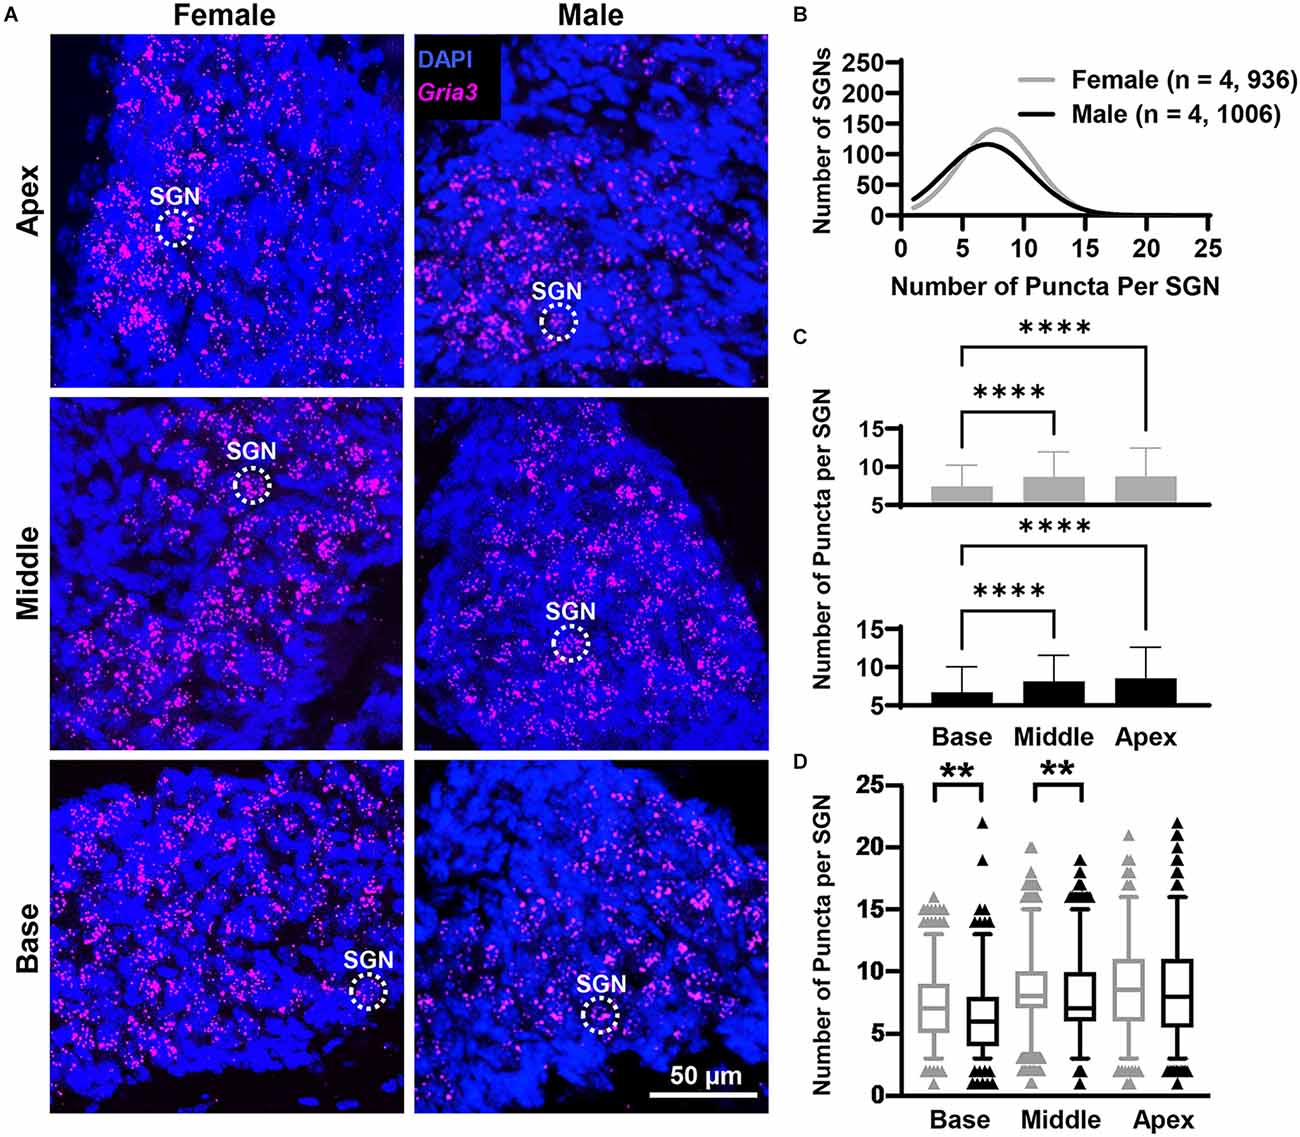
Figure 4. Gria3 mRNA counts analyzed by cochlear region and sex. (A) Representative fluorescent confocal stack of images of Gria3 (false-colored in magenta) and DAPI (blue) in the base, middle, and apex cochlea turns for females and males. (B) Histogram representing the distribution of GriaA3 mRNA counts in female (gray line) and male (black line) mice throughout the entire cochlea. Numbers in parentheses indicate the number of mice, followed by the total number of SGNs. (C) Bars show the mean Gria3 mRNA puncta on different cochlea turns on SGNs of female (gray bars, top) and male (black bars, bottom) mice. Error bars represent ± SD. (D) Whisker plots of GriaA3 mRNA puncta on different cochlea turns on SGNs of females (gray) and males (black). Females had more Gria3 mRNA in the basal and middle turns than males. Whiskers display the 5 and 95 percentiles. Samples consisted of the total number of SGNs for which Gria3 puncta were counted in females and males. See Table 2 for sample sizes by region. Independent samples t-test, **p < 0.01, ****p < 0.0001, see “Results” Section for specific p-values.
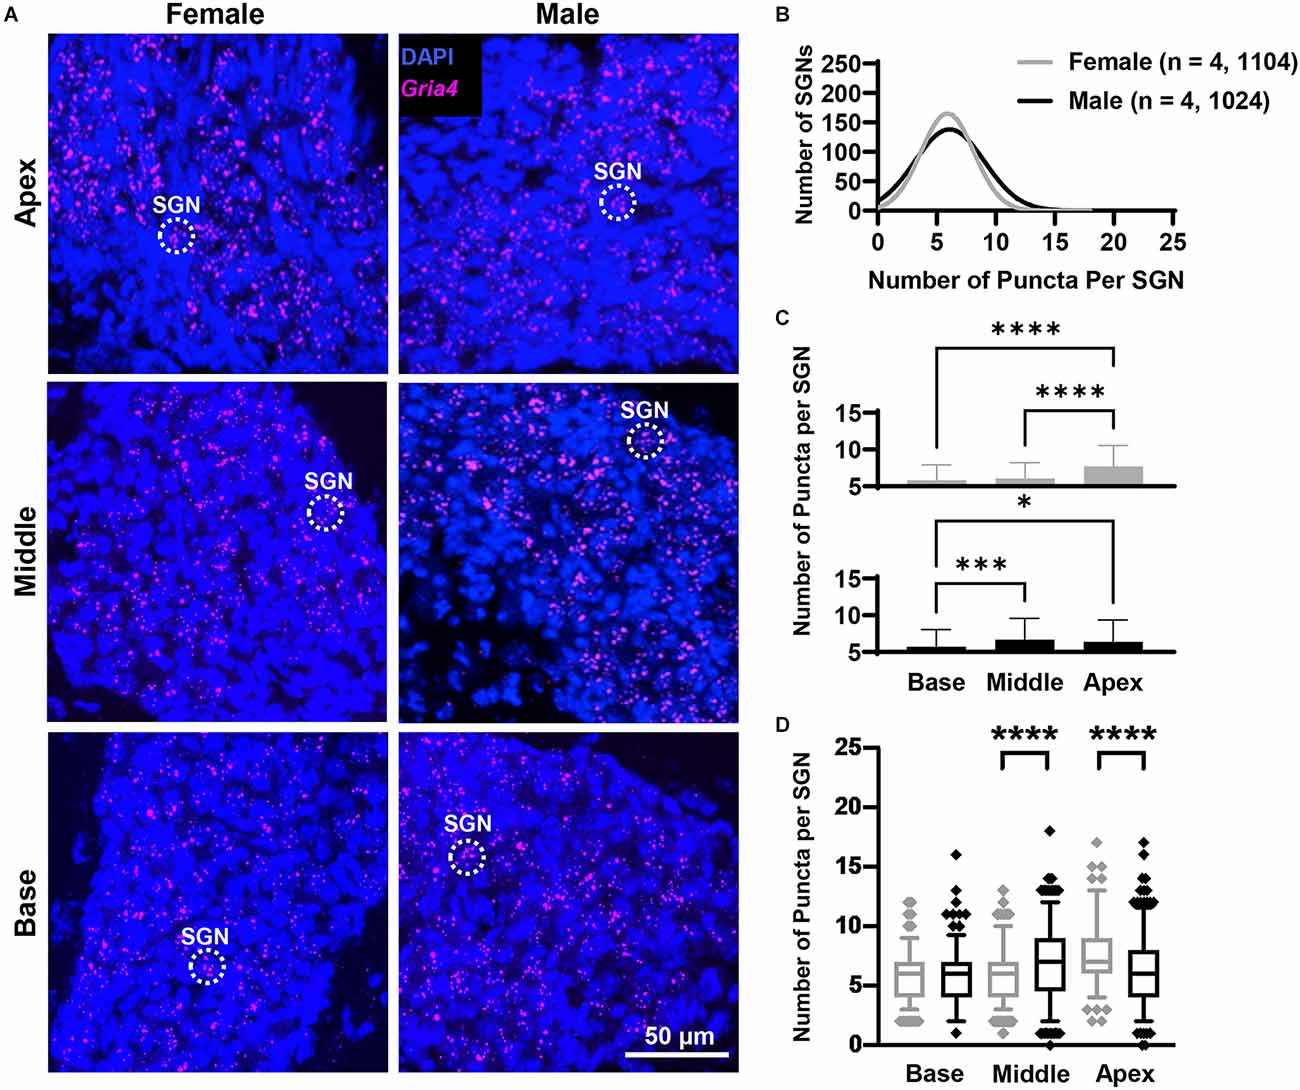
Figure 5. Gria4 mRNA counts analyzed by cochlear region and sex. (A) Representative fluorescent confocal stack of images of Gria4 (false-colored in magenta) and DAPI (blue) in the base, middle, and apex cochlea turns for females and males. (B) Histogram representing the distribution of Gria4 mRNA counts in female (gray line) and male (black line) mice throughout the entire cochlea. Numbers in parentheses indicate the number of mice, followed by the total number of SGNs. (C) Bars show the mean Gria4 mRNA puncta on different cochlea turns on SGNs of female (gray bars, top) and male (black bars, bottom) mice. Error bars represent ± SD. (D) Whisker plots of Gria4 mRNA puncta on different cochlea turns on SGNs of females (gray) and males (black). Males had more Gria4 mRNA in the middle turn, while females had more Gria4 mRNA in the apex. Whiskers display the 5 and 95 percentiles. Samples consisted of the total number of SGNs for which Gria4 puncta were counted in females and males. See Table 2 for sample sizes by region. Independent samples t-test, *p < 0.05, ***p < 0.0005, ****p < 0.0001, see “Results” Section for specific p-values.
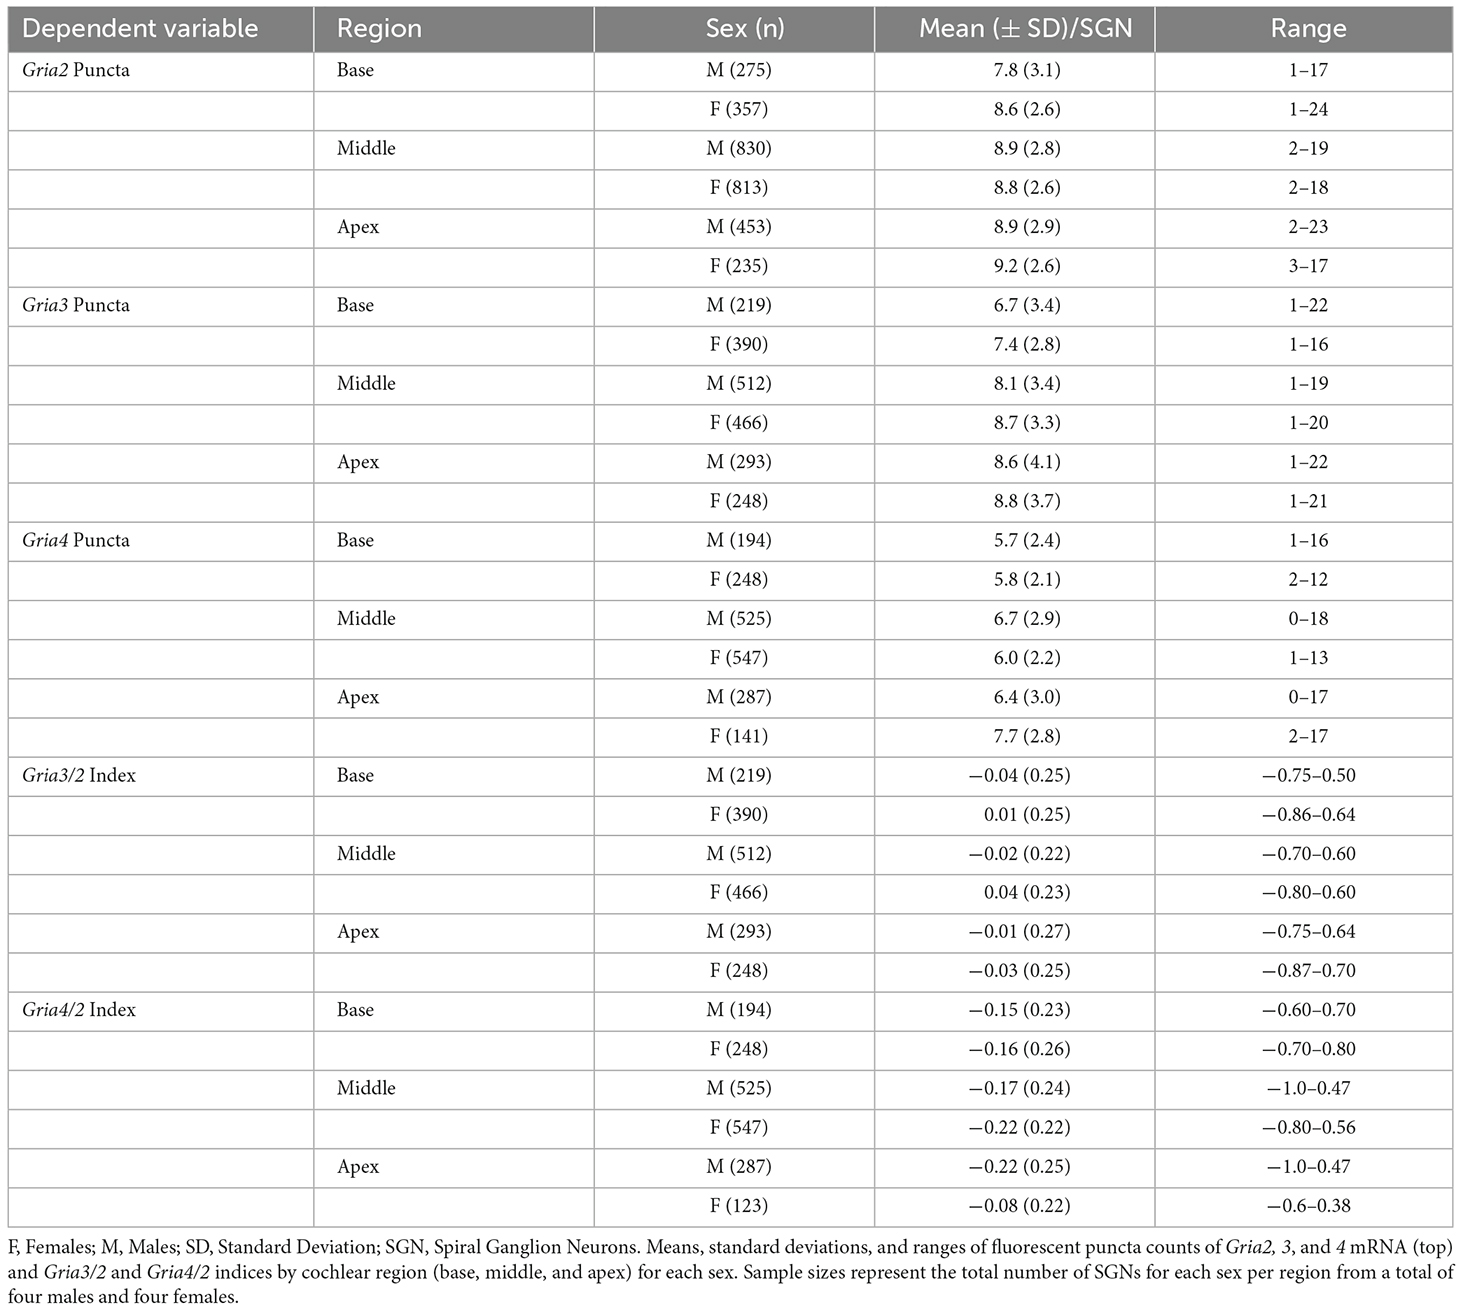
Gria2 mRNA countsOverall, females and males had similar Gria2 mRNA expression levels (Figure 3B). We found that Gria2 mRNA levels varied by sex and cochlear region (two-way ANOVA with main effect of sex, main effect of cochlear region, and interaction of sex and cochlear region; Figure 3C; Table 1). In both females and males, Gria2 mRNA levels were lower in the basal compared with the apical turn (female p = 0.02, male p < 0.0001). In males, Gria2 expression levels were also lower in the basal compared with the middle turn (p < 0.0001). Pairwise comparisons between females and males at each cochlear region revealed that females had greater Gria2 mRNA than males at the base, and this sex difference explained 2% of the variance of Gria2 mRNA in the cochlear base (p = 0.0003, η2 = 0.02). There was no sex difference in the middle (p = 0.8) and apical cochlea turns (p = 0.2; Figure 3D; see Table 2 for descriptive statistics).
Table 2. Summary of AMPAR mRNA descriptive statistics.
Gria3 mRNA countsOverall, females had more Gria3 mRNA than males (Figure 4B). Gria3 mRNA counts were affected by sex and cochlear region (two-way ANOVA with the main effect of sex, and main effect of cochlear region, but no interaction of sex and cochlear region; Figure 4C; Table 1). In females and males, Gria3 mRNA levels were lower in the basal cochlea turn when compared to the middle turn (p < 0.0001 for both comparisons). In pairwise comparisons between males and females at each cochlear region, females had greater Gria3 mRNA puncta in the basal turn compared to males, explaining 2% of the variance of Gria3 mRNA in the base (p = 0.009, η2 = 0.02). Females also had more Gria3 mRNA in the middle turn compared to males, with sex explaining 1% of the variance in the middle (p = 0.01, η2 = 0.01). There was no sex difference in the apex (p = 0.6; Figure 4D; Table 2).
Gria4 mRNA countsOverall, females and males had similar Gria4 mRNA expression levels (Figure 5B). Gria4 mRNA levels similarly varied by sex and cochlear region (two-way ANOVA with main effect of sex, cochlear region, and interaction of sex and cochlear region; Figure 5C; Table 1). In females, Gria4 mRNA levels were similar between the base and middle cochlea turns (p = 0.37) and only the apex had significantly higher levels of expression for Gria4 (p < 0.0001). In males, Gria4 mRNA levels were similar between the middle and apex (p = 0.28), but lower in the base (p = 0.0001 and p = 0.03, respectively). Pairwise comparisons showed that males had greater amounts of Gria4 in the middle turn compared to females and that sex explains 2% of the variance in Gria4 levels (p < 0.0001, η2 = 0.02), while females had more Gria4 at the apex compared to males and sex accounts for 5% of the variance in Gria4 mRNA in this cochlea region (p < 0.0001, η2 = 0.05; Figure 5D; Table 2).
Our analysis shows that in both sexes, the total Gria2, 3, and 4 mRNA levels increased from the basal to the apical cochlea turns following a tonotopic gradient from high to low frequencies. Additionally, when compared to males, data showed that females had more total mRNA levels of Gria2 and Gria3 in the basal turn, more Gria3 in the middle turn, and more Gria4 in the apical turn. In contrast, males had more total Gria4 mRNA in the middle cochlea turn. Of note is that sex accounts for a small amount of variability in total mRNA expression of all three subunits (1%–5%) between male and female mice.
Subpopulations of SGNs along the rosenthal canal based on Gria2, Gria3, and Gria4 expression levelsIn our RNAscope procedure, each SGN had mRNA expression for two genes, either Gria2 and Gria3 or Gria2 and Gria4. Our initial semiquantitative analysis of the puncta showed in both female and male mice that SGNs differed in the ratios of the Gria3/Gria2 and Gria4/Gria2 puncta (Figure 1). For example, some SGNs had more Gria3 than Gria2 puncta and vice versa; other SGNs had roughly equal amounts of Gria3 and Gria2 puncta. We used an index calculation to classify the putative existence of a heterogenous population of SGNs based on Gria2, 3, and 4 mRNA levels (Balaram et al., 2019). The Gria3/Gria2 and the Gria4/Gria2 index calculations revealed a gradient of SGNs based on these indices in males and females throughout the cochlea (Figure 6; see Section “Materials and Methods” for details). We found a population of SGNs with a positive index value (> 0), meaning that these neurons had higher mRNA levels for Gria3 or Gria4 than Gria2. Data also showed another population of SGNs with an index value of 0, meaning that they had equal mRNA levels for each of the paired genes analyzed. Finally, data showed a third population of SGNs with a negative index value (< 0), which indicates that Gria2 mRNA is higher than Gria3 or Gria4. We found that the percentage of each population of SGN differed along the cochlea turns and by sex.
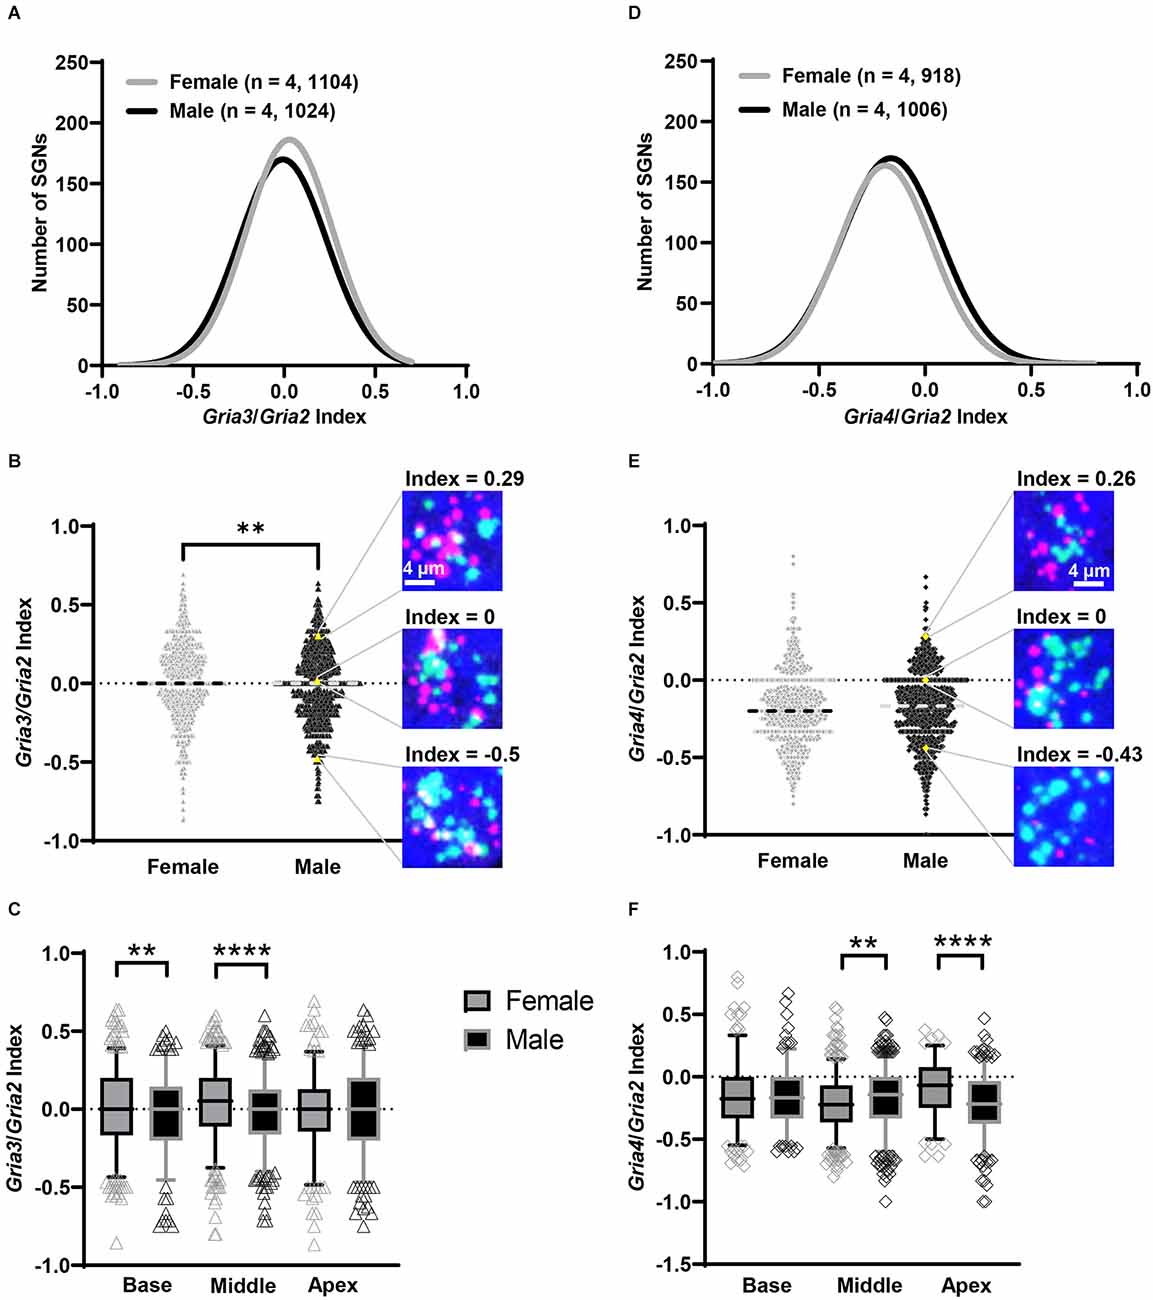
Figure 6. SGN Gria3/Gria2 and Gria4/Gria2 indices vary by sex. (A–C) Subpopulations of SGNs based on the Gria3/Gria2 index value. (A) Histogram showing the total distribution of SGN GriaA3/Gria2 indices for females (gray line) and males (black line). Numbers in parentheses indicate the number of mice, followed by the total number of SGNs. (B) Violin plots of the index values for Gria3/Gria2 on each SGN for the whole cochlea. To the right are representative images of SGNs in a male with different index values based on Gria3 (magenta) vs. Gria2 (green) counts: Gria3 > Gria2 (top, positive index value), Gria3 = Gria2 (middle, index value of 0), and Gria3 < Gria2 (bottom, negative index value). The position of each example SGN within the violin plot is represented with a yellow triangle. The dashed line on each violin plot represents the median. (C) Whisker plots show the index values for Gria3/Gria2 on SGNs of the basal, middle, and apical cochlea turns. Females (gray symbols) had higher average Gria3/Gria2 index values in the base and middle compared to males (black symbols). Whiskers display the 5 and 95 percentiles. (D–F) Subpopulations of SGNs based on the Gria4/Gria2 index value. (D) Histogram showing the total distribution of SGN Gria4/Gria2 indices for females (gray line) and males (black line). Numbers in parentheses indicate the number of mice, followed by the total number of SGNs. (E) Violin plots of the index values for Gria4/Gria2 on each SGN for the whole cochlea. To the right are representative images of SGNs in a male with different index values based on Gria4 (magenta) vs. Gria2 (green) counts: Gria4 > Gria2 (top, positive index value), Gria4 = Gria2 (middle, index value of 0), Gria4 < Gria2 (bottom, negative index value). The position of each example SGN within the violin plot is represented with a yellow diamond. The dashed line on each violin plot represents the median. (F) Whisker plots show the index values for Gria4/Gria2 on SGNs of the base, middle, and apex cochlea turns. Males (black symbols) had on average higher Gria4/Gria2 index values in the middle, while females (gray symbols) had a higher average Gria4/Gria2 index in the apex. Whiskers display the 5 and 95 percentiles. Unpaired t-test, **p < 0.01, ****p < 0.0002.
Gria3/2 indexWhen analyzing the entire cochlea (base, middle, and apex), 48% of the female SGNs had a positive Gria3/2 index value compared to 43% in males. The percent of SGNs with an index value of zero was 11% in both females and males, while those with a negative index value were 41% in females and 46% in males. While we are interested in sex differences in the proportion of these three “classes” of SGN, we chose to analyze the indices as continuous variables because these boundaries for classification are somewhat arbitrary. Indeed, an SGN with a slightly positive or negative index value is likely similar to an SGN with an index value of zero in terms of AMPAR composition. Like mRNA counts, Gria3/2 indices varied by sex and cochlear region (two-way ANOVA with the main effect of sex, main effect of cochlear region, and an interaction of sex and cochlear region; Table 1). Throughout the entire cochlea, on average females had SGNs with more Gria3 relative to Gria2 (mean Gria3/2 index = 0.02 ± 0.24 SD) compared to males (mean Gria3/2 index = −0.02 ± 0.24 SD; Figures 6A,B). In pairwise comparisons, females had a higher average Gria3/2 index in the basal turn compared to males (p = 0.02, η2 = 0.01) and in the middle turn (p < 0.001, η2 = 0.02). There was no sex difference in the apical cochlea turn (p = 0.41; Figure 6C; Table 2).
Gria4/2 indexThe Gria4/2 index calculations revealed that the percent of SGNs with positive, zero, and negative indices were closer between females and males. The percentage of SGN with a positive index was 17% in females and 19% in males. The percentage of SGN with an index of zero was 8% and 8.5% in females and males, respectively. Finally, the percentage of SGN with a negative index in females was 75% and 72.5% in males. However, Gria4/2 indices in SGNs varied by sex and cochlear region (two-way ANOVA with main effect of sex, cochlear region, and an interaction of sex and cochlear region; Table 1). Throughout the entire cochlea, though there was an effect of sex in the ANOVA, on average males and females had a similar Gria4/2 index (male mean = −0.182 ± 0.24 SD, female mean = −0.181 ± 0.23 SD; Figures 6D,E). In pairwise comparisons, males had a higher average Gria4/2 index compared to females in the middle turn (p = 0.005, η2 = 0.01), while females had a higher average Gria4/2 index than males in the apical turn (p < 0.0001, η2 = 0.06). There was no sex difference in the cochlear base (p = 0.71; Figure 6F; Table 2). However, it is important to note that despite these sex differences, which are relatively small, on average, females and males had SGNs with less Gria4 relative to Gria2 throughout the entire cochlea (Figure 6).
In summary, our data suggest that there is a large population of SGNs with more Gria3 relative to Gria2 (>40% of all SGNs analyzed) and a smaller population of SGNs with more Gria4 relative to Gria2 (<20% of all SGNs analyzed) regardless of sex. When comparing the sexes, females had more SGNs with positive Gria3/2 indices than males in the cochlear base and middle. In Gria4/2 index sex comparisons, males had higher average Gria4/2 index values in the middle cochlea, and females had higher average GriaA4/2 values in the apex. Though significant, sex has a small effect on the variability of the Gria3/2 and Gria4/2 indices (1%–6%).
Sex differences in Gria3 and Gria4 flip and flop splice variants in the mouse inner earAMPAR subunit composition determines channel permeability to calcium and sodium, and the gating kinetics of the channel is determined by the flip-and-flop splice variants (Mosbacher et al., 1994). Thus, we next determined Gria2, 3, and 4 flip and flop splice variant mRNA levels in the female and male cochlea with RT-qPCR. Our data showed that the relative abundances of Gria2 flip and flop mRNA were not different between females and males (t = 1.198, p = 0.26 and t = 1.631, p = 0.13, respectively). However, males had roughly 2.5-fold more Gria3 flip mRNA than females, whereas females had roughly 2-fold more Gria3 flop mRNA than males (t = 3.32, p = 0.007, and t = 3.986, p = 0.002, respectively). Additionally, females had roughly 2-fold more Gria4 flip and flop compared to males (t = 4.27, p = 0.002 and t = 5.56, p = 0.0005, respectively; Figure 7). These data suggest that females have more post-transcriptional processing of Gria3 into the faster flop isoform and Gria4 into the slower flip and faster flop isoform than males throughout the entire cochlea. In contrast, males had more of the slower gating Gria3 flip isoform. We note that these results were obtained from the entire inner ear that included SGN and vestibular neurons.
Figure 7. Sex differences in the expression of AMPAR flip and flop splice variants in the cochlea. (A–C) Bars show the fold change (±SD) in mRNA for Gria2 (A), v3 (B), and Gria4 (C) flip and flop splice variants in male (black) when compared to female (gray) cochleae. Independent samples t-test, **p < 0.05, ***p < 0.0005, see “Results” Section for specific p-values.
DiscussionSupra-threshold ABR wave I amplitudes measure SGN synchrony which depends partly on the channel kinetics of excitatory postsynaptic AMPA-type glutamate receptors. Human and rodent studies (this study; Kjær, 1979, 1980; Wharton and Church, 1990; Balogová et al., 2018; Milon et al., 2018) have shown that ABR wave I amplitudes are higher in females. While the potential molecular mechanisms of this sex difference are unknown, our data show that sex differences in AMPAR subunit expression and their differences in alternative splicing (flip-and-flop) may contribute to greater SGN synchrony and as a result to higher ABR wave I amplitude in females.
AMPAR subunit composition contributes to synapses speedRelative levels of each AMPAR subunit (GluA2, 3, and 4) are significant contributors to synaptic speed in SGNs because they affect the channel kinetics of AMPARs differently. AMPARs that lack GluA2 are calcium permeable and are known to have extremely fast channel kinetics (Cull-Candy et al., 2006; Traynelis et al., 2010). For example, cochlear nucleus principal neurons that receive excitatory synaptic input from auditory nerve fibers where fast synaptic responses are essential for reliably encoding auditory information, AMPARs are mainly composed of GluA3 and GluA4 subunits (Rubio and Wenthold, 1997; Wang et al., 1998; Gardner et al., 1999, 2001; Rubio et al., 2017). While many of these studies focused on mature AMPAR subunit proteins at the synapse, importantly others have shown that subunit mRNA levels correlate with channel kinetics. Indeed, studies in the CNS have shown that faster AMPAR gating kinetics correlate with Gria4 mRNA levels, but not with Gria2 mRNA levels (Geiger et al., 1995). Furthermore, relative levels of alternatively spliced AMPAR subunit flip and flop isoforms more accurately describe each subunit’s contribution to gating kinetics (Sommer et al., 1990; Mosbacher et al., 1994; Lambolez et al., 1996; but see Angulo et al., 1997). In fact, in cells expressing recombinant AMPARs, homomeric AMPAR channels containing Gria3 and Gria4 flip are 3.4 and 4x slower gating, respectively, than those containing the flop isoforms of each (Mosbacher et al., 1994). The Gria2 isoform has a weaker effect on AMPAR desensitization, though Gria2 flop increases the speed of desensitization relative to the flip isoform in both homomeric Gria2 and heteromeric Gria2/3 and Gria2/4 channels (Mosbacher et al., 1994; Koike et al., 2000). Thus, SGNs enriched with flop isoforms of the GluA3 or GluA4 subunits will always have AMPAR channels with faster kinetics and therefore faster synaptic responses than SGNs enriched with the flip isoform. Based on this prior evidence, we propose that SGNs enriched in Gria3 and/or Gria4 mRNA, especially in the flop isoform, will likely have increased temporal precision in response to sound, thus contributing to greater synchrony and higher ABR wave I amplitudes.
SGNs are heterogenous in relative mRNA expression levels of Gria2, 3, and 4Our analysis of AMPAR subunit mRNA showed that the relative expression of the three AMPAR subunits (Gria2, 3, and 4) are not equal in individual SGNs, as evidenced by the differences in Gria3/2 and Gria4/2 indices. This result indicates the existence of a heterogenous population of SGN that could differ in AMPAR channel kinetics and permeability to calcium and sodium. For example, AMPARs lacking GluA2 are calcium-permeable and recently have been proposed as mediators of SGN excitotoxicity (Sebe et al., 2017; Hu et al., 2020). Thus, SGNs with lower levels of GluA2 relative to GluA3 and GluA4 will not only likely have faster synaptic responses once depolarized but will be more vulnerable to excitotoxicity due to AMPARs with higher permeability to calcium and sodium (Cull-Candy et al., 2006; Traynelis et al., 2010; Sebe et al., 2017; Hu et al., 2020). Interestingly, women are better protected from sensorineural hearing loss than men (Cruickshanks et al., 1998; Agrawal et al., 2008), and estrogen has been shown to have oto-protective effects in mice (Meltser et al., 2008; Simonoska et al., 2009; Williamson et al., 2019). Thus, the mechanism underlying sex differences in auditory processing may differ from the protective mechanism of estrogens. Whether SGNs can also be classified by differences in the AMPAR subunits’ flip/flop ratio, is still undetermined, because our analysis was only performed from whole inner ear samples rather than on single SGNs. Future studies that induce, for example, excitotoxicity in SGNs coupled with RNAscope, electrophysiology, and single-cell RT-qPCR for Gria2, 3, and 4 and their splice variants (flip and flop) will increase our understanding of whether these different SGNs differ in their fast AMPAR synaptic responses and gating, and calcium permeability.
Sex differences in AMPAR subunit mRNASince females have higher ABR wave I amplitude (Figure 2), we hypothesized that they would have more overall AMPAR mRNA that could contribute to fast channel kinetics compared to males. Three findings from our mRNA quantification experiments suggest that Gria3 is the most likely AMPAR subunit to potentially mediate increased SGN synchrony in females. For one, females have more overall Gria3 mRNA than males (Figure 4). Second, females have a significantly higher Gria3/2 index overall than males, meaning the gradient of SGNs with Gria3 relative to Gria2 is shifted higher in females (Figures 6A–C). Last, Gria3 was post-transcriptionally processed into the flop isoform to a greater level in females than males who had more Gria3 flip (Figure 7). Thus, SGNs of the female cochlea have more overall Gria3 mRNA in the flop isoform, which was previously shown to lead to faster AMPAR gating kinetics than Gria3 flip whether it was dimerized to Gria2 flip or flop (Mosbacher et al., 1994). Also, more Gria3 relative to Gria2 suggests that females may have more heteromeric AMPARS containing Gria3 and Gria4, which are known to comprise AMPARs in fast excitatory synapses in the auditory CNS (Rubio and Wenthold, 1997; Gardner et al., 2001; Rubio et al., 2017). Our study shows that SGNs of female and male mice differ in their mRNA expression levels for Gria2, 3, and 4 AMPAR subunits, thus potentially contributing to our understanding of basic molecular mechanisms of sex differences in normal hearing mice.
Sex differences in AMPAR subunit composition: implications for glutamatergic synapse-induced excitotoxicityGlutamate-induced calcium excitotoxicity via AMPARs does not only occur in the cochlea (Sebe et al., 2017; Hu et al., 2020), but also in other brain regions. In fact, calcium-permeable (GluA2 lacking) AMPARs are implicated in neuronal cell death and in neurological disorders in the CNS (Liu and Zukin, 2007; Guo and Ma, 2021). The sex differences in AMPAR subunits gene expression we describe here may not be specific to SGNs in the inner ear but present in other glutamatergic neurons in the CNS. For example, in human hippocampal neurons, schizophrenia patients had less overall Gria2 than controls (Eastwood et al., 1997), suggesting that differences in AMPAR subunit transcription could contribute to the disease. Interestingly, women and men differ in presenting schizophrenic symptoms and response to antipsychotic medication. There is some evidence that both sex hormones and sex chromosomes are related to schizophrenia in women and men (Li et al., 2016). Thus, probing sex differences in AMPAR subunit mRNA and the alternatively spliced flip and flop isoforms may aid in understanding sex differences in neurological disorders involving glutamatergic signaling through AMPARs.
Proximate mechanisms of biological sex on Gria3 expressionThe mechanism for the sex difference in AMPAR subunit mRNA expression described in this study is still unknown. Estrogen receptors (ER) and androgen receptors (AR) are both transcription factors (Levin and Hammes, 2016), and therefore estrogens and androgens could regulate the expression of AMPAR subunits either directly or indirectly via the recruitment of other transcription factors. Evidence that ERα and ERβ are found in SGNs (Stenberg et al., 1999; Meltser et al., 2008; Shuster et al., 2021) together with data from knockout mouse models have demonstrated that ERβ is important for SGN health (Simonoska et al., 2009). On the other hand, while the Gria2 and Gria4 genes are located on autosomes, the Gria3 gene is located on the X chromosome (Mahadevaiah et al., 2009). Therefore, it is also possible that females have more Gria3 mRNA due to incomplete X-inactivation in some or all SGNs leading to increased gene dosage (Carrel and Willard, 2005; Berletch et al., 2011). This would suggest that this sex difference is not due to hormonal differences but rather intrinsic biological sex due to the XX/XY sex-determination system. It is essential to study potential anatomical and molecular sex differences in the nervous system to better tailor treatment options for optimal auditory processing in both sexes.
Data availability statementThe raw data supporting the conclusions of this article will be made available by the authors, without undue reservation.
Ethics statementThe animal study was reviewed and approved by University of Pittsburgh IACUC.
Author contributionsNL, SM, H-MC, IP, and MR: performed research and analyzed data. NL: writing—original draft. MR: designed research, writing—review and editing. The authors have read and have abided by the statement of ethical standards for manuscripts submitted to Neuroscience. All authors contributed to the article and approved the submitted version.
FundingThis work was supported by NIDCD DC013048 (MR).
AcknowledgmentsWe thank Mark Rutherford for his helpful comments on the manuscript.
Conflict of interestThe authors declare that the research was conducted in the absence of any commercial or financial relationships that could be construed as a potential conflict of interest.
Publisher’s noteAll claims expressed in this article are solely those of the authors and do not necessarily represent those of their affiliated organizations, or those of the publisher, the editors and the reviewers. Any product that may be evaluated in this article, or claim that may be made by its manufacturer, is not guaranteed or endorsed by the publisher.
Footnotes https://imagej.nih.gov/ij/ ReferencesAgrawal, Y., Platz, E. A., and Niparko, J. K. (2008). Prevalence of hearing loss and differences by demographic characteristics among US adults. Arch. Intern. Med. 168, 1522–1530. doi: 10.1001/archinte.168.14.1522
PubMed Abstract | CrossRef Full Text | Google Scholar
Angulo, M. C., Lambolez, B., Audinat, E., Hesterin, S., and Rossier, J. (1997). Subunit composition, kinetic and permeation properties of AMPA receptors in single neocortical nonpyramidal cells. J. Neurosci. 17, 6685–6696. doi: 10.1523/JNEUROSCI.17-17-06685.1997
PubMed Abstract | CrossRef Full Text | Google Scholar
Balaram, P., Hackett, T. A., and Polley, D. B. (2019). Synergistic transcriptional changes in AMPA and GABAA receptor genes support compensatory plasticity following unilateral hearing loss. Neuroscience 407, 108–119. doi: 10.1016/j.neuroscience.2018.08.023
PubMed Abstract | CrossRef Full Text | Google Scholar
Balogová, Z., Popelár, J., Chiumenti, F., Chumak, T., Burianová, J. S., Rybalko, N., et al. (2018). Age-related differences in hearing function and cochlear morphology between male and female Fischer 344 rats. Front. Aging Neurosci. 9:428. doi: 10.3389/fnagi.2017.00428
PubMed Abstract | CrossRef Full Text | Google Scholar
Bell, M. R. (2018). Comparing postnatal development of gonadal hormones and associated social behaviors in rats, m
留言 (0)