
記住我

Uric acid (UA) is the end product of purine metabolism that produces from the metabolism of adenosine triphosphate and nucleotides. Hyperuricemia has contributed as a risk factor for cardiovascular and renal diseases.1–3 One of the key hypotheses is that hyperuricemia induces endothelial dysfunction,4,5 and endothelial dysfunction is closely related to the physiopathologic mechanisms underlying the occurrence of cardiovascular and renal diseases.3,6–8 Therefore, preventing UA-induced vascular endothelial cell injury (VECI) is an effective strategy for treating UA-induced cardiovascular and kidney diseases.
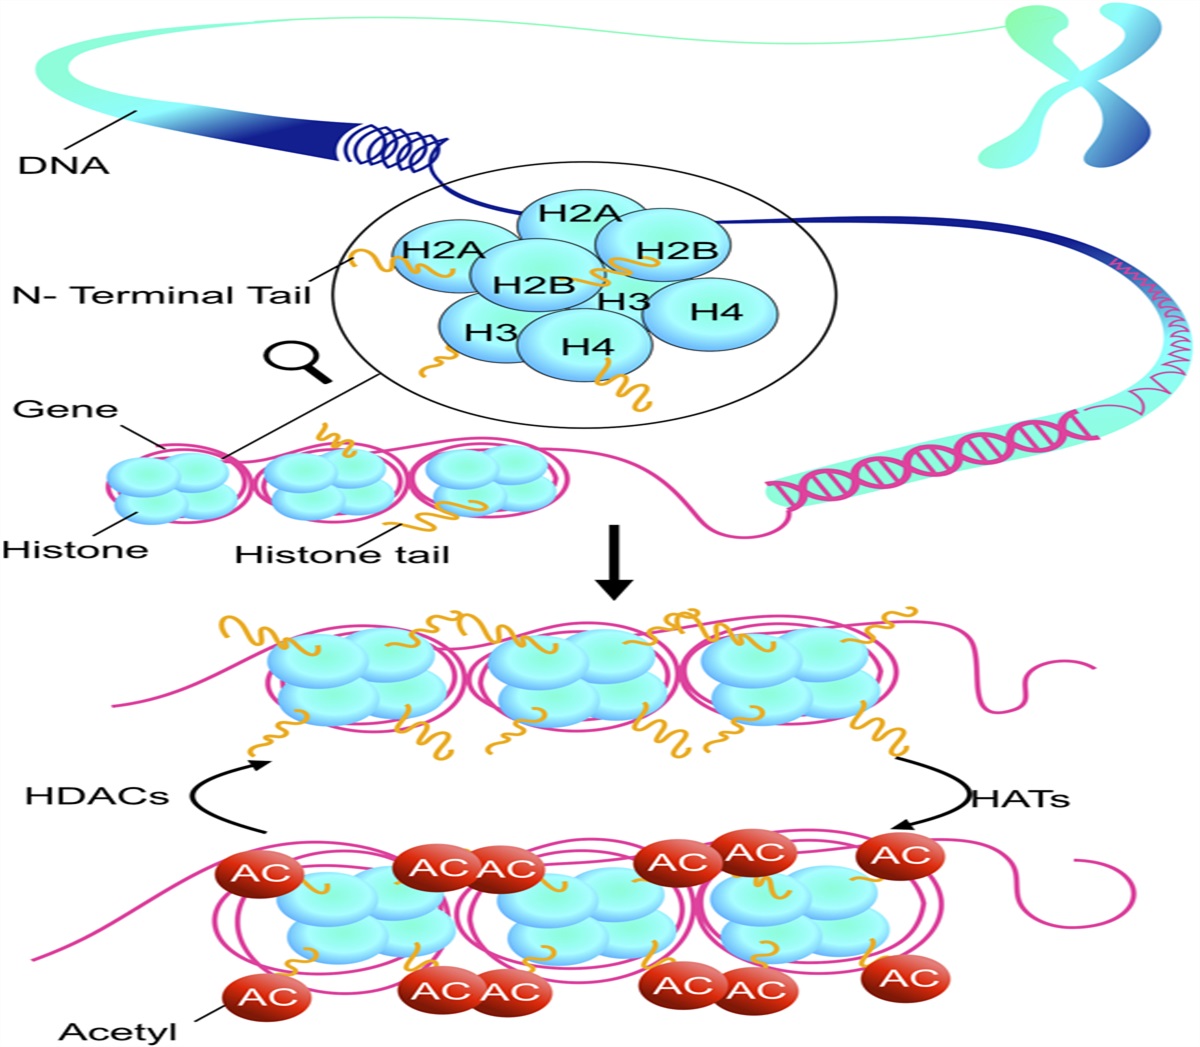
Histone deacetylases (HDACs) are defined as the enzymes that remove acetyl groups from lysine residues of both histone and nonhistone proteins.9 To date, 18 mammalian HDACs have been identified and are characterized into 4 classes. In general, HDACs act as an epigenetic regulator to deacetylate nucleosome histones and suppress gene expression. HDAC inhibitors enhance the level of histone acetylation and stimulate some gene expression. HDAC inhibitors have been considered as a new class of anticancer drugs. However, its application in cardiovascular has attracted more and more attention.10 A growing number of preclinical studies have shown the anti-inflammatory and cardioprotective effects of numerous HDAC inhibitors.11,12 It has been reported that HDAC inhibitors can reduce ischemia-reperfusion injury,13 myocardial hypertrophy,14 and cardiac fibrosis.15 However, most of these studies focus on the effects of class Ⅰ HDACs (HDACs 1,2,3) inhibitors. For example, HDAC1 has been found to play a role in ischemia-reperfusion injury16 and myocardial fibrosis,15 while HDAC2 is considered to play an important role in myocardial hypertrophy14 and cardiac arrhythmia.17 HDAC3 is also involved in the development of heart failure,18 ventricular remodeling,19 and hypertension.14,20 However, as a class II HDACs, there are relatively few reports on the direct effects of HDAC6 on the heart, while some studies have shown the protective effect of HDAC6 inhibitors on vascular endothelium.21–24 Thorsten et al reported that inhibition of HDAC6 activity improved endothelial function and prevented or reversed the development of atherosclerosis.22 Shigeki et al also reported that the inhibition of HDAC6 activity attenuated endothelial barrier dysfunction induced by thrombin.21 In addition, several studies have shown that HDAC6 inhibitors have anti-inflammatory and renal protective effects.25,26 Recent research highlighted that HDAC6 inhibition attenuated inflammatory response and oxidative stress27 and prevented TNF-α–induced inflammatory injury in lung endothelial cells.24 Inhibition of HDAC6 could suppress renal fibrosis,28 alleviate acute kidney injury.29 Therefore, HDAC6 is a potential target for endothelial diseases, and HDAC6 inhibitors may be a potential anti-inflammatory and antioxidative drugs in VECI.
However, it remains unknown whether HDAC inhibitors can alleviate UA-induced VECI and related organ damage. We presume that HDAC inhibitors, especially HDAC6 inhibitor, may serve as a novel agent for UA-induced VECI. Trichostatin A (TSA), a broad-spectrum HDAC inhibitor, has been reported to exert various cardiovascular protective effects, including inhibiting myocardial hypertrophy30 and attenuating myocardial fibrosis.31 In addition, TSA exhibits multiple modalities of benefit for vascular endothelial cells.32,33 Therefore, in this study, by culturing UA-stimulated human umbilical vein endothelial cells (HUVECs) and constructing hyperuricemia mouse model, while given TSA treatment, we aimed to investigate whether HDACs inhibitor could alleviate UA-induced inflammation and VECI and elucidate the underlying mechanisms. The findings enhanced our understanding of UA-induced VECI and revealed a novel target for the treatment of hyperuricemia.
MATERIALS AND METHODS Cell Culture and TreatmentHUVECs were supplied by the American Type Culture Collection (Manassas, VI, USA). The cells were cultured in endothelial cell growth medium (ECM) containing 10% fetal bovine serum (FBS; Gibco, BV000) and 1% penicillin/streptomycin (Invitrogen, CA, USA) and then maintained at 37°C and 5% CO2. The medium was refreshed every 2–3 days. Before experimental treatments, HUVECs were cultured without fetal bovine serum for 24 hours.
UA crystallites (Sigma–Aldrich, St. Louis, MO, USA) were dissolved in 1 N NaOH solution. HUVECs were stimulated with multiple doses of UA (6, 9, 12 mg/dL) for 24 hours. TSA, selective HDAC1-3 inhibitor Mocetinostat (MGCD0103), and LY294002 (specific PI3K/AKT signaling pathway inhibitor) were obtained from Selleck Chemicals (Houston, TX, USA). HUVECs were pretreated with low dose (50 nM) or high dose (100 nM) of TSA, Mocetinostat (2 µM), or LY294002 (50 µM) in ECM for 2 hours before UA (12 mg/dL) stimulation. The control (CON) group consists of untreated HUVECs.
Cell TransfectionThe small interfering RNA (siRNA)-FGF21 (si-FGF21-1, 5′-GCGGTACCTCTACACAGAT-3′; si-FGF21-2, 5′-CCTTGAAGCCGGGAGTTAT-3′) and siRNA-HDAC6 (si-HDAC6-1, 5′-CGGAGGGUCCUUAUCGUAGAUTT-3′; si-HDAC6-2, 5′-CCUCACUGAUCAGGCCAUAUUTT-3′), constructed by Guangzhou RiboBio Co, Ltd, were transfected into HUVECs by Lipofectamine 2000 reagent (Invitrogen) according to the kit's protocol. After transfection for 48 hours, HUVECs were subjected to further analyses. Real-time quantitative PCR (RT-qPCR) was conducted to verify transfection efficiency.
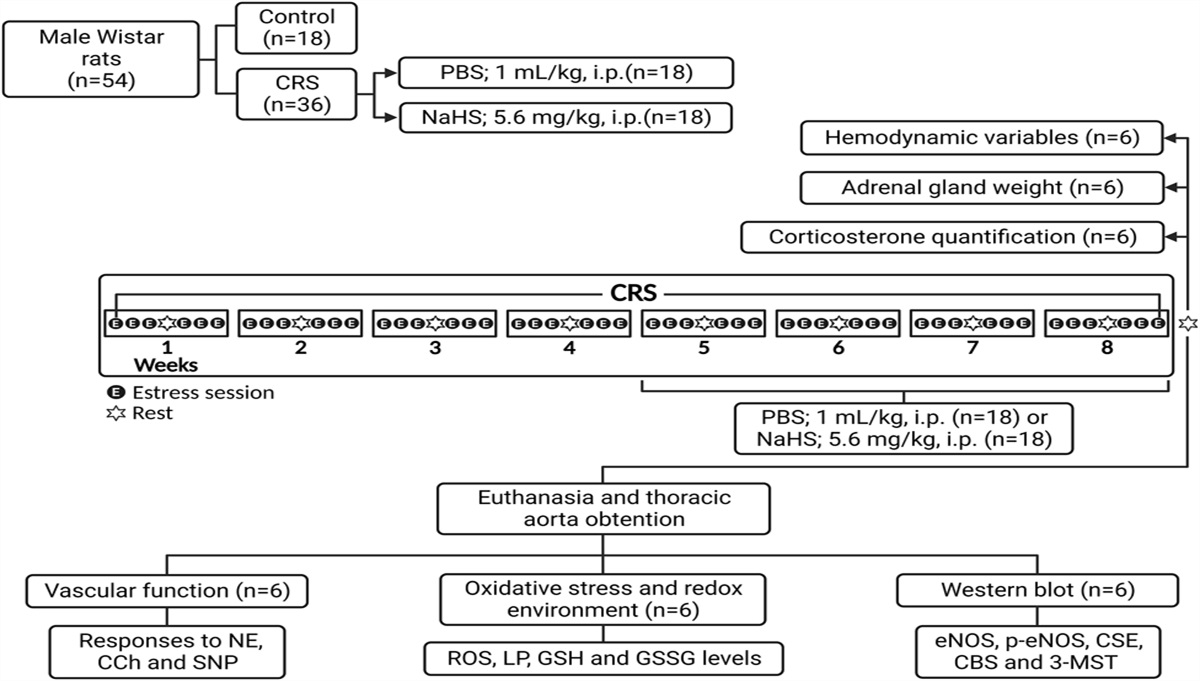
Animal TreatmentsSpecific pathogen-free (SPF) male Kunming mice (weighing 20.0 ± 2.0 g) were obtained from Guangdong Laboratory Animals Monitoring Institute (Guangzhou, China) and maintained according to the Institutional Animal Care and Use Committee (IACUC) of Guangzhou Medical College's guidelines. The study protocol was approved by the IACUC. After adaptive feeding for 1 week, the mice were randomly assigned to 4 groups (n = 15): CON group, Model group, TSA group, and selective HDAC6 inhibitor Tubastatin A (TubA) group. The Model, TSA, and TubA groups were subcutaneously injected with potassium oxonate (300 mg/kg) and intraperitoneally injected with hypoxanthine (200 mg/kg) every day at 9:00 am.34 The CON group was given the same amount of 0.5% CMC-Na solution. In the Model, TSA, and TubA groups, mice were, respectively, administered with vehicle, TSA (0.6 mg/kg/d),35 or TubA (50 mg/kg/d)36 intraperitoneally. The CON group was given the same amount of physiological saline. All experiments were repeated continuously for 14 days.
After 2 weeks of treatment, the mice were sacrificed. Then, the aorta, kidney, and liver were collected. Two-thirds of tissues were used for RNA and protein analyses, while the remaining tissues were fixed in 10% neutral-buffered formalin for histopathological evaluation.
Measurement of Blood PressureDuring the day of end of every week, the blood pressure of mice was recorded using the noninvasive tail-cuff method (COPA; Kent Scientific, Torrington, USA).37 Mice were placed into chambers on a warm platform at least 30 minutes to ensure adaption to the following procedure. Blood pressure was measured in a proper environment for 3 times, and the average value was taken.
Vascular ReactivityThoracic aortas of mice were isolated and cut into segments 2 mm in length. The aortic rings were mounted on a wire myograph (Model 620M; DMT, Copenhagen, Denmark) in 5 mL of Krebs buffer (Kanglang Biotechnology, Shanghai, China) at 37°C with 5% CO2 in O2. Changes in force generation were documented using a PowerLab data acquisition system (ADInstruments, Colorado Springs, CO). During experiments, integrity of aortas was assessed by stimulation with 60 mM of KCl. After the tension is stabilized at 2.0 mN, we add phenylephrine (Sigma–Aldrich, St. Louis, MO, USA) to the solution to precontract the vessel and the final concentration of phenylephrine was 3 µmol/L. Once the vessels reached a stable maximum tension, acetylcholine (Ach; Sigma–Aldrich) with concentration gradient (1 nM–10 µM) was added in turn. When the vasodilation of previous Ach concentration reached a relatively stable tension, we immediately added Ach solution of next concentration. Then, we released the Krebs solution and rinsed the vessels with Krebs solution for 3 times. During the last rinse, we slowly adjusted the tension to about 2.0 mN and then added phenylephrine to the final concentration of 3 µmol/L. When the vessels reached a stable maximum tension, sodium nitroprusside (SNP) from Sigma–Aldrich with concentration gradient (1 nM–10 µM) was added in turn. Once vasodilation of previous SNP concentration reached a relatively stable tension, we immediately added SNP solution of next concentration. GraphPad prism 8.0 software was used to plot the concentration effect curve and fitted the curve with S-type equation.
HistopathologyThe formalin-fixed tissues were dehydrated in a graded alcohol series, cleared in xylene, embedded with paraffin, and sectioned into 5-µm thickness. The aortic and liver sections were subjected to hematoxylin and eosin (H&E) staining. Meanwhile, the kidney sections were performed by H&E, periodic acid–Schiff (PAS), and Masson's trichrome staining. The media thickness of thoracic aortas was assessed by measuring the length of the media at 10 different positions per animal at 200× magnification. Masson's trichrome staining was used to measure renal fibrotic content. Aortic media thickness and renal fibrotic area were quantified using ImageJ software.
RT-qPCRTotal RNA was extracted from HUVECs or mouse tissues by TRIzol method (Invitrogen). cDNA synthesis was conducted using the PrimeScript RT reagent kit (TaKaRa, Tokyo, Japan). The RT-qPCR conditions were 30 seconds at 95°C, followed by 40 cycles of 5 seconds at 95°C and 30 seconds at 60°C. Levels of mRNA expression, including HDAC6, TNF-a, IL-1β, IL-6, CD31, α-SMA, and FGF21, detected by a SYBR green qPCR assay kit (TaKaRa, Japan) were calculated by 2−ΔΔCT method after normalization to GAPDH. The primer pairs are listed in Supplementary Table 1, https://links.lww.com/JCVP/A884.
Western Blot (WB) AnalysisTotal protein content was determined by BCA assay (Beyotime, Beijing, China). Then, the protein specimens were separated through 10% SDS-PAGE and transferred onto a PVDF membrane. After blocking with skimmed milk, the membrane was incubated with appropriate antibodies overnight at 4°C. The following primary antibodies were obtained from Abcam: HDAC1 (1:1000; ab109411), HDAC2 (1:1000; ab32117), HDAC3 (1:1000; ab32369), HDAC6 (1:1000; ab1440), AKT (1:1000; ab8805), p-AKT (1:500; ab38449), eNOS (1:1000; ab199956), p-eNOS (1:500; ab215717), FoxO3a (1:1000; ab70315), p-FoxO3a (1:500; ab47285), CD31 (1:1000; ab281583), α-SMA (1:1000; ab5694), and FGF21 (1:1000; ab171941). The primary antibody GAPDH (1:3000; 10494-1-AP) was purchased from Proteintech Group (Chicago, USA). After incubation with the primary antibodies, the membrane was rinsed 3 times and incubated with horseradish peroxidase–conjugated secondary antibody goat anti-rabbit immunoglobulin (1:5000; Zhongshanjinqiao, China). Finally, the membranes were visualized using an enhanced chemiluminescence kit (Beyotime Institute of Biotechnology), and their intensities were determined with ImageJ software.
HDAC Activity AssaysHDAC1 (Cat. No: GMS50082.2), HDAC2 (Cat. No: GMS50082.3), HDAC3 (Cat. No: GMS50082.4), and HDAC6 (Cat. No: GMS50082.7) activity were measured by HDAC1,2,3,6 colorimetric activity assay kit (GENMED SCIENTIFICS INC., USA) according to the kit's protocols. In brief, the nuclear extract of HUVECs was incubated with Color de Lys substrate at 37°C for 1 hour. The absorbance value was examined using a microplate reader at 405 nm. HDAC1,2,3,6 activities were calculated based on the formula provided in the kit's protocols.
Serum Biochemical AnalysisThe levels of NO (A012-1-2), UA (C012-1-1), creatinine (C011-2-1), and blood urea nitrogen (C013-2-1) in the serum were detected by special detection kits (Jiancheng Bioengineering Institute, China) according to the kit's protocols. The serum levels of FGF21 (CSB-EL008627MO), TNF-α (CSB-E04741m), and IL-6 (CSB-E04639m) were determined using the enzyme-linked immunosorbent assay (ELISA) kits (CUSABIO life Sciences, Wuhan, China) according to the kit's protocols.
Measurement of ROS ProductionThe intracellular level of reactive oxygen species (ROS) was assessed using a ROS assay kit (Jiancheng Bioengineering Institute, China; E004-1-1). In brief, HUVECs coincubated with 25 mM L-Glu and 100 µM 6-OHDA and then maintained with 10 μM dichlorofluorescein diacetate (DCFH-DA, Sigma, MO, USA) at 37°C for 0.5 hours in the dark. DCFH-DA is oxidized to produce fluorescence in the presence of ROS. The fluorescent color was determined using a fluorescence microscope with excitation and emission wavelengths at 485 and 520 nm, respectively.
ImmunofluorescenceHUVECs were fixed with 4% paraformaldehyde for 15 minutes. Subsequently, the cell membranes were permeabilized using 0.2% Triton-x 100 for 15 minutes, and anti-α-SMA antibody (1:200; ab5694) was added at a dilution of 1:200 for overnight incubation at 4°C. After rinsing with PBS, the cells were incubated with Goat Anti-Rabbit IgG H&L (Alexa Fluor 594) secondary antibody (1:200; ab150080) at room temperature for 1 hour. DAPI (Sigma-Aldrich; Merck KGaA, Darmstadt, Germany) was used to stain nuclei for 5 minutes.
Chromatin Immunoprecipitation (ChIP) AssayChromatin Immunoprecipitation Assay (Saicheng Bioengineering Institute, Guangdong, China) was used to conduct the ChIP assay by following the kit's protocol. In brief, HUVECs were cross-linked with 1% formaldehyde for 30 minutes and stopped by 1.25 M glycine solution. HUVECs were harvested and ultrasonicated to generate 400–800 bp DNA fragment (Bioruptor Pico, Diagenode). Then, 10% of the broken chromatin samples were placed into a new centrifuge tube as the input sample. The remaining part was added with 100 μL ChIP buffer, reacted with acetylated histone H3 antibody (1:100, CST, #8173) or IgG (1:100, Santa Cruz, sc2025), and then mixed with the prepared magnetic beads for an incubation at 4°C overnight. The IP and input samples were mixed with 2 mL proteinase K at 60°C for 1 hour. After precipitating and purifying ChIP-enriched DNA fragments, quantitative PCR was conducted with FGF21 forward 5′-GCCAACCTGTCTTCCCTCTG-3′ and reverse 5′-GCTCAGATGCTCAGACCCTG-3′. The values were computed relative to a calibrator (2−ΔΔCt) and normalized to the input sample.
Statistical AnalysisAll data were presented as mean ± SD and evaluated using the GraphPad Prism 8 software. Differences among groups were compared using the one-way ANOVA followed by a post hoc test. P < 0.05 was deemed statistically significant.
RESULTS High UA Promotes HDAC6 and Inhibits FGF21 Expression in HUVECsAs presented in Figure 1A, UA stimulation reduced NO level in a concentration-dependent fashion compared with the CON group (0 mg/dL UA). As shown in Figure 1B, C, UA stimulation significantly increased HDAC6 expression in a concentration-dependent fashion compared with the CON group. In addition, the protein and mRNA levels of FGF21 were remarkably downregulated after UA stimulation (Fig. 1D, E).
 FIGURE 1.:
 High UA levels stimulated HDAC6 and inhibited FGF21 expression in HUVECs. A, NO production detected by NO assay kit (n = 5). B, HDAC6 mRNA expression determined by RT-qPCR (n = 5). C, HDAC6 protein expression determined by WB analysis (n = 4). D, FGF21 mRNA level measured by RT-qPCR (n = 5). E, FGF21 protein level measured by WB analysis (n = 4). One-way ANOVA followed by Tukey's post hoc multiple-group comparisons. *P < 0.05, **P < 0.01, ***P < 0.001 versus CON; #P < 0.05, ##P < 0.01, ###P < 0.001 versus 6 mg/dL UA.
HDAC Inhibitor TSA Attenuates UA-stimulated Endothelial Injury in HUVECsTo test whether HDACs are involved in hyperuricemia pathophysiology, the HDAC inhibitor, TSA, was used in subsequent experiments. The results showed that intracellular ROS generation in UA-stimulated HUVECs was significantly inhibited by TSA administration (Fig. 2A). In addition, TSA administration notably decreased UA-induced hypersecretion of inflammatory cytokines such as TNF-α, IL-1β, and IL-6 (Fig. 2B). Besides, the nitric oxide (NO) level and the expression of endothelial nitric oxide synthase (eNOS) and AKT were detected. The results showed that NO level in HUVECs cotreated with TSA was higher than that in HUVECs stimulated with UA only (Fig. 2C). Moreover, the phosphorylated AKT and eNOS levels were upregulated by TSA treatment in a concentration-dependent fashion, while the total AKT and eNOS protein levels demonstrated no significant changes (Fig. 2G). In addition, the levels of myofibroblast marker alpha-smooth muscle actin (α-SMA) and endothelial cell marker CD31 were detected to explore the role of TSA in UA-stimulated endothelial–interstitial transformation. It was found that UA stimulation remarkably inhibited CD31 expression and enhanced α-SMA expression (Fig. 2D, E). By contrast, TSA treatment increased CD31 expression and decreased α-SMA expression (Fig. 2D–F), suggesting that TSA could inhibit UA-stimulated endothelial–interstitial transformation in HUVECs. As shown in Figure 2H–J, TSA administration significantly elevated FGF21 expression. ChIP assay demonstrated that the level of histone H3 acetylation on FGF21 promoter region was upregulated after TSA treatment. These data suggest that HDAC inhibitor may increase FGF21 expression in UA-stimulated HUVECs by enhancing the acetylated level of histone on FGF21 gene.
 FIGURE 2.:
 TSA attenuated UA-stimulated endothelial dysfunction in HUVECs. A, Representative cell morphology and ROS generation captured by a microscope (n = 3). B, TNF-α, IL-1β, and IL-6 mRNA levels determined by RT-qPCR (n = 5). C, NO production (n = 5). D, RT-qPCR analysis of CD31 and α-SMA (n = 5). E, WB analysis of CD31 and α-SMA (n = 4). F, α-SMA expression analyzed by immunofluorescence (n = 3). G, WB analysis of p-AKT/AKT and p-eNOS/eNOS (n = 4). H, RT-qPCR analysis of FGF21 (n = 5). I, WB analysis of FGF21 (n = 4). J, Level of histone H3 acetylation on the FGF21 promoter region, as analyzed by ChIP (n = 4). One-way ANOVA followed by Tukey's post hoc multiple-group comparisons. *P < 0.05, **P < 0.01, ***P < 0.001 versus CON; #P < 0.05, ##P < 0.01, ###P < 0.001 versus 12 mg/dL UA; &P < 0.05, &&P < 0.01 versus 12 mg/dL UA+TSA low.
TSA Protects HUVECs Against High UA Exposure Through FGF21/PI3K/AKT PathwayTo examine whether FGF21 can mediate the effect of TSA on UA-induced VECI, the expression of FGF21 was downregulated by siRNA-FGF21 transfection. Owing to the more significant transfection efficiency, siRNA-FGF21-1 was selected in subsequent experiments (Fig. 3A). Interestingly, FGF21 downregulation abated the inhibitory effects of TSA on TNF-α, IL-1β, and IL-6 expression levels (Fig. 3B) as well as ROS generation (Fig. 3C). More importantly, NO level and expression of p-eNOS and p-AKT in 12 mg/dL UA+TSA high+siRNA-FGF21 group were markedly lower than those in 12 mg/dL UA+TSA high group (Fig. 3D, E). Besides, FGF21 knockdown partially reversed the effect of TSA treatment on CD31 and α-SMA expression (Fig. 3F, G). These findings imply that FGF21 knockdown abrogates the protective effect of HDAC inhibitor against UA-induced VECI. TSA protected HUVECs against UA-induced VECI by upregulating FGF21 expression.
 FIGURE 3.:
 FGF21 knockdown abrogated the effects of TSA on UA-induced inflammation, oxidative stress, endothelial dysfunction, and endothelial–interstitial transformation in HUVECs. A, RT-qPCR analysis of FGF21 (n = 3). B, RT-qPCR analysis of TNF-α, IL-1β, and IL-6 (n = 4). C, ROS generation (n = 3). D, NO production (n = 5). E, Levels of p-AKT/AKT and p-eNOS/eNOS measured by WB (n = 4). F, RT-qPCR analysis of CD31 and α-SMA (n = 4). G, WB analysis of CD31 and α-SMA (n = 4). One-way ANOVA followed by Tukey's post hoc multiple-group comparisons. *P < 0.05, **P < 0.01, ***P < 0.001 versus CON; ###P < 0.001 versus 12 mg/dL UA; $$P < 0.01, $$$P < 0.001 versus 12 mg/dL UA+TSA high; &P < 0.05, &&P < 0.01, &&&P < 0.001 versus 12 mg/dL UA+TSA high+NC.
To further investigate the involvement of PI3K/AKT pathway, the PI3K inhibitor LY294002 was added into the ECM. After the addition of LY294002, the promotion of NO level and suppression of inflammatory cytokine mRNA expression levels by TSA were significantly reversed (Fig. 4A, B). In addition, LY294002 significantly inhibited phosphorylation of AKT, eNOS, and FoxO3a (Fig. 4C). As presented in Figure 4D, LY294002 significantly reversed the effects of TSA on protein expression of CD31 and α-SMA but did not influence FGF21 expression in HUVECs. These data indicated that the activation of FGF21/PI3K/AKT pathways may mediate the protective effects of TSA on HUVECs.
 FIGURE 4.:
 LY294002 abrogated the effects of TSA on UA-induced vascular endothelial cell injury in HUVECs. A, NO production (n = 5). B, Levels of TNF-α, IL-1β, and IL-6 detected by RT-qPCR (n = 5). C, WB analysis of p-AKT/AKT, p-eNOS/eNOS, and p-FoxO3a/FoxO3a (n = 4). D, WB analysis of FGF21, CD31, and α-SMA (n = 4). One-way ANOVA followed by Tukey's post hoc multiple-group comparisons. *P < 0.05, **P < 0.01, ***P < 0.001 versus CON; ##P < 0.01, ###P < 0.001 versus 12 mg/dL UA; $P < 0.05, $$P < 0.01, $$$P < 0.001 versus 12 mg/dL UA+TSA high; &&&P < 0.001 versus 12 mg/dL UA+TSA high+ LY294002.
TSA Increases FGF21 Expression in UA-stimulated HUVECs by Inhibiting HDAC6 ActivityTo identify HDAC that mediates the protective effect of TSA, the activities of HDAC1, HDAC2, HDAC3, and HDAC6 in HUVECs were measured. Mocetinostat, an isoform-selective HDAC inhibitor, which specifically inhibits HDAC1, HDAC2, and HDAC3, was used to evaluate whether HDAC1-3 can mediate the protective effect of TSA. As shown in Figure 5A, the activities of HDACs, including HDAC1, HDAC2, HDAC3, and HDAC6, were remarkably higher in the UA group than in the CON group. TSA treatment markedly decreased the activities of HDAC1, HDAC2, HDAC3, and HDAC6, while Mocetinostat treatment did not influence HDAC6 activity. There was no difference in TNF-α, IL-1β, and IL-6 expression and NO level between 12 mg/dL UA and 12 mg/dL UA+Mocetinostat groups (Fig. 5B, C). More importantly, compared with the 12 mg/dL UA group, Mocetinostat treatment did not increase the expression level of FGF21 (Fig. 5D, E). ChIP assay showed that there was no significant difference in histone H3 acetylation on FGF21 promoter region between 12 mg/dL UA and 12 mg/dL UA+Mocetinostat groups (Fig. 5F). Thus, it can be inferred that HDAC1, HDAC2, and HDAC3 do not mediate the protective effect of TSA.
 FIGURE 5.:
 Different from TSA, Mocetinostat, a class-Ⅰ selective HDAC inhibitor did not attenuate UA-stimulated endothelial dysfunction in HUVECs. A, HDAC1,2,3,6 activity detected by HDAC kits (n = 5). B, TNF-α, IL-1β, and IL-6 mRNA level detected by RT-qPCR (n = 5). C, NO production (n = 5). D, RT-qPCR analysis of FGF21 (n = 5). E, WB analysis of FGF21 (n = 4). F, Level of histone H3 acetylation on the FGF21 promoter region, as analyzed by ChIP (n = 4). One-way ANOVA followed by Tukey's post hoc multiple-group comparisons. *P < 0.05, **P < 0.01, ***P < 0.001 versus CON; #P < 0.05, ##P < 0.01, ###P < 0.001 versus 12 mg/dL UA; $P < 0.05, $$P < 0.01, $$$P < 0.001 versus 12 mg/dL UA+TSA high.
HDAC6-siRNA was used to knock down HDAC6 mRNA in HUVECs to further confirm the role of HDAC6 in regulating the protective effects of HDAC inhibitors. SiRNA-HDAC6-1 was selected in subsequent experiments (Fig. 6A). After transfection with siRNA-HDAC6-1, HDAC6 activity decreased significantly (Fig. 6C). HDAC6 downregulation abated the effect of UA on the expression of inflammatory markers in HUVECs (Fig. 6B). At the same time, NO level and the expression levels of p-AKT, p-eNOS, and p-FoxO3a in 12 mg/dL UA+siRNA-HDAC6 group were higher than that in the 12 mg/dL UA group (Fig. 6D, F). Besides, HDAC6 knockdown partially reversed the effect of UA on CD31 and α-SMA expression (Fig. 6G). More importantly, compared with 12 mg/dL UA+NC group, the protein expression of FGF21 was significantly increased in the 12 mg/dL UA+siRNA-HDAC6 group (Fig. 6E). These data imply that HDAC6 downregulation has an effect similar to TSA treatment, and HDAC6 can mediate the protective effect of TSA.
 FIGURE 6.:
 HDAC6 knockdown alleviated UA-induced inflammation, oxidative stress, endothelial dysfunction, and endothelial–interstitial transformation in HUVECs. A, HDAC6 mRNA level measured by RT-qPCR (n = 3). B, Levels of TNF-α, IL-1β, and IL-6 detected by RT-qPCR (n = 5). C, HDAC6 activity (n = 5). D, NO production (n = 5). E, WB analysis of FGF21 (n = 4). F, WB analysis of p-AKT/AKT, p-eNOS/eNOS, and p-FoxO3a/FoxO3a (n = 4). G, WB analysis of CD31 and α-SMA (n = 4). One-way ANOVA followed by Tukey's post hoc multiple-group comparisons. *P < 0.05, **P < 0.01, ***P < 0.001 versus CON; ##P < 0.01, ###P < 0.001 versus 12 mg/dL UA; $$P < 0.01, $$$P < 0.001 versus 12 mg/dL UA+NC.
TSA Treatment Attenuates Aorta and Kidney Injury in Hyperuricemia MiceConsistent with the in vitro experiments, in vivo data indicated that HDACs, especially HDAC6 inhibitor, could attenuate UA-induced aortic and renal injury. As illustrated in Figure 7A, compared with the CON group, systolic blood pressure in the Model group slightly increased. There was no difference in diastolic blood pressure between groups. As presented in Figure 7B, C, serum UA in the Model, TSA, and TubA groups was higher than that in the CON group, while serum NO was remarkably decreased in the Model group. After TSA or TubA administration for 4 consecutive weeks, the serum level of NO was significantly increased. There was no difference in serum FGF21 levels between the Model and CON groups, while TSA or TubA treatment significantly elevated serum FGF21 level (Fig. 7D). Moreover, TSA or TubA treatment notably decreased hyperuricemia-induced high levels of inflammatory cytokines in both serum and aorta tissue (Fig. 7E, F). The aorta from Model group had more severe damage in endothelium-dependent relaxation after Ach treatment compared with the CON group. This effect was reversed by TSA and TubA treatment. However, there was no difference in endothelium-independent relaxation between the study groups after SNP treatment (Fig. 7G). The histopathological analysis revealed that the structure of aorta was clear, with a tight arrangement of endothelial cells in the CON group, and there was no inflammatory cell aggregation in the vessel wall. Besides, edematous endothelial cells exhibited foam-like changes, while media thickness of thoracic aorta increased and structural disorder were observed in the Model group. However, compared with the Model group, the histopathological lesions were less severe in the TSA or TubA group. Smooth muscle cell proliferation was not obvious in the TSA or TubA group, and the cell structures were arranged in an orderly pattern (Fig. 7H). The results of Western blot showed that hyperuricemia upregulated the expression of HDAC1, HDAC3, and HDAC6 and had no obvious effect on HDAC2 expression in aorta tissues. TSA treatment reduced HDAC1,2,3,6 levels, while TubA could only reduce HDAC6 expression in aorta (Fig. 7I). AKT, eNOS, and FoxO3a phosphorylation levels in the Model group were all remarkably decreased compared with the CON group and significantly increased after TSA or TubA treatment (Fig. 7J). The levels of FGF21 and CD31 in the Model group were significantly decreased compared with those in the CON group. On the contrary, TSA or TubA administration dramatically increased the expression levels of CD31 and FGF21 (Fig. 7K).
 FIGURE 7.:
 TSA or TubA alleviated aortic inflammation and dysfunction in hyperuricemic mice. A, Blood pressure between the groups (n = 15). B, Serum UA (n = 7–8). C, Serum NO (n = 8). D, Serum FGF21 (n = 7–8). E, Serum TNF-α and IL-6 (n = 7–8). F, Levels of TNF-α and IL-6 mRNA in aorta tissue were determined by RT-qPCR (n = 5). G, Vasorelaxant responses to Ach and SNP in mice aortic rings precontracted with phenylephrine (n = 5). H, Representative images of mice aorta histopathology through H&E staining (magnification × 200) and used for analysis of media thickness. I, WB analysis of HDAC1, 2, 3, and 6 in aorta tissue (n = 5). J, WB analysis of p-AKT/AKT, p-eNOS/eNOS, and p-FoxO3a/FoxO3a in aorta tissue (n = 5). K, WB analysis of FGF21, CD31, and α-SMA in aorta tissue (n = 5). One-way ANOVA followed by Tukey's post hoc multiple-group comparisons. *P < 0.05, **P < 0.01, ***P < 0.001 versus CON; #P < 0.05, ##P < 0.01, ###P < 0.001 versus model; $P < 0.05, $$P < 0.01 versus TSA.
It was found that both serum urea nitrogen (BUN) and creatinine (CRE) increased significantly in the Model group (Fig. 8A, B). TSA or TubA treatment dramatically reduced the levels of CRE and BUN, suggesting that TSA or TubA could effectively alleviate hyperuricemia-induced kidney injury. Similar to the effect on aorta, TSA or TubA treatment significantly reversed the high levels of inflammatory cytokines in renal tissue (Fig. 8C). Histological alterations of the kidney tissues were comprehensively examined by H&E, Masson's trichrome, and PAS staining (Fig. 8D). H&E and PAS staining of the kidney tissues in the Model group revealed obvious tubular damage and apoptosis, including tubular dilation and cell necrosis. Masson's staining showed that the fibrous tissue in the model group was increased compared with the CON group. The histopathological abnormalities of the kidneys were improved after TSA or TubA administration. As similar to the effect of hyperuricemia on aorta, HDAC1,3,6 protein levels in renal tissues were upregulated in the Model group. TSA downregulated HDAC1,3,6 protein levels, while TubA only alleviated HDAC6 expression (Fig. 8E). In addition, TSA or TubA enhanced the phosphorylation levels of AKT, eNOS, and FoxO3a as well as promoted the expression of CD31 and FGF21 in kidney tissues (Fig. 8F, G). Altogether, these findings underscored hyperuricemia-induced inflammation and injury in aorta and kidney tissue and downregulated expression of FGF21. Consistent with the results of in vitro experiment, TSA or TubA treatment could significantly alleviate the injury of these organs and promote the expression of FGF21.
 FIGURE 8.:
 TSA or TubA alleviated renal inflammation and dysfunction in hyperuricemic mice. A, Serum BUN (n = 7–8). B, Serum CRE (n = 8). C, RT-qPCR analysis of TNF-α and IL-6 in renal tissues (n = 5). D, Representative images of mice renal tissue stained by H&E, Masson, and PAS (magnification × 200), and percentage of fibrotic area was analyzed. E, WB analysis HDAC1, 2, 3, and 6 (n = 5). F, WB analysis of p-AKT/AKT, p-eNOS/eNOS, and p-FoxO3a/FoxO3a (n = 5). G, WB analysis of FGF21, CD31, and α-SMA (n = 5). One-way ANOVA followed by Tukey's post hoc multiple-group comparisons. *P < 0.05, **P < 0.001, ***P < 0.001 versus CON; #P < 0.05, ##P < 0.01, ###P < 0.001 versus model; $P < 0.05, $$P < 0.01 versus TSA.
There were no obvious histopathological changes in the liver tissue of mice in each group, as examined by H&E staining (Supplementary Fig. 1A, https://links.lww.com/JCVP/A883). Different from aorta and kidney tissues, there was no difference in hepatic FGF21 expression between the CON and model groups, while TSA and TubA treatment significantly enhanced FGF21 expression in the liver (Supplementary Figure 1B, https://links.lww.com/JCVP/A883).
DISCUSSIONOur results, for the first time, demonstrated that HDAC inhibitor could alleviate UA-induced endothelial dysfunction both in vitro and in vivo. Hyperuricemia plays a pathogenic role in the occurrence of cardiovascular and renal diseases through endothelial inflammation and dysfunction.38 Upregulation of HDACs has been reported to be a harbinger of uremic endothelial dysfunction.39 However, the roles of HDACs in hyperuricemia remain unclear. Our results showed that TSA treatment significantly decreased UA-induced endothelial dysfunction, which uncovered a remarkable endothelial protective effect of HDAC inhibitors against hyperuricemia. However, the mechanisms behind the therapeutic benefit of HDAC inhibitors remain obscure. It is speculated that this protective effect of TSA may depend on the upregulated expression of FGF21 through inhibiting HDAC6 activity.
In this study, it was observed that UA stimulation led to the reduced expression of FGF21, and TSA recovered FGF21 expression in UA-stimulated HUVECs. FGF21 is an essential metabolic regulator which have been proved to protect vascular endothelial cells against oxidative stress–induced injury.40 Emerging evidence revealed that FGF21 is a key factor in maintaining energy homeostasis and regulating systemic glucose and lipid metabolism.41,42 Overexpression of FGF21 in endothelial cells can reduce oxidative stress and improve endothelial function.43 As for the role of FGF21 in UA-induced VECI, Rong and coworkers demonstrated that FGF21 could attenuate high UA-induced endothelial.43 Our results demonstrated that FGF21 knockdown abrogated the suppressive effect of TSA on inflammatory factor release and ROS generation. Moreover, FGF21 knockdown aggravated UA-induced endothelial dysfunction and endothelial–interstitial transformation. Hence, TSA alleviated UA-induced VECI through upregulating FGF21 expression. Our study showed that the increased acetylation level of histone H3 on FGF21 promoter region after TSA treatment, which may reveal the mechanism by which TSA enhances FGF21 expression in HUVECs.
Other studies have demonstrated that FGF21 could activate PI3K/AKT signaling in HUVECs.44,45 AKT is a serine/threonine protein kinase in mediator of PI3K/AKT signaling pathway, leading to the phosphorylation of multiple downstream molecules,46 and plays critical and diverse roles in the cardiovascular system.46,47 PI3K/AKT pathways act as a positive regulator of endothelial NO synthase in endothelial cells. As a key enzyme, eNOS plays a crucial role in the generation of NO.48 Phosphorylated PI3K/AKT can directly phosphorylate eNOS and then induce NO generation.49 NO maintains vascular homeostasis through influences on vascular protection, including antioxidant, anti-inflammatory and antiproliferative effects.50 Abnormal release of NO results in endothelial dysfunction.51 PI3K/AKT/eNOS axis has been shown to orchestrate protective effects on endothelial dysfunction.49,52 FoxO3a, one of the FoxO family members, is another important do
留言 (0)