
記住我


KEY POINTS
Question: Is frailty as assessed by the FRAIL (fatigue, resistance, ambulation, illness, and loss of weight) scale associated with mortality and postoperative outcomes in older surgical patients? Findings: Frailty as measured by the FRAIL scale was associated with 30-day mortality, 6-month mortality, postoperative complications, and postoperative delirium. Meaning: The FRAIL scale is a useful tool for preoperative screening for frailty of older adults before surgery.Frailty is a clinical state of increased vulnerability due to age-associated decline in physiological reserve, resulting in compromised ability to cope with external everyday or acute stressors. Frailty before surgery is associated with increased risk of mortality and postoperative complications and various long-term negative outcomes, including falls, lower quality of life, and disability.1,2 Although there are many screening tools for frailty that predict adverse outcomes in older surgical patients,3 most were developed for in-person evaluation. The pandemic has accelerated the adoption of virtual (online and telephonic) care for preoperative assessments, precluding the use of screening tools that require in-person evaluation.
In 2008, the FRAIL (fatigue, resistance, ambulation, illness, and loss of weight) scale was conceptualized by the International Association of Nutrition and Aging task force.4 The FRAIL scale is based on the Fried frailty phenotype, which includes 5 components: loss of weight, self-reported exhaustion, grip strength, slow walking speed, and low physical activity.5 The Fried frailty phenotype assessment is conducted in-person by a clinician and takes approximately 10 minutes. The FRAIL scale is a 5-item, self-reported questionnaire using yes/no questions that allows for rapid identification of frail and prefrail individuals.6,7 The FRAIL scale (Appendix 1) assesses frailty based on 5 components: fatigue, resistance (ability to climb stairs), ambulation (ability to walk a certain distance), illness, and loss of weight.7 Each of the components is scored with 1 point for presence or 0 for absence, for a total score ranging from 0 to 5. A score of 0 indicates nonfrail, 1 to 2 indicates that the individual is prefrail, and a score of 3 to 5 indicates frailty. The FRAIL scale can be administered in a few minutes, either over the telephone by clinicians or self-administered, and does not require specialized tools or equipment5 or in-person clinician assessments.8 In 2012, the FRAIL scale was validated to correlate with Instrumental Activities of Daily Living (IADLs) and mortality in a study of 998 Black adults between 49 and 65 years of age, of whom 7.5% participants were classified as frail.7 A longitudinal study of 10,412 women found frailty, as measured with the FRAIL scale, to increase with age, from 5.8% at 50 years of age to 11.3% at 66 years of age.9 Given the evidence of greater risk of adverse outcomes for frail older adults undergoing surgery, there is a need for accurate, easy-to-administer frailty screening tools.
While increased frailty as assessed by the FRAIL scale has been significantly associated with higher mortality risk in community-dwelling adults,9–11 the association between the FRAIL scale and mortality and postoperative outcomes in older surgical patients is not known. The objective of this systematic review and meta-analysis (SRMA) was to determine the association of frailty as assessed by the FRAIL scale with postoperative outcomes, including mortality, postoperative complications, delirium, length of stay (LOS), and functional and cognitive recovery of older surgical patients.
METHODSThis SRMA was conducted according to the Cochrane Handbook and in compliance with the Preferred Reporting Items for Systematic Reviews and Meta-Analyses (PRISMA) guidelines.12,13 The protocol was registered at the International Prospective Register of Systematic Reviews (PROSPERO; registration No. CRD42021261745) on July 18, 2021.
Study SelectionWe included randomized controlled trials, quasi-experimental studies (nonrandomized controlled trials), and observational studies (prospective and retrospective). Studies were included if participants underwent any surgical procedures, elective or emergency, and if they reported one or more of the outcomes of interest (mortality, LOS, functional recovery, delirium, or postoperative complications). Postoperative complications included cardiovascular, respiratory, infectious, renal failure, and neurological. Studies were excluded if they were case reports, reviews, qualitative studies, abstracts, or protocols, or if they were not published in English.
Information SourcesWith the assistance of an information specialist (M.E.), systematic searches were performed in multiple literature databases, including Medline, Medline ePubs/In-process citations, Embase, APA (American Psychological Association) PsycInfo, Ovid Emcare Nursing (all via the Ovid platform), Cumulative Index to Nursing and Allied Health Literature (CINAHL) EbscoHost, the Web of Science (Clarivate Analytics), and Scopus (Elsevier). If more data were required or if information was unclear, study authors were contacted for clarification.
Search StrategyAll databases were initially searched from January 1, 2012, to May 4, 2021, as the validation study was published in 2012.7 This was the first incidence in which the FRAIL scale was used in a sample of participants. A secondary search was performed on July 7, 2021, from January 1, 2008, to December 31, 2011, after we realized the conceptualization of the 5-item FRAIL scale was published in 2008.6 An updated search was performed on December 17, 2021. Citation searching of the validation study7 was conducted on the Web of Science and Scopus. The searches used both controlled vocabulary and text word searching (Supplemental Digital Content 1, Supplemental File 1, https://links.lww.com/AA/E93). The searches comprised concept blocks of terms: perioperative/surgery, elderly, and Frail scale.
Data ExtractionAll studies identified via the search strategy were uploaded into Covidence and deduplicated. Two blinded reviewers (S.G. and D.Q.) independently screened the studies for titles and abstracts using Covidence (Covidence.org). Studies that could not be included based on title and abstract were moved for full-text review. Full-text screening, data extraction, and quality assessment were performed by 2 reviewers (S.G. and D.Q.), and a third reviewer (J.W.) resolved any discrepancies. Studies during the full-text review that did not meet all inclusion criteria were excluded, and a reason for exclusion was identified, such as reasons including but not limited to wrong study population, wrong intervention, or wrong outcome.
A standardized form was used for data extraction of the included studies. Extracted information included: study identification (author, setting, and country), study methods and design, and study population (inclusion and exclusion criteria, the total number of study participants, mean age of participants, type and urgency of surgery, and percentage of male participants). The prevalence of frailty was based on the percentage of participants identified as frail (3–5 points of 5 on the FRAIL scale), prefrail (1–2 points), and nonfrail (0 points) via the FRAIL scale.7
Table 1. - Summary Table of Included Studies Study, year, country Study design N Age % Male Type of surgery Urgency of surgery Comparators used % Frail (FRAIL scale) Arteaga et al,23 2020, Spain Prospective cohort 92 78.7 (6.3) 46.7 Abdominal Emergency CFS, TRST, SHARE-FI 14.1 Berastegui Garcia et al,37 2020, Spain Prospective cohort 200 78.2 (4.6) 56 Aortic valve Elective N/A 18.5 Chen,37 2021, China Prospective cohort 229 71.2 (4.8) 61.7 Pulmonary resections Elective N/A 28.2 Duchnowski et al,33 2020, Poland Prospective cohort 672 64 (12) 57 Cardiac valve Elective N/A 3.27 Gleason et al,21 2017, United States Retrospective cohort 175 82.3 (7.4) 25.1 Orthopedic trauma Emergency N/A 41.7 Hosler et al,27 2019, United States SAVR Prospective cohort 91 77.8 (5.3) 56 SAVR Elective CFS 40.1 Hosler et al,27 2019, United States TAVR Prospective cohort 137 84.5 (5.8) 48.2 TAVR Elective CFS 42.3 Mahanna-Gabrielli et al,31 2020, United States Prospective cohort 167 70a 44.9 Major noncardiac Elective N/A 18.6 Miguelena-Hycka et al,25 2019, Spain Prospective cohort 120 76.6 (4.2) 75.8 Cardiac Elective Fried frailty scale, CFS 12.4 Pedemonte et al,36 2021, United States Prospective cohort 558 80.16 (7.49) 29.6 Orthopedic Elective N/A 22.6 Rothrock et al,29 2019, United States Prospective cohort 100 71 (4.0) 63 Spinal Elective N/A 18 Sanchez, 2020, Spain Prospective cohort 446 78a 44.4 Abdominal Emergency N/A 13.2 Sokas et al,26 2020, United States Prospective cohort 230 70.1 (7.1) 47.6 Abdominal Elective N/A 22.2 Susano et al,28 2020, United States Prospective cohort 219 75a 57 Spinal Elective N/A 24 Tejiram et al,30 2021, United States Prospective cohort 58 74a 48.2 Trauma Emergency CFS, FI 18.5 Torrez-Perez,38 2021, Spain Prospective cohort 117 58.9 (13.9) 50.4 Brain tumor Elective Tillburg frailty scale 18.8 Valdatta et al,22 2019, Italy Retrospective cohort 587 80.3a 58.4 nonmelanoma skin cancer Elective N/A 63.7 Wang et al,34 2018, Canada Prospective cohort 87 72.0 (9.0)a 34.5 Total joint replacement Elective CFS, 22.9 Yin,32 2020, China Prospective cohort 194 79 (14)a 46.4 Abdominal Elective CFS, FI 43.8Abbreviations: CFS, Clinical Frailty Scale; FI, frailty index; FRAIL, fatigue, resistance, ambulation, illness, and loss of weight; IQR, interquartile range; SAVR, surgical aortic valve replacement; SD, standard deviation; SHARE-FI, Survey of Health, Ageing and Retirement in Europe frailty instrument; TAVR, transcatheter aortic valve replacement; TRST, Triage Risk Screening Tool.
aMean age (SD) unavailable; median age (IQR) presented if possible
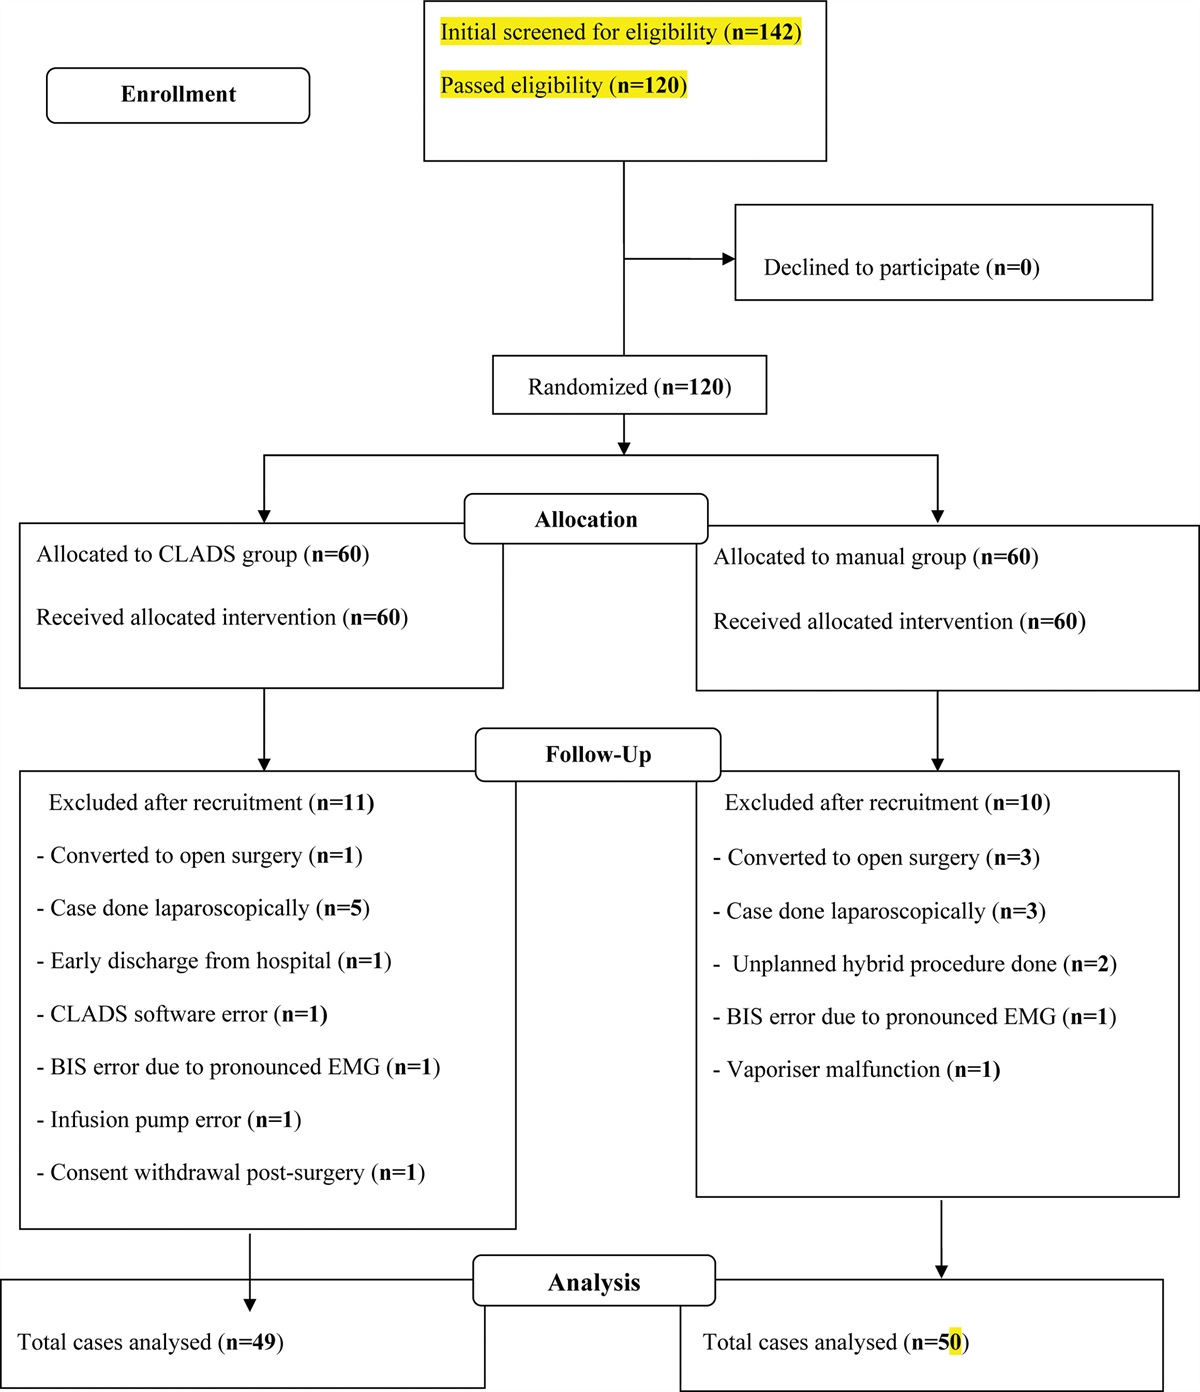
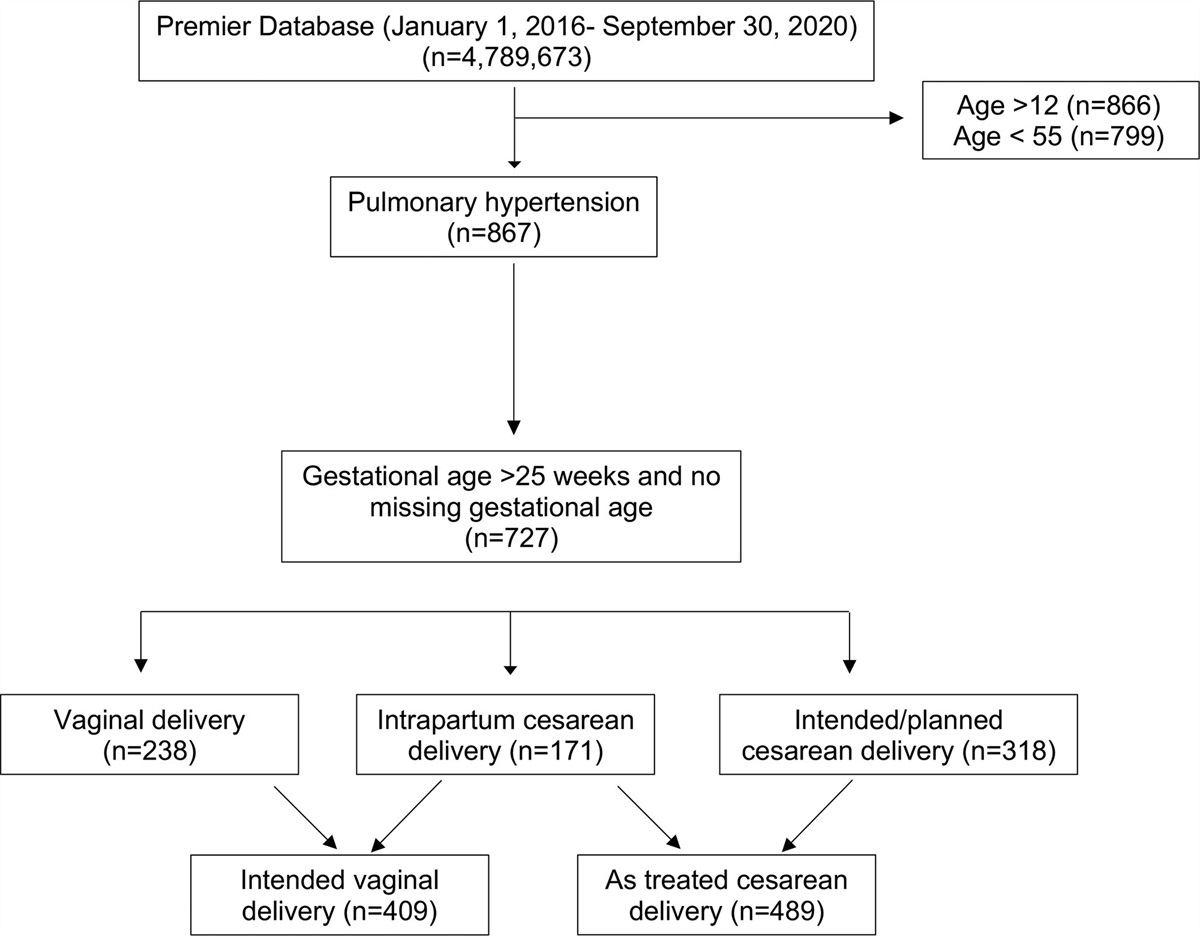
 Figure 1.:
 PRISMA flowchart of included studies. PRISMA indicates Preferred Reporting Items for Systematic Reviews and Meta-Analyses.
Table 2. - Mortality Outcomes of Studies That Reported Mortality Study, year % Frail % Prefrail 30-d Mortality 90-d Mortality 6-mo Mortality 1-y Mortality Arteaga et al,23 2020 14.1 NR OR, 16.07 (3.65–70.85) NR NR NR Berastegui Garcia et al,37 2020 18.5 67.5 NR NR OR, 2.44 (1.18–5.04) OR, 1.34 (0.64–2.81) Duchnowski et al,33 2020 3.27 9 OR, 2.802 (1.28–6.16) NR NR NR Gleason et al,21 20172017 41.7 41.7 OR, 5.90 (0.65–53.50) NR NR NR Hosler et al,27 SAVR 2019 40.1 NR NR NR NR OR, 1.42 (0.13–17.07) Hosler et al,27 TAVR 2019 42.3 NR NR NR NR OR, 1.79 (0.77–4.13) Miguelena-Hycka et al,25 2019 12.4 64 NR NR OR, 1.47 (0.29–7.35) NR Pedemonte et al,36 2021 22.6 38.9 OR, 8.59 (2.24–32.89) OR, 7.26 (2.89–18.25) NR NR Tejiram et al,30 2021 18.5 NR NR NR NR OR, 1.75 (0.20–10.58) Torrez-Perez,38 2021, 18.8 NR NR NR 5.76 (2.05–16.22) NR Valdatta et al,22 2019 63.7 29 OR, 19.70 (1.18–329.28) NR OR, 19.70 (1.18–329.28) NR Yin,32 2020 43.8 34 NR OR, 2.01 (1.28–3.17) NR NRAbbreviations: NR, not reported; OR, odds ratio (with 95% confidence interval); SAVR, surgical aortic valve replacement; TAVR, transcatheter aortic valve replacement.
 Figure 2.:
 Forest plots of association of frailty with mortality outcomes at 30 d, 6 mo, and 1 y after surgery. A, Association of frailty with 30-d mortality. B, Association of frailty with 6-mo mortality. C, Association of frailty with 1-y mortality. CI indicates confidence interval; OR, odds ratio.
 Figure 3.:
 Forest plots of association of frailty with other postoperative outcomes. A, Association of frailty with postoperative complications (all causes). B, Association of frailty with postoperative delirium. CI indicates confidence interval; OR, odds ratio.
Primary and secondary outcomes were also extracted via standardized forms. The primary outcome was mortality, with no restrictions placed on the time frame. The secondary outcomes included postoperative complications, postoperative delirium, LOS, and functional recovery. Postoperative complications included cardiovascular, respiratory, infectious, and renal failure after surgery. Delirium was described by validated assessment tools such as the confusion assessment method (CAM) after surgery. Functional recovery was defined as any improvement in condition after surgery via improvement in physical function or returning to preoperative levels of activities of daily living (ADLs). LOS included any time measurement from surgery to discharge.
Risk of Bias AssessmentTwo authors (S.G. and D.Q.) independently used the quality in prognosis studies (QUIPS) tool recommended by the Cochrane prognosis methods group to assess risk of bias.14 Disagreements were resolved by a third author (J.W.). A standardized form was used to rate each study, with various items clustered to 6 domains. Each domain scored bias as high, moderate, or low. The following domains were scored: study participation, study attrition, prognostic factor measurement, outcome measurement, study confounding, and statistical analysis and reporting.
Data SynthesisFor the meta-analyses, studies were pooled according to the outcome assessed if ≥3 studies identified the same health outcome. All outcomes were binary, and study populations were stratified as either frail (score of 3–5) or nonfrail. Scores of 0 (nonfrail) and 1 to 2 (prefrail) were considered nonfrail. Odds ratios (ORs) for frail versus nonfrail patients were calculated if not reported in the primary studies. The estimated results were graphically represented as forest plots. When ORs were not available, raw data were used to calculate the OR and the 95% confidence interval (CI). ORs were calculated using a specific calculator for studies with 0 events in the exposed or unexposed group, for which a constant of 0.5 was added to all cells.15 Random-effects estimates with compound symmetry covariance structures were produced due to the likelihood of high heterogeneity across the studies. The included studies were not stratified via surgery type and setting (emergency versus elective). Heterogeneity due to variation across the studies was assessed using the I2 statistic, for which high heterogeneity was noted when the I2 statistic was >75%. The meta-analysis evaluated the ORs for outcomes of interest. Statistical significance was considered when the P value was <.05. Data analysis was performed with R software using the packages meta and metafor.16–18
Confidence in Cumulative EvidenceThe final results were summarized into a Grading of Recommendations Assessment, Development and Evaluation (GRADE) evidence profile.19,20 The quality of evidence was assessed across the domains of risk of bias, consistency, directness, precision, and publication bias. The overall quality was rated as 1 of the 4 following levels of evidence: high (additional research is very unlikely to change our confidence in the estimated effect), moderate (additional research is likely to have an important impact on our confidence in the estimated effect and may change the estimate), low (additional research is very likely to have an important impact on our confidence in the estimated effect and is likely to change the estimate), or very low (very uncertain about the estimated effect).
RESULTSA total of 18 studies with 4479 participants21–38 were included after screening 7800 citations and 85 full-text articles (Figure 1). An additional 4 studies were found to match our inclusion and exclusion criteria39–42; however, they were missing necessary data for our analysis (ie, percent frail)39–41 or used the same population as a previously published study.42 Authors were contacted for additional data, and studies were excluded if authors did not respond or provide the additional data. All were observational studies with 16 prospective23–38 and 2 retrospective cohort studies (Table 1).21,22 The sample size varied from 58 to 672. The mean age was 74.8 years (6.54), and 49.48% were male. Five studies were from Spain,23–25,35,38 8 were from the United States,21,26–31,36 and other studies were from China,32,37 Canada,34 Poland,33 and Italy.22 The common types of surgery were abdominal,23,24,26,32 cardiac,25,33,35 and spinal.28,29 Fifteen studies were elective, and 4 were emergency surgeries.21,23,24,30 The total prevalence of frailty as measured by the FRAIL score (>2) across the 18 studies was 30% (95% CI, 0.29–0.32).
MortalityMortality was assessed in 11 studies (n= 3001), with 5 reporting 30-day mortality,21–23,32,35 2 reporting 90-day mortality,32,36 3 reporting 6-month mortality,25,35,38 and 3 reporting 1-year mortality (Table 2).27,30,35 Five studies (n = 2084) were pooled for 30-day mortality, and greater frailty was significantly associated with mortality outcomes (OR, 6.62 [95% CI, 2.80–15.61]; P < .01; I2 = 39.5%; Figure 2A).21–23,32,35 Greater frailty at 6 months in 3 studies (n = 437) was also significantly associated with mortality (OR, 2.97 [95% CI, 1.54–5.72]; P < .01; I2 = 20%; Figure 2B).25,35,36 For 1-year mortality, 3 studies (n = 486) were pooled, and frailty based on the FRAIL scale was nonsignificantly associated with an OR of 1.54 (95% CI, 0.91–2.58; P = .11; I2 = 0%; Figure 2C).27,30,35
Postoperative ComplicationsPostoperative complications were reported in 6 studies (n = 1403), with all studies indicating greater risk of postoperative complications for patients who were assessed to be frail.21–23,25,35,37 We reported postoperative complications as defined by the primary study. Primary studies defined postoperative complications differently. Studies used the Clavien-Dindo classification, or they defined complications as one morbidity or a collection of morbidities relating to respiratory, renal, vascular, or neurological complications. Meta-analysis of 6 studies (n = 1403) showed an OR of 3.110 (95% CI, 2.06–4.68; P < .01; I2 = 26.8%) for frail participants compared to nonfrail participants (Figure 3A).21–23,25,35,37
Length of StayLOS was reported in 2 studies (n = 281).31,33 One study found that frail patients were more likely to experience longer LOS.31 The proportion of patients who remained hospitalized after elective abdominal surgery at 90-day follow-up was higher in frail versus nonfrail patients (23.1% vs 1.0%; P < .001).31 Another study found that the FRAIL scale was not significantly associated with hospital LOS in patients undergoing elective joint replacement.33
Functional OutcomesTwo studies (n = 328) assessed functional outcomes through composite functional status scores using ADLs and IADLs.27,29 One study found that 66.7% of frail patients had recovered to their functional baseline at 3 months after surgery compared to 76.9% of robust patients.29 Two studies (n = 616) assessed the risk of falls.25,29 One study found the FRAIL scale to have the highest specificity (90%), but the lowest sensitivity (29.2%) in predicting falls compared to the Clinical Frailty Scale (CFS) and trauma-specific frailty index. Higher frailty rating was associated with increased odds of a fall.30 Another study found both frail (25.9%) and prefrail (26.9%) parti
留言 (0)