


記住我
Quantitative MRI (QMRI) measures physical tissue values, related to the nuclear spin of protons in water. It includes the T1-, T2-, T2*-, T1ρ -relaxation times and the proton density. The respective parameter maps provide quantitative parameter values for each voxel, which carry information about the corresponding structural environment of the protons. QMRI can be used to assess microstructural alterations related to tissue remodeling and has emerged as valuable imaging modality for myocardial and hepatic tissue characterization (1, 2). QMRI has been incorporated in standardized diagnostic clinical protocols in various pathologies, including inflammatory cardiomyopathies (3), amyloidosis (4), Anderson-Fabry disease (5) and iron overload (1, 2, 6). It has also been proposed by both the European Association for the Study of the Liver and the American Association for the Study of Liver Disease as a non-invasive diagnostic tool for tissue characterization in Non-alcoholic Fatty Liver Disease (NAFLD) (7, 8). QMRI facilitates direct quantitative comparison of tissue maps in the same individual with chronic disease over time and allows more accurate longitudinal monitoring of the disease, thereby enabling an individualized characterization and more objective patient assessment.
Cardiometabolic disease, which describes a clustering of disorders that touch upon the interface between cardiovascular disease (hypertension, atherosclerosis) and metabolic disease states (insulin resistance, diabetes, adiposity, NAFLD) (9), is a chronic disease state and a major cause of morbidity worldwide. The reported prevalence is 33–35% in adults and is associated with an increased risk of adverse cardiovascular events and all-cause mortality (10, 11). Cardiometabolic disease is challenging for physicians to manage because it can be present for years before becoming clinically apparent. Histological and functional alterations have been observed in the heart and liver, in addition to the skeletal muscle, liver, pancreas, adipose tissue and microcirculation (12). Numerous studies suggest that QMRI may add valuable information by identifying microstructural tissue damage early in the disease process, allowing for instituting and maintaining optimum health behaviors and treatment strategies, at a time when it is likely to be most effective.
The objective of this review is to provide an overview of parametric QMRI in cardiac and hepatic tissue characterization in cardiometabolic disease. First, we describe cardiac and hepatic tissue structural changes that occur in the primary manifestations of cardiometabolic disease, namely in diabetes, hypertension and atherosclerosis, as a framework for understanding how QMRI can be utilized to assess these changes. Then, we describe single-parameter mapping techniques and their clinical applications in the corresponding disease states. Lastly, we describe emerging multiparametric approaches in heart and liver, which are promising for comprehensive understanding of this multi-faceted disease.
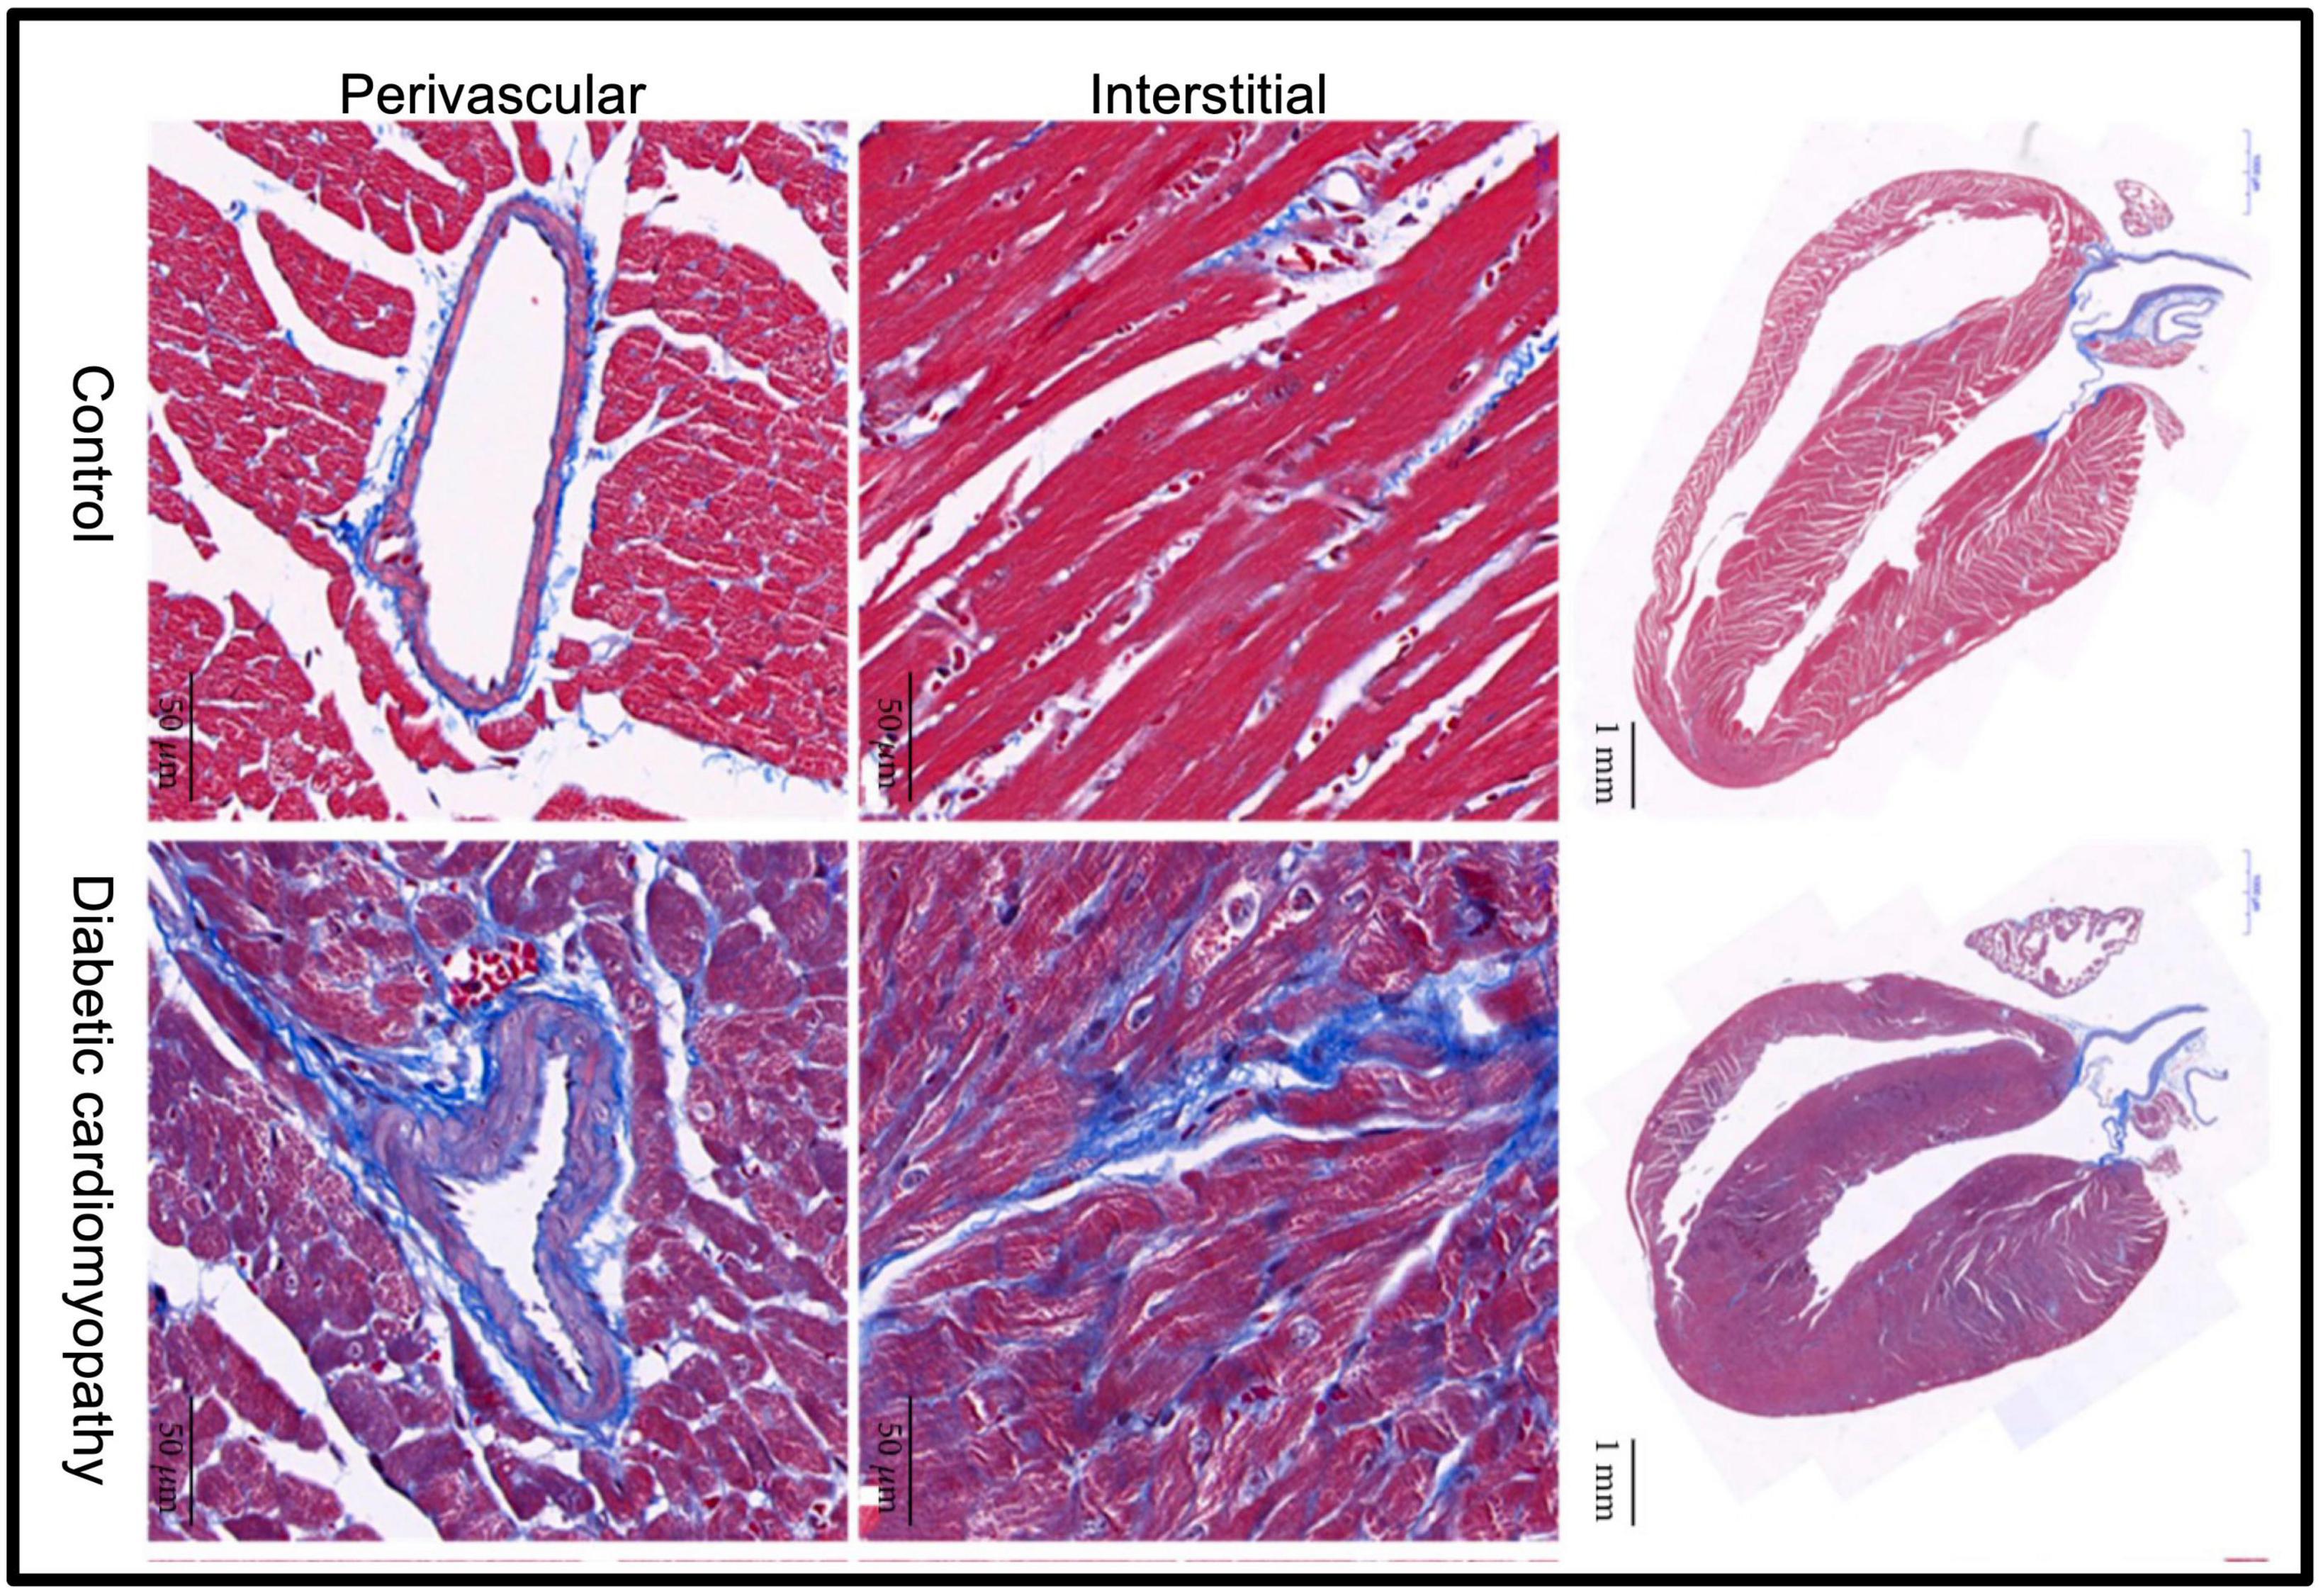
2. Microscopic tissue alterations in cardiometabolic disease 2.1. Diabetic cardiomyopathyType 2 diabetes mellitus (T2DM) is estimated to affect 6% of the world’s population (13) and is considered a coronary heart disease risk equivalent (14–17). The pathogenesis of the cardiac morbidity is multifactorial (18, 19). It has been proposed that metabolic modifications induced by hyperglycaemia, insulin resistance and hyperlipidaemia cause an aberrant use of fatty acids for energy generation (20). Fatty acid may saturate ß-oxidation and accumulate in the cytosol, leading to lipotoxic effects. Furthermore, hyperglycemia elicits reactive oxygen species and advanced glycation product formation, which lead to cardiac glucotoxicity. Both, the lack of fuel and lipo/gluco-toxicity as well as disturbances in mitochondrial energetics are triggering cardiac low-grade chronic inflammation, fibrosis and contractile dysfunction (21). Histological studies have confirmed corresponding changes in the myocardium of diabetic patients and animals, including the presence of diffuse myocardial and perivascular fibrosis (22–24; Figure 1), increased quantities of matrix collagen, inflammation, myocyte hypertrophy, myocardial steatosis and increased apoptosis (25–29). These pathophysiological changes often evolve quiescently to heart failure; and the prevalence of heart failure in T2DM is ranging from 19 to 26% (30, 31). It is therefore of clinical relevance to comprehend early alterations of cardiac tissue composition in T2DM and the progress from subclinical disease to more advanced disease stage manifesting clinically.
Figure 1. Fibrosis plays a crucial role in the development of diabetic cardiomyopathy. Representative images of Masson’s trichrome staining of a longitudinal section of the heart of control and diabetic mice (scale bar 1 mm). Magnified views show extracellular collagen deposition in the interstitial (scale bar 50 μm) and perivascular (scale bar 50 μm) space. Compared to the control group, diabetic cardiomyopathy mouse hearts displayed markedly increased collagen content both in the interstitial and perivascular space. Adapted from Li et al. with permission (24).
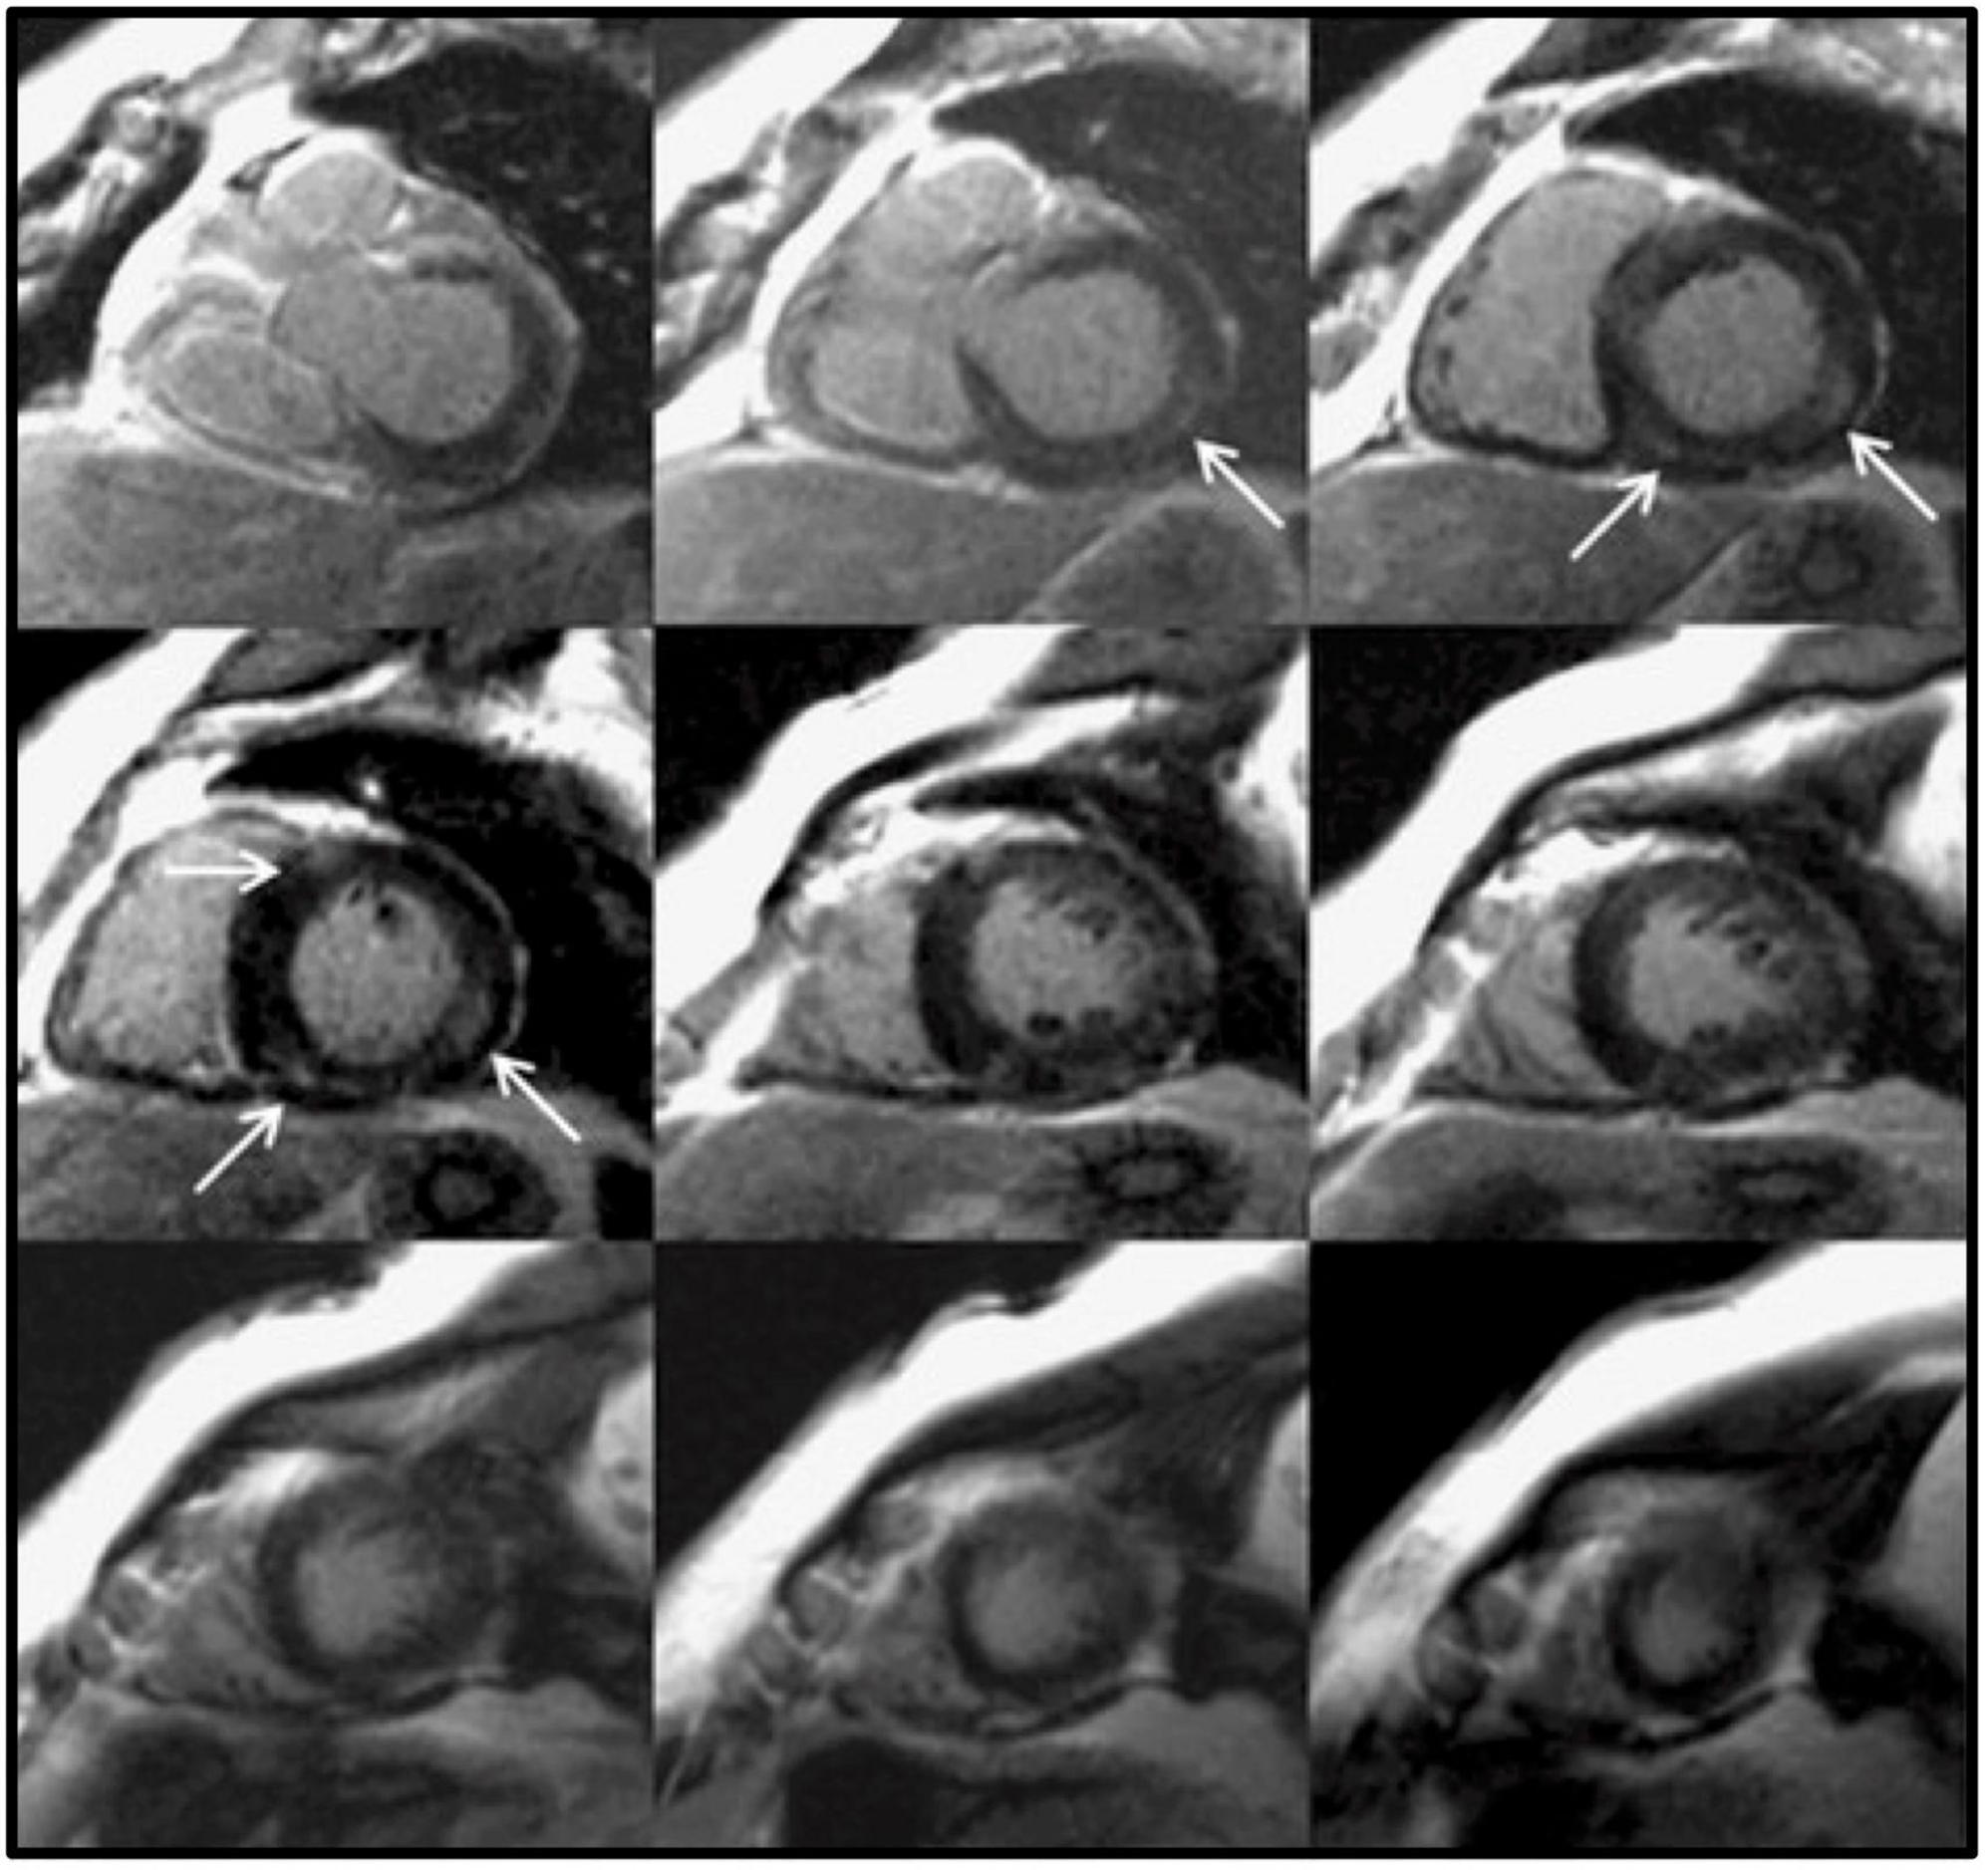
2.2. Hypertensive cardiomyopathyArterial hypertension is part of the constellation of disorders that constitute the cardiometabolic disease and is associated with an estimated 54% of strokes and 47% of ischemic heart disease worldwide (32, 33). The pathogenesis of hypertensive heart disease involves primarily cardiomyocyte hypertrophy, providing adaptive response to pressure overload (involving effects of growth factors, cytokines and neurohormones, and genetic predisposition) (34, 35). The alterations in the cellular and non-cellular (extracellular matrix) level induce structural remodeling of the myocardium with fibrosis of the muscle and perivascular space, medial hypertrophy of intramyocardial coronary vasculature, microangiopathy with decreased coronary reserve and development of epicardial coronary stenoses (36, 37). Myocardial fibrosis has been documented histologically in hypertensive hearts in subjects with hypertension (HTN) and left ventricular hypertrophy (LVH) (38). Myocardial fibrosis can be focal, referred to as replacement fibrosis, or diffuse, also known as interstitial fibrosis and is the most typical pattern in hypertensive heart disease (36) (Figure 2). Myocardial fibrosis predisposes patients to diastolic and systolic dysfunction, myocardial ischemia, and arrhythmias (39). It has been also demonstrated that treatment with inhibitors of angiotensin converting enzyme reduces collagen content and left ventricular stiffness with potential improvement in diastolic and systolic function, and perhaps outcomes (40). Thus, monitoring myocardial tissue alterations in hypertensive patients could enable risk stratification, inform treatment strategies, and monitor response.
Figure 2. Focal myocardial fibrosis in a hypertensive patient. Late gadolinium enhancement in a 63-year-old female patient with longstanding hypertension. The arrows show an area of intramyocardial late gadolinium enhancement in the basal and mid inferoseptal and inferolateral segments. This is not the most typical fibrosis pattern in hypertension, which is usually diffuse. Adapted from Maceira et al. with permission (36).
2.3. Atherosclerotic cardiovascular diseaseAtherosclerotic Cardiovascular Disease constitutes an important aspect of cardiometabolic syndrome and remains a leading cause of morbidity and mortality worldwide (41). The atherogenic process is primarily an inflammatory process and consists of several cellular and molecular interactions, including fatty tissue accumulation, platelet aggregation, abnormal vasomotor function, and can potentially culminate in atherosclerotic plaque formation, erosion, rupture or concomitant thrombus formation (42, 43), impeding blood flow and leading to tissue ischemia. In an acute ischemic event, the infarcted myocardial regions undergo a complex process of invasion, transformation and apoptosis of various cell types, including inflammatory cells and myofibrolasts, before remodeling to fibrotic scar tissue. Occasionally lipomatous metaplasia of the scar tissue ensues (44, 45). Fibrosis has also been histologically observed in non-infarcted regions of the heart as a result of left ventricular remodeling in patients with severe coronary atherosclerosis (46, 47). It is hypothesized that coronary artery stenosis, induced by atherosclerosis, impairs perfusion and causes chronic hypoxia with myocyte loss with consequent “reparative” collagen synthesis, contributing to interstitial collagen accumulation (48). Furthermore, there is ample evidence supporting the association of inflammation with the initiation and progression of atherosclerosis (43, 49). Atherectomy specimens have demonstrated the migration of the inflammatory cells in the arterial endothelium and that the inflammatory burden contributes to atherogenesis and adverse events (43).
2.4. Non-alcoholic fatty liver diseaseNAFLD is considered the hepatic manifestation of the metabolic syndrome and constitutes one of the most common causes of chronic liver disease, with an estimated worldwide prevalence of around 25% (50). It is characterized by excessive fat accumulation in the hepatic tissue that is not attributable to consumption of alcohol (8). This condition may range histologically from simple non-alcoholic fatty liver, which is considered a benign condition, to non-alcoholic steatohepatitis (NASH), which additionally involves various stages of inflammation to tissue necrosis (8). Evidence from several studies suggests that all-cause mortality and more specifically cardiovascular-related mortality is higher in patients with NASH, and this is independent of the risk conferred by traditional risk factors and components of the metabolic syndrome (51–53). There is therefore a clinical need for reliable non−invasive biomarkers at the tissue level for the assessment of NAFLD and NASH (54).
3. Single-parameter mapping techniques in cardiometabolic diseaseParametric mapping requires the acquisition of a series of weighted images with different contrasts. These contrasts are generated by varying timing parameters such as echo times or inversion times. Fitting the series of weighted images to the corresponding signal model, in a pixel-wise manner, enables the generation of a quantitative map of the tissue relaxation, expressed in units of time (e.g., milliseconds). Single-parameter mapping techniques include T1 mapping, T2 mapping, T2* mapping and T1rho mapping. Extracellular volume can be generated from native (pre-contrast) and post contrast T1 mapping. Proton density fat fraction (PDFF) is a ratio, expressed as a percentage, of the fraction of the MRI-visible protons attributable to fat divided by all MRI-visible protons in that region of the liver attributable to fat and water. A brief introduction to each of these maps and their application in cardiometabolic disease is given below. The latter is also summarized in Table 1. The reader is referred to (55, 56) for further reading about the specific mapping techniques.
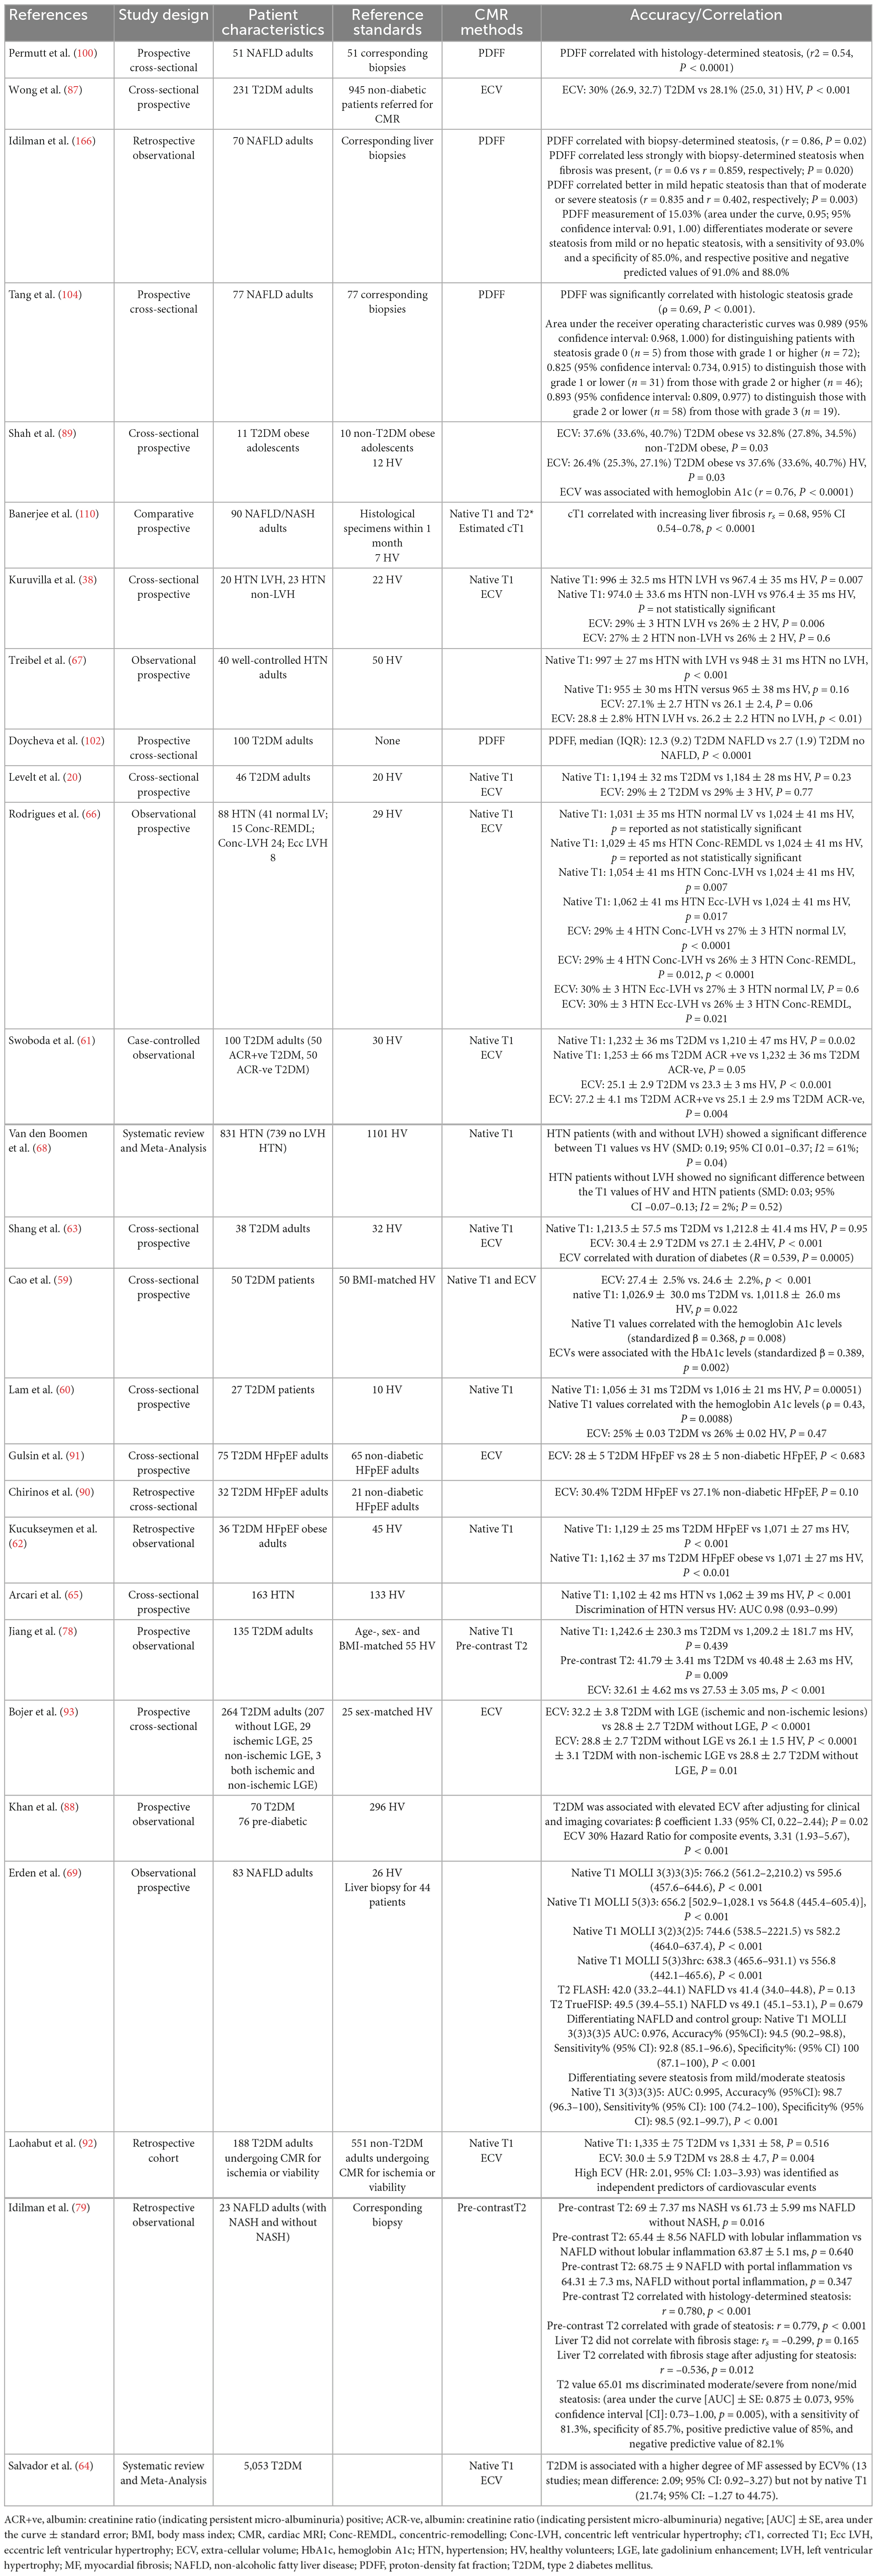
Table 1. In vivo CMR studies with conventional single-parameter mapping techniques in patients with cardiometabolic disease.
3.1. T1 mappingT1 (spin-lattice) relaxation time is the characteristic tissue relaxation constant governing the recovery of longitudinal magnetization (Mz) back to its thermal equilibrium following a radiofrequency pulse. T1 parametric mapping is conventionally achieved by applying magnetization preparation pulses (e.g., Inversion Recovery (IR) or Saturation Recovery (SR) pulses to encode T1 as in MOLLI (1) or in SASHA (57) respectively) preceding the readout to generate the desired T1 contrast. The same preparation pulse type is typically applied several times with varying parameter settings, (e.g., inversion delay or saturation delay) to obtain different T1 contrast weighted images, which are then used for pixel-wise parametric fitting to the expected signal behavior. The need for several weighted images for parametric fitting (e.g., ∼10 for T1 mapping) and the time required to allow for magnetization recovery reduce the efficiency of the sequence, usually limiting it to one or few 2D slices, especially in the case of cardiac imaging, where the readout is synchronized with the ECG and usually performed at the diastolic cardiac phase.
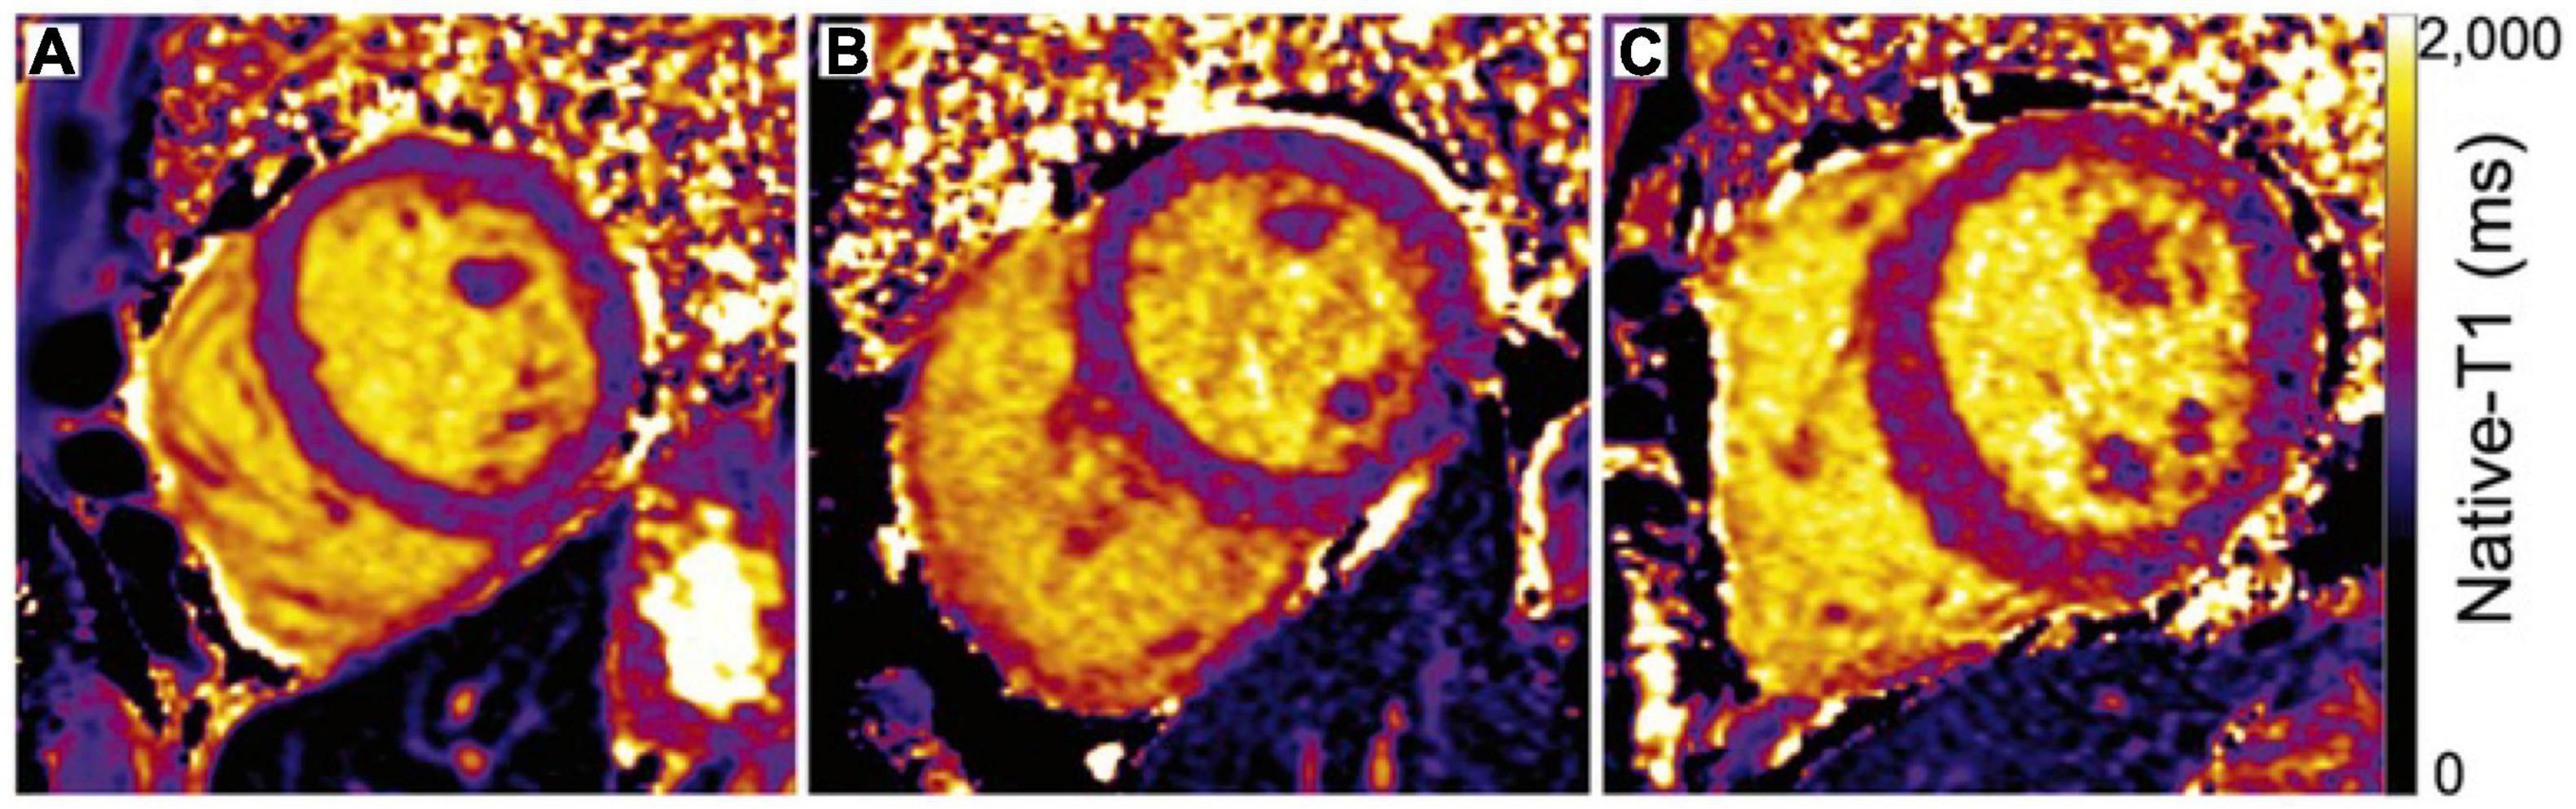
Native T1 values are prolonged by tissue free water content and are typically shortened by fat and iron. Increased native T1 values are seen in oedema and during inflammation (3). Increased T1 values are also seen in areas of fibrosis, due to associated expansion of the extracellular space as seen for example in myocardial infarction (MI) and hepatic fibrosis (58). Controversial results about myocardial T1 values in diabetic cardiomyopathy have been reported, some studies have concluded significantly increased native T1 values in the myocardium of diabetic patients in comparison to controls (59–62) (Figure 3), while other studies have not found a significant difference (20, 63). Meta-analysis of the relevant studies did not show an association of diabetes with native T1 time (64). With regards to arterial hypertension, several groups have shown that elevated T1 values are found in hypertensive subjects with left ventricular hypertrophy (LVH) compared with those with normal left ventricular myocardial mass and controls (38, 65–67). These results suggest that hypertensive patients have increased myocardial fibrosis, but that this is triggered with the onset of LVH rather than earlier. This could also suggest that interstitial changes in early hypertension (pre-LVH) are non-existent or perhaps are small and not detectable with current applications of T1 mapping technique. These findings have been confirmed by a meta-analysis (68). Additionally, in a cohort of patients with NAFLD versus healthy subjects, native liver T1 values could differentiate steatotic from non-steatotic livers and showed a strong correlation with history of cardiovascular disease (69).
Figure 3. Maps of native-T1 relaxation times in (A) a healthy control and (B) a diabetic adult with normal left ventricular structural parameters demonstrate similar global mean T1 relaxation times (A: 1014 ms, B: 1023 ms). (C) In contrast, elevated native-T1 relaxation times within the septum, anterior wall, and inferior right ventricular insertion area of a diabetic adult with increased septal wall thickness (1.4 cm) and elevated mass-to-volume ratio (1.4 mg/ml) result in a longer mean left ventricular native-T1 time (C: 1,095 ms) compared to either A or B. Adapted from Lam et al. with permission (60).
3.2. T2 mappingT2 (spin-spin) relaxation time is the MR constant governing the decay of transverse magnetization (Mx,y) and is dependent on spin-spin interactions. T2 parametric mapping is conventionally achieved by applying T2-preparation pulses, with different time durations, before the readout to encode T2 (70) and generate the desired T2 weighted images. T2 mapping requires the acquisition of ∼3–4 T2 weighted images including pause heartbeats to allow for magnetization recovery, which collectively reduces the efficiency of the sequence, usually limiting spatial resolution and coverage resulting in the acquisition of only one or a few 2D slices per CMR examination.
T2 mapping detects tissue free water content and has been shown very useful for detection of myocardial inflammation and oedema in chronic and acute disease settings (71–76). T2 mapping is also used for the differential diagnosis of acute myocardial infarction as it allows detection of the associated oedema and inflammation caused by the acute immune response (77). Jiang et al., demonstrated that diabetes status is related to increased T2 values even in asymptomatic individuals, and this is associated with both left ventricular systolic and diastolic function (78). Furthermore, a recent study has demonstrated that there is good correlation between liver T2 values and histology determined steatosis (r = 0.780, p < 0.001) and grade of steatosis (r = 0.779, p < 0.001). Interestingly, a higher correlation between the liver T2 value and percentage of histological steatosis was observed (r = 0.838, p < 0.001), after adjusting for the fibrosis stage. A T2 cut-off value of 65 ms [area under the curve (AUC) ± SE: 0.88 ± 0.07, 95% confidence interval (CI): 0.73–1.00, p = 0.005] could discriminate moderate/severe steatosis from none/mild steatosis with a sensitivity of 81%, specificity of 86%, positive predictive value of 85%, and negative predictive value of 82% (79).
3.3. T2* mappingT2* time captures the dephasing in transverse magnetization (perpendicular to the strong magnetic field) due to the combined effect of field inhomogeneities and susceptibility induced distortions from the magnetised tissue (e.g., high content of paramagnetic materials such as iron) and the spin-spin relaxation related dephasing. The T2* relaxation time values are always shorter than or equal to T2. Routine evaluation of liver and heart iron content using T2* mapping is indicated in patients with suspected iron overload, for instance due to frequent transfusions in thalassaemia and sickle cell patients (80, 81). Increased iron can be co-existing in NAFLD and other chronic liver diseases (82) and emerging evidence suggests that liver iron deposition is associated with worse histopathological features of NASH and disease progression. T2* based imaging thus could be used clinically if integrated into clinical guidelines to identify such patients (83, 84). Additionally, iron may interfere with liver T1 estimation and thus might contribute to lower accuracy in tissue characterization, if not corrected for.
3.4. Extracellular volumeThe estimation of the extracellular volume (ECV) is based on the intravenous injection of extracellular gadolinium-based contrast agent (GBCA) with non-protein-bound volume distribution and can be measured using pre- and post-contrast T1 mapping (85). The underlying principle is that the T1 shortening effect of an extracellular GBCA is directly related to its tissue concentration. The relationship between ECV in the myocardium and blood is approximated by Equation 1, where the change in 1/T1 in the tissue and blood pool is used to determine contrast agent concentrations, the ratio of which yields an estimation of ECV, following a correction for red blood cell density in the blood pool (haematocrit, Hct).
ECVmyocardium=
(1T1myopostGd-1T1myonative)(1T1bloodpostGd-1T1bloodnative)*(1-Hct)(86)(1)
CMR studies have demonstrated, that ECV was significantly higher in HTN LVH subjects versus controls (0.29 ± 0.03 vs. 0.26 ± 0.02, p < 0.01) and HTN non-LVH subjects (0.29 ± 0.03 vs. 0.27 ± 0.02, p = 0.05) (38, 66). CMR studies showed controversial results with regards to the association of diabetes with increased ECV. Several studies demonstrated that increased ECV is present in diabetic subjects in comparison to controls (20, 59, 61, 63, 78, 87–92). This was found to weakly correlate with hemoglobin A1c levels (59, 89) and the duration of diabetes (63). It was also associated with mortality and/or incident of heart failure admission (87), and constituted an independent risk factor for adverse cardiovascular outcomes (88, 92). It was also associated with late gadolinium enhancement (LGE) lesions that could not be explained by previous infarcts (non-ischemic LGE lesions) and prevalent complications of diabetes (retinopathy, autonomic neuropathy) (93; Figures 4, 5). On the contrary, dissimilar results with regards to the association of diabetes with increased ECV have been suggested by other groups (20, 60, 88, 91, 94, 95). A recently published meta-analysis concluded that diabetes was associated with increased ECV but not with native T1 increase and increased ECV was also associated with poor glycaemic control (64).
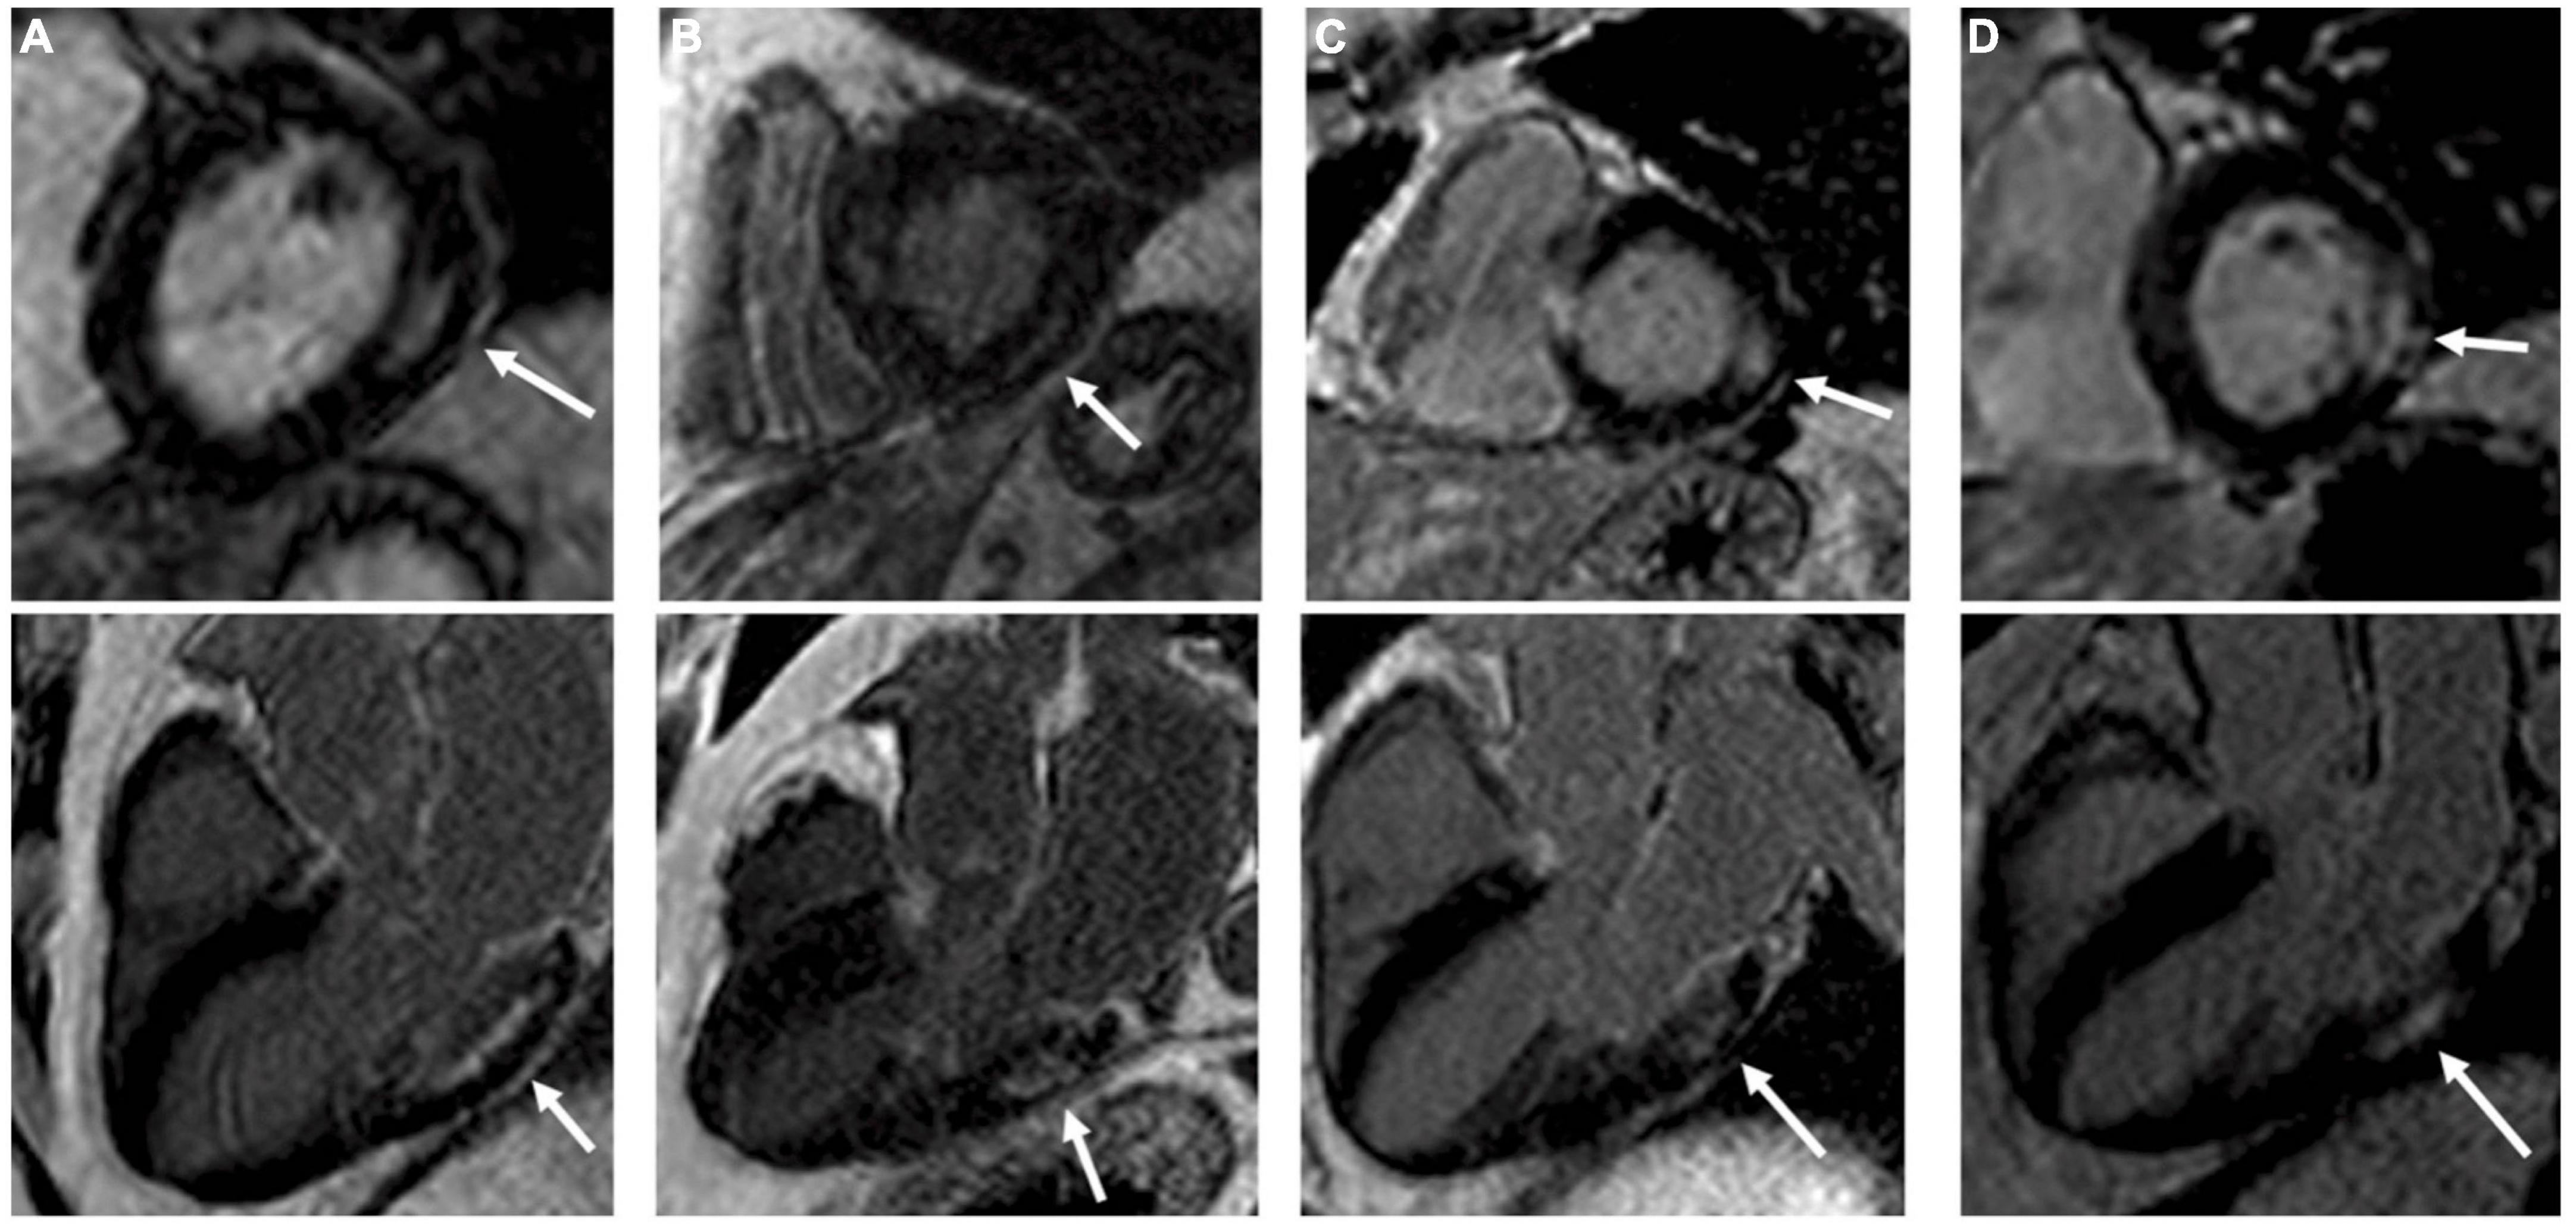
Figure 4. Four type 2 diabetes mellitus patients (A–D) with typical non-ischemic late gadolinium enhancement (LGE) lesions with left ventricular short-axis and long-axis images. Non-ischemic lesions are located mid-myocardial, basal and lateral or inferolateral. In segments with non-ischemic LGE lesions, the myocardium remains thick. Adapted from Bojer et al. with permission (93).
Figure 5. Late gadolinium enhancement images and extracellular volume fraction (ECV) maps by diabetic status. Example of two patients, with prediabetes and diabetes mellitus. Both patients had no late gadolinium enhancement (indicative of replacement fibrosis). The patient with diabetes mellitus had significantly higher amount of ECV (indicative of interstitial fibrosis) compared to the patient without diabetes mellitus. CMR indicates cardiac magnetic resonance. Adapted from Khan et al. with permission (88).
3.5. T1ρ mappingT1ρ (T1rho) measures the spin-lattice relaxation in the rotating frame, and is a sensitive marker for probing macromolecular water interaction (96). T1ρ has been demonstrated to be sensitive to oedema and fibrotic scar in chronic myocardial infarction. Application of non-contrast T1ρ -mapping in CMR has been reported to discriminate between infarcted and healthy myocardium in animal models (97). Oedema also induces enhancement in T1ρ values, as demonstrated in the area-at-risk in acutely ischemic myocardium, in acute myocarditis and Takotsubo cardiomyopathy (98, 99). This mapping technique sequence is yet to be routinely used in clinical practice. Nevertheless, both oedema and fibrosis are present in the myocardium and liver in NAFLD and future clinical validation in this patient group is warranted to assess its clinical utility as a potential biomarker.
3.6. Proton density fat fractionProton density fat fraction (PDFF) is a ratio, expressed as a percentage, of the fraction of the MRI-visible protons attributable to fat divided by all MRI-visible protons in that region of the liver attributable to fat and water. Taking advantage of the chemical shift between fat and water, pulse sequences can be used to acquire images at multiple echo times at which fat and water signals have different phases relative to each other (2). MRI-determined PDFF correlates with histologically determined steatosis grade in patients with NAFLD and has been utilized for the assessment of NAFLD in T2DM patients (100, 101) (102). The diagnostic accuracy of MRI-PDFF was further validated by Idilman et al. (103) and Tang et al. (104), both of which demonstrated that MRI-based PDFF assessments correlated closely with histology as assessed by liver biopsy (r = 0.82) and explant ex vivo histology assessment (r = 0.85). Idilman et al. noted that the presence of hepatic fibrosis reduced the correlation between biopsy results and PDFF (103).
4. Multiparametric approaches in quantitative MRCardiac and liver QMRI, including T1, T2 and ECV mapping, have emerged as an approach to quantify tissue properties in cardiometabolic disease. Furthermore, in the past years, there has been a growing interest in alternative parameters that may add complementary information. For instance, several studies have shown that T1ρ could be an alternative for the detection of liver (105–107) and myocardium fibrosis (98, 108, 109) without the need of an external contrast agent injection. Nevertheless, at the moment, in clinical practice each quantitative parameter is investigated individually. As a result, sequential, lengthy scans are required to capture multiple parameters in order to accurately describe the various disease phenotypes of cardiometabolic disease (1, 110–112).
Simultaneous multiparametric QMRI, in which the parameters of interest are obtained from a single scan have recently gained attention. An important aspect of this approach is that the parameters should no longer be confounded by each other, promising reliable quantification of the individual parameters in shorter scan time. For instance, liver T1 values have been shown to depend strongly on iron content necessitating an additional measurement for liver iron, such as T2*mapping, for interpretation of T1 values (113). Recent studies in adult and pediatric patients with NAFLD also suggest that hepatic PDFF and T2* are strongly correlated with each other in vivo. This relationship was observed using different MRI techniques and therefore PDFF and T2* value should be considered together when interpreting each of those in human liver (114, 115). Finally, it has been observed that liver fat declines in patients with advanced fibrosis (burnt-out NASH), hence disease progress can be misinterpreted if NAFLD is screened with PDFF for steatosis only (102).
Several models of simultaneous multiparametric QMRI have been investigated in research studies, including methods like joint multiparametric mapping or transient-state imaging approaches (116, 117), magnetic resonance fingerprinting (MRF) (118) and magnetic resonance multitasking (119). Each of them follows a different technical approach, but with the shared goal of providing as many different parametric maps as possible within a single scan. A brief description of each of these and their potential to improve the clinical assessment of cardiometabolic disease is discussed hereafter.
4.1. Joint multiparametric mappingIn cardiac MRI, several 2D joint parametric mapping approaches have been proposed. With these approaches the acquisition sequence is generally designed to encode T1 and T2 simultaneously. Blume et al. (120) (steady-state) and Kvernby et al. (121) (transient state) employed interleaved T2-preparation and Inversion Recovery (IR) preparation pulses for T2 and T1 encoding, respectively. Akçakaya et al. (122) and Guo et al. (123) also used T2-preparation for T2 encoding but replaced the IR by SR for T1 encoding to make the sequence less dependent to heart rate variation. Another approach was proposed by Santini et al. (124); in this case, an IR pulse provides T1 encoding, and the subsequent continuous balanced-Steady-State-Free-Precession readout provides the T2 encoding.
The multiparametric maps from the aforementioned approaches are obtained after pixel-wise fitting to a sequence-dependent model. However, the need of resting periods for magnetization recovery and the use of breath-holds results in low spatial resolution, limited coverage, and motion artifacts if patients are unable to hold their breath. Applications for cardiac imaging, that sought to address these issues and to enable the acquisition in a clinically-feasible scan time have also been proposed (125) (126; Figure 6A, B1, B2). Those rely on “dictionary matching.” Using this approach, a dictionary is generated which is a compendium of possible signal evolutions for a set of combinations of parameters of interest (such as T1 or T2), which can be calculated, for example with Bloch simulations (118) or the Extended Phase Graph (127) formalism. The “multi-parametric MR signal” of every pixel is then compared against all entries included in the dictionary by pattern matching (e.g., dot product or least square), to estimate the parameter combination that best represents the measured signal evolution. Dictionaries can also be employed to predict the signal evolution of the transient state; as proposed in MRF. There exist also several examples of multiparametric approaches which were proposed for liver imaging, including water/fat-separated T1 mapping (MP-Dixon-GRASP) (128) along with PDFF imaging and water-specific T1 mapping [T1(Water)] (PROFIT1) (113). An alternative approach has been proposed by Pavlides et al. This includes T1 mapping for fibrosis/inflammation imaging and T2* mapping for liver iron quantification. The T1 measurements of this method are adjusted for the iron level, as high iron levels in the presence of fibrosis can lead to “pseudo-normal” T1 values. This was achieved by integrating the results from shortened-MOLLI T1 maps and T2^* maps in an algorithm that allows to correct for the bias introduced by elevated iron in the T1 measurements, yielding iron−corrected T1 maps (110, 129). In total, seventy−one patients with suspected NAFLD were recruited within 1 month of liver biopsy and the performance of multiparametric magnetic resonance for the assessment of NASH and fibrosis was evaluated using histology as reference standard (130; Figure 7). Fibrosis stage as analysed on biopsy correlated with MRI-estimated inflammation and fibrosis (rs = 0.51, P < 0.0001). The AUC using this multi-parametric approach for the diagnosis of cirrhosis was 0.85 (95% CI: 0.76–0.95; P = 0.0002) and for the diagnosis of mild vs significant NAFLD was 0.89 (95% CI: 0.80–0.98%; P < 0.0001). This prospective pilot study demonstrated the potential of multiparametric QMRI to assess the overall disease severity in patients with NAFLD.
Figure 6. Simplified sequence diagram and corresponding images for three multi-parametric acquisition frameworks. (A) Short-axis T1 and T2 maps, and CINE images at apical, mid-ventricular, and basal levels obtained from a single joint T1/T2 + CINE free-running whole-heart scan. Figure adapted with permission from Qi et al. (128). (B1) Short-axis T1 and T2 map slices and a representative slice of water and fat CMRA images, obtained from a single joint whole-heart T1/T2 mapping + Water/FAT CMRA whole heart free-breathing isotropic scan. (B2) Representative coronal and transverse slices of joint T1, T2 maps and Fat images from a 3D isotropic free-breathing liver acquisition.
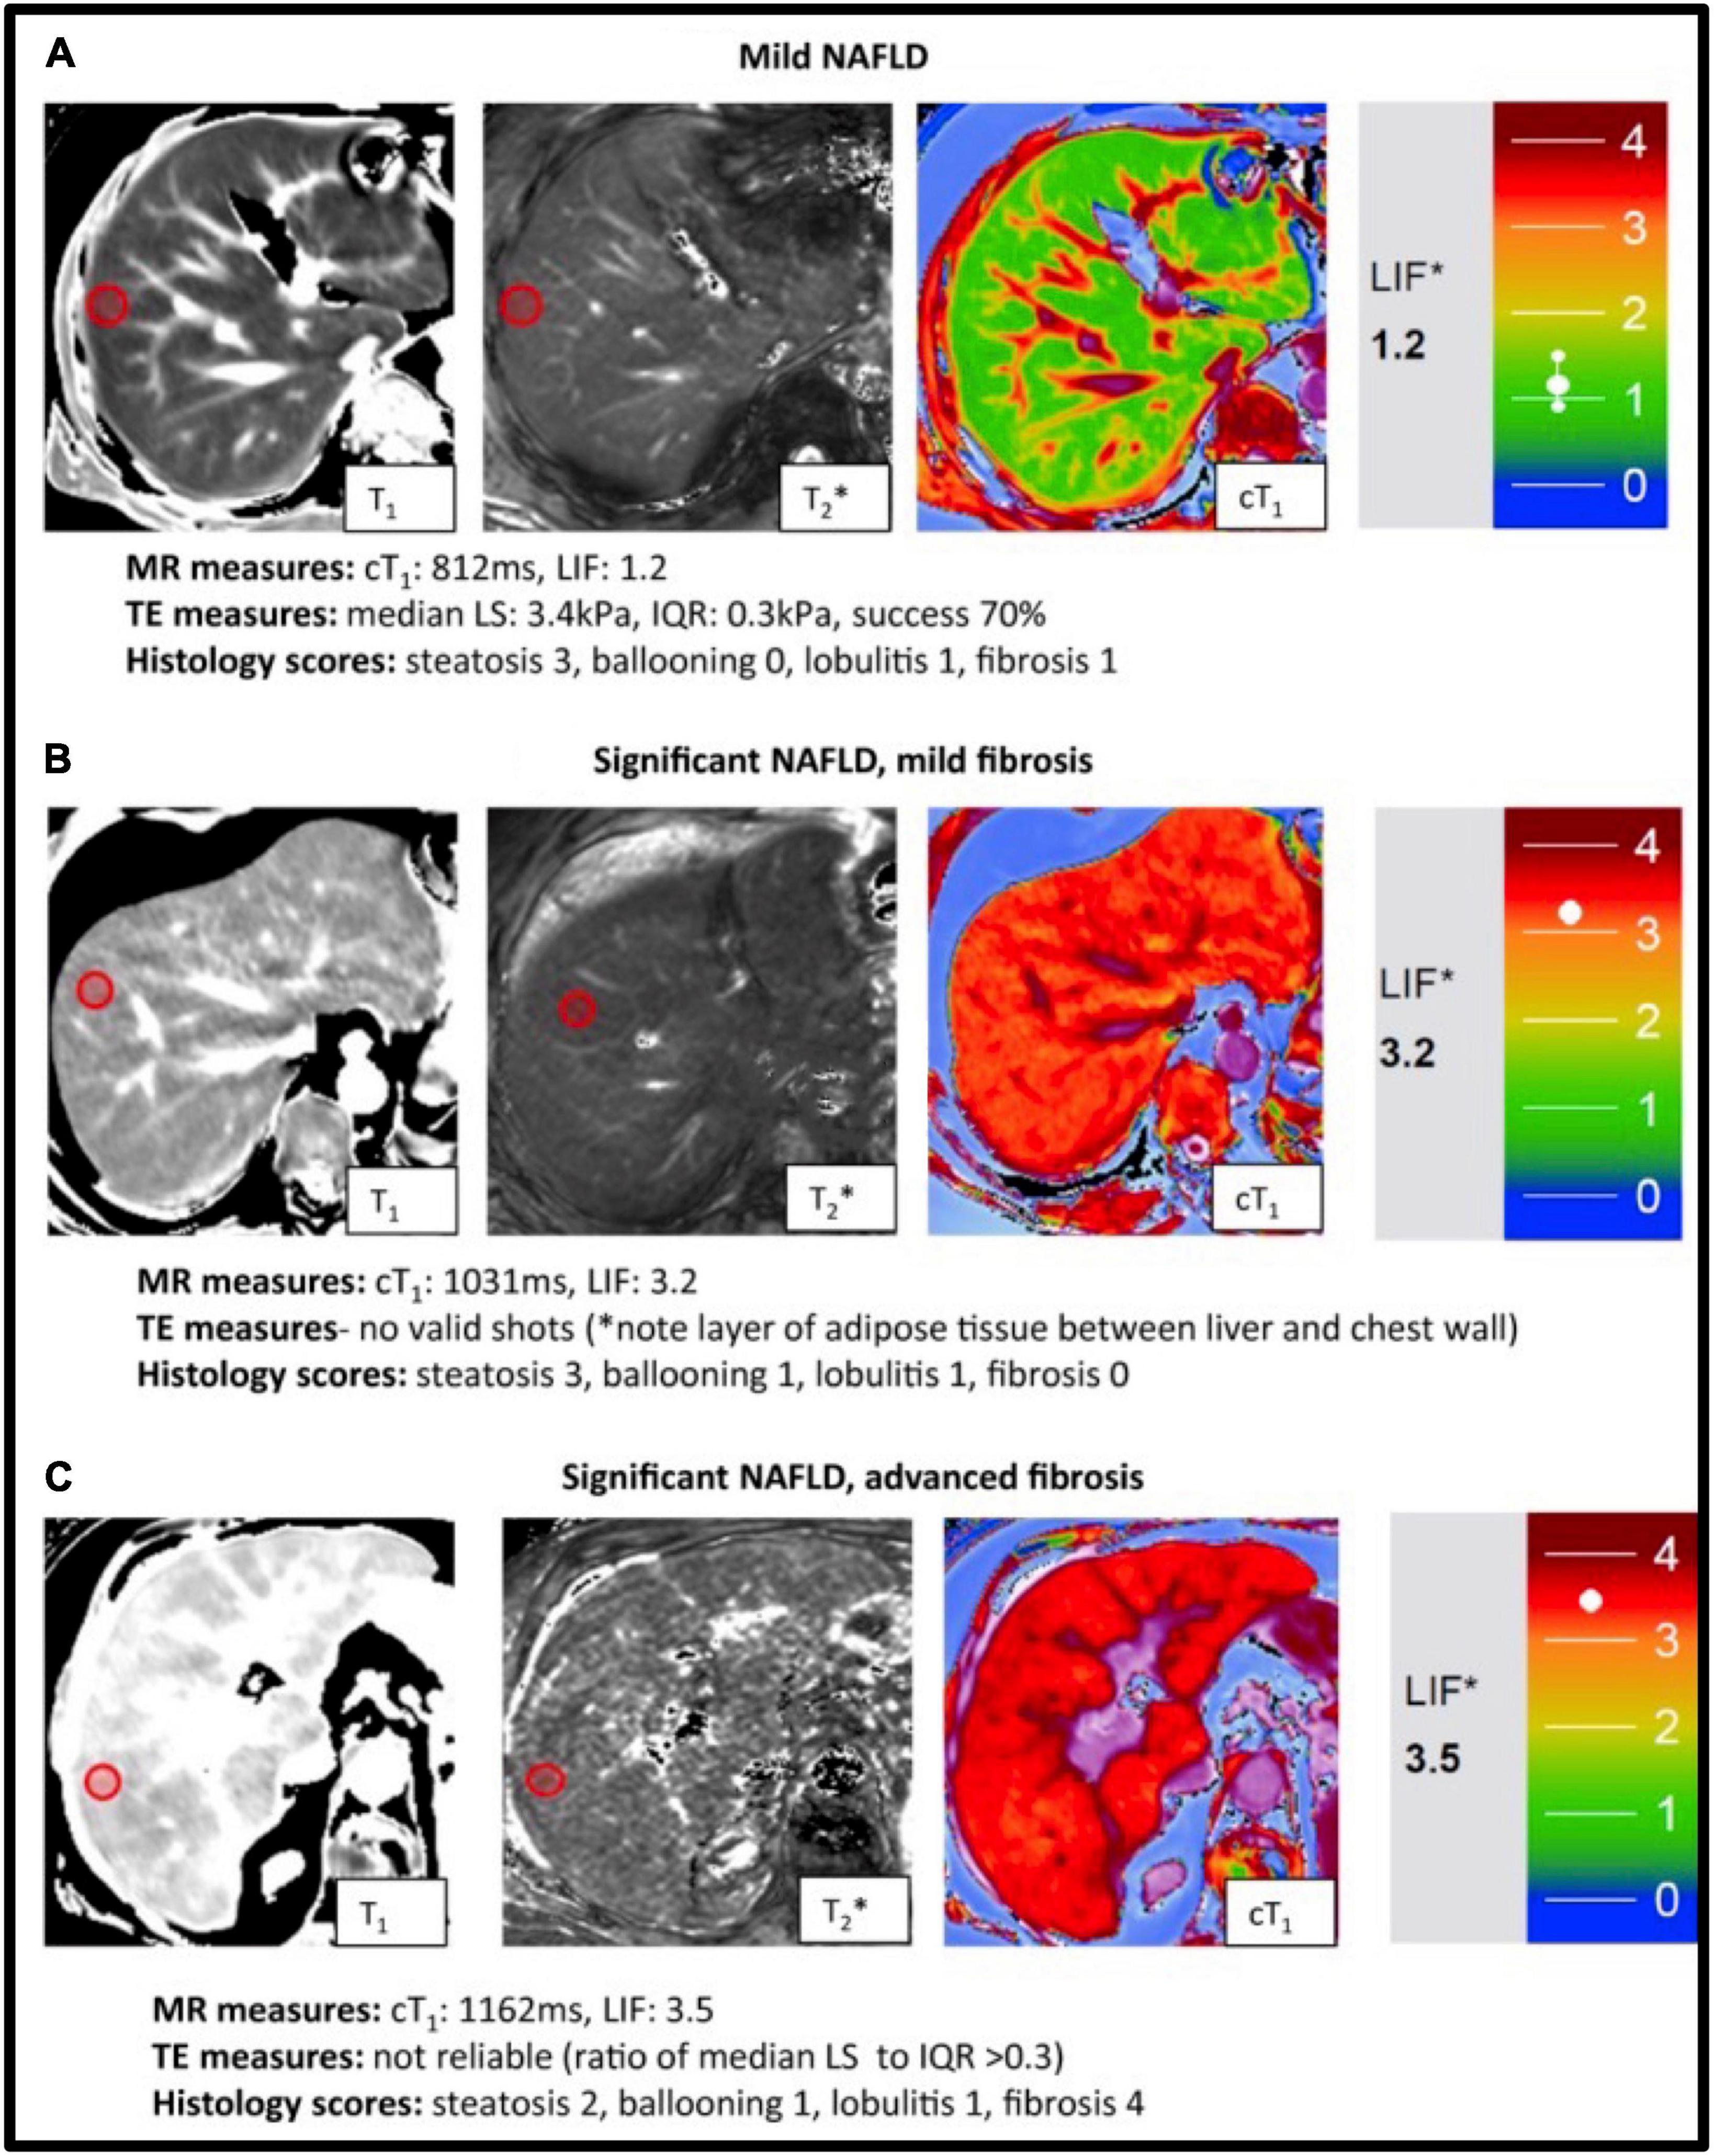
Figure 7. Representative magnetic resonance data with the corresponding transient elastography (TE) and histology data from patients with known or suspected non-alcoholic fatty liver disease NAFLD. T1, T2* mapping values were used to derive the calculated corrected T1 maps (cT1) maps and Liver Inflammation and Fibrosis (LIF) scores. Patients were classified based on biopsy findings, using the Fatty Liver Inhibition of Progression (FLIP) algorithm (92), as having: mild disease (A), significant disease/mild fibrosis (B) and significant disease/advanced fibrosis (C). Red circles indicate typical regions of interest. There was a significant association between histological fibrosis and MRI LIF scores. Adapted from Pavlides et al. with permission (130).
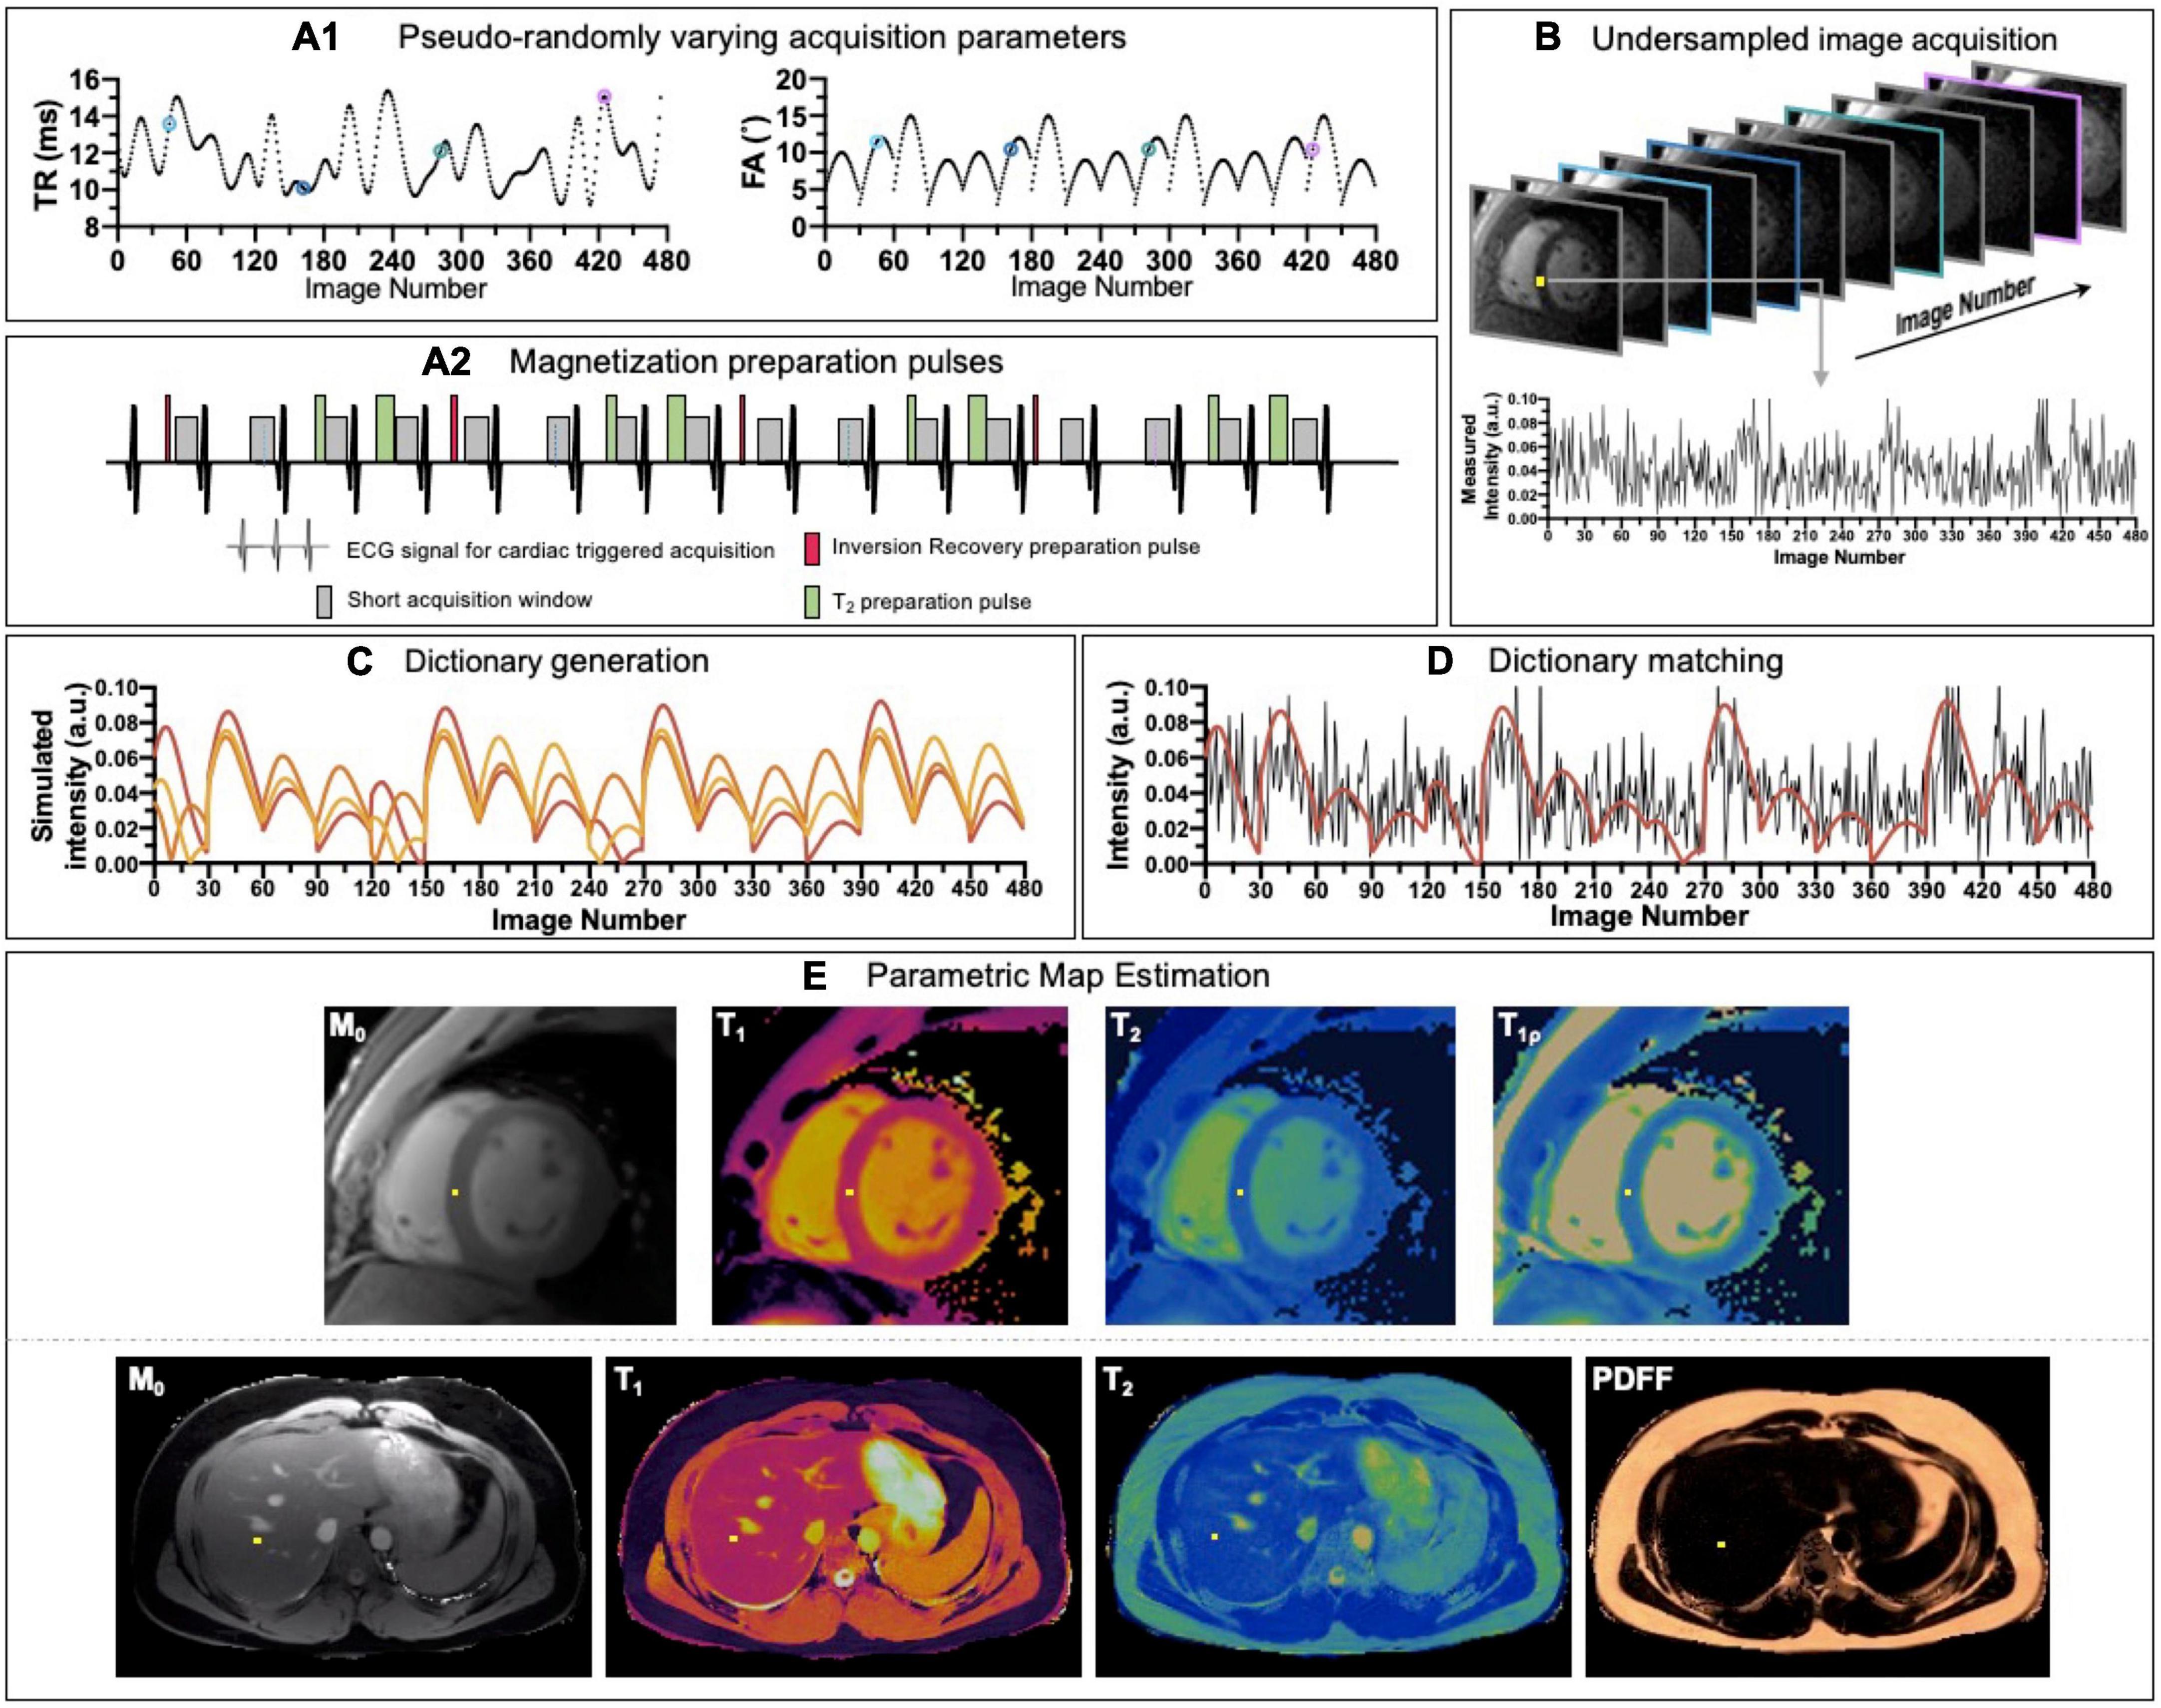
4.2. Magnetic resonance fingerprintingMost of joint multiparametric approaches presented above are based on steady state imaging and/or discrete sampling of few timepoints along the exponential signal decay, followed by magnetization recovery of the signal and then fit to a certain signal model. There are, however, alternatives like MRF (118) that rely on transient state imaging to generate co-registered multiparametric maps in a single highly efficient scan. In MRF, acquisition parameters such as flip angle and/or repetition time vary pseudo-randomly (Figure 8A1) throughout the scan to generate a unique signal evolution for every tissue, the so-called “fingerprint,” defined by different combination of T1, T2 and other parameters of interest, when encoded. Parametric encoding can also be increased by interleaving magnetization preparation (e.g., IR or T2-preparation) blocks at certain timepoints, similarly to the joint steady-state multiparametric approaches described above (Figure 8A2). In order to obtain a high temporal resolution (i.e., a large number or timepoints in the signal evolution) in an efficient manner, high acceleration factors and thus, highly undersampled images are obtained (Figure 8B). In parallel, a dictionary containing a sufficiently large and representative number of combinations of parameters of interest (e.g., T1 or T2) is generated using the specific acquisition parameters (Figure 8C).
Figure 8. Schematic overview of a cardiac/liver MRF framework. (A1) Acquisition parameters such as repetition time (TR) and variable flip angles (FA) may be pseudo-randomly varied throughout acquisition and (A2) magnetization preparation pulses are introduced to increment contrast weighing on the desired parameters. (B) Highly undersampled images are obtained, and (C) a dictionary of different signal evolutions for a range of T1/T2 (and other parameters of interest) combinations are calculated in parallel. (D) Matching the temporal evolution of the signal measured with the dictionary will provide (E) inherently co-registered parametric maps of the scanned region.
The “fingerprint” of every voxel is then compared against all the possibilities or entries included in the dictionary by pattern matching to estimate the parameter combination that best explains the measured signal evolution (Figure 8D). In this way, multiparametric co-registered quantitative maps are generated within a single scan (Figure 8E). This dictionary can be reutilized in the subsequent scans provided that the acquisition parameter patterns remain unchanged, which is, however, not the case for cardiac imaging due to subject-specific heart rate variations.
Hamilton et al. (131) proposed for the first time the application of the MRF framework for an ECG-trigged scan for simultaneous T1, T2 and M0 characterization of myocardial tissue. However, given the high flexibility that MRF provides for the extension of the sequence to encode additional parameters, several works have been proposed to extend cardiac MRF to multiparametric assessment, including simultaneous cardiac T1/T2 maps and PDFF, simultaneous T1, T2 and T1ρ cardiac MRF and simultaneous T1, T2, PDFF and T2* acquisition (132) (133, 134).
Some of these approaches have been evaluated in healthy subjects (135, 136) and small patient cohorts (137) (138) (139).
For liver imaging, Chen et al. (140) proposed a robust MRF framework where T1 and T2 2D maps are obtained on a 3T scanner. This framework has been further extended to include 2D T1, T2, T2* and PDFF mapping in a 14s breath-hold acquisition (141) and initial clinical validation against histological grading from liver biopsies in a cohort of 56 patients with diffuse liver disease has been performed (142). Further advances include evaluating T1, T2, T2*, PDFF and T1ρ mapping (143).
Future clinical validation studies of the aforementioned methods for comprehensive cardiac and liver tissue characterization in cardiometabolic disease are anticipated.
4.3. Magnetic resonance multitaskingMagnetic resonance multitasking is an alternative approach that enables multiparametric assessment along with the visualization of cardiac and respiratory motion from a single scan. This technique is based, by definition, on a continuous acquisition in which all the possible signal evolutions that are taking place due to different image dynamics (i.e., how the signal would evolve throughout the acquisition due to magnetization relaxation, cardiac or respiratory motion, contrast agent pharmacokinetics or any other cause) are stacked as extra temporal dimension or “tasks” in a high dimensional low rank tensor. In the original work, Christodoulou et al. proposed (119) a cardiac MR multitasking approach where a T2-IR prepared free-breathing acquisition leads to simultaneous and motion-resolved T1, T2 and functional assessment within a single ∼60 s ECG-free scan. At Nyquist sampling rate, the high number of time dimensions considered for this matter would require prohibitive scan times. Christodoulou et al. exploited the low-rank property of the generated tensor, thus the redundant and highly spatio-temporally correlated information is leveraged during the image reconstruction step (Figure 9). Feasibility of the proposed technique has been shown in myocardial T1 and ECV mapping (144) and of multi-slice motion-resolved joint T1/T2 cardiac mapping in a single 3-min free-breathing scan (145). Furthermore, in a recent work, Wang et al. (146) proposed the feasibility of simultaneous 3D quantification of water specific T1, PDFF and T2^* in a single 5-min scan. Future studies with larger patient cohorts for both heart and liver are warranted for robust clinical validation.
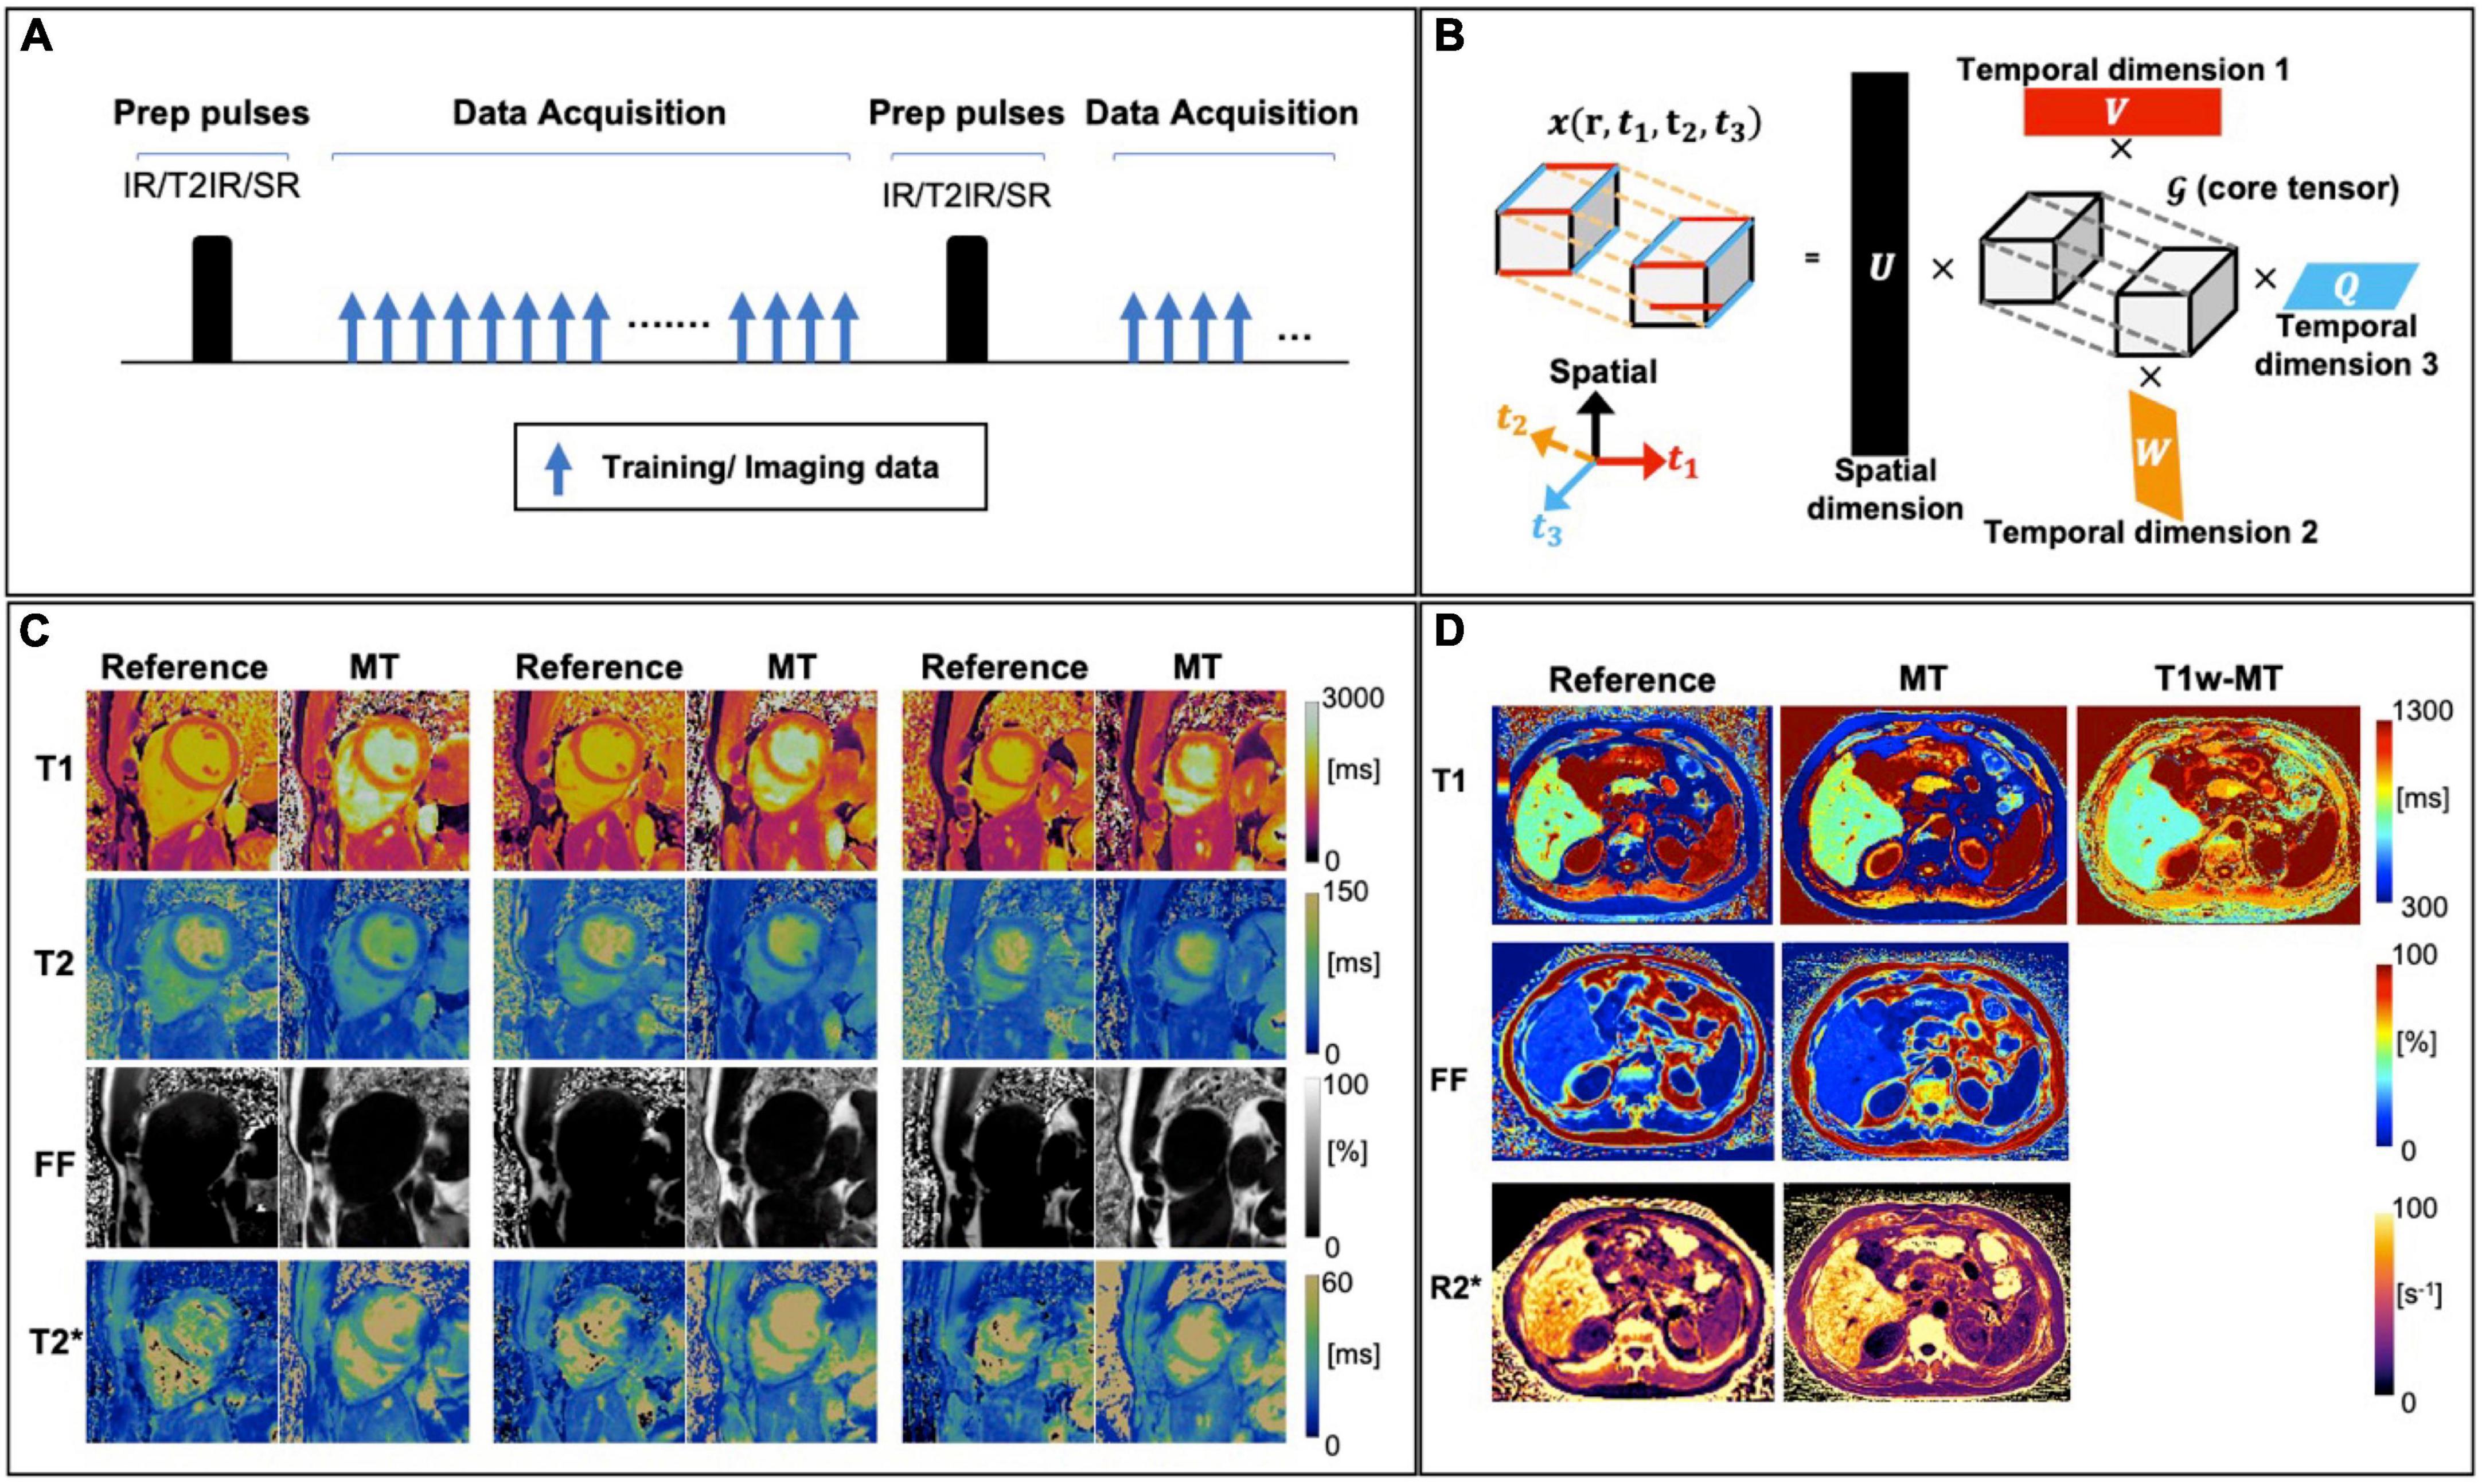
Figure 9. (A) A generic sequence diagram for Multitasking technique. The continuous acquisition cycles through different preparation modules (e.g., IR, T2-IR, and SR), with FLASH excitations filling the entire recovery period. The training and imaging data are collected in an interleaved way, for resolving temporal and spatial information, respectively. (B) An illustration of multi-dimensional image. In this example, the image tensor contains one spatial dimension r and three temporal dimensions (can be T1/T2/T2* relaxation, resp motion, cardiac motion, etc.) and its low–rank tensor structure can be explicitly expressed through tensor factorization between 4 sets of basic functions (U, V, W, Q) and a core tensor ?. (C) Representative reference and Multitasking cardiac T1, T2, FF, and T2* maps from a healthy volunteer. (D) Representative reference and Multitasking liver T1, T1w (water T1), FF, and R2* maps from a patient with non-alcoholic steatohepatitis. Adapted from Cao et al. (59) and Wang et al. (146).
4.4. Technical challenges of quantitative MRParametric mapping has been widely adopted in clinical practice and constitutes a complementary imaging biomarker in several pathologies. In the theoretical realm, parameters maps depend on the interaction of physics (MRI signal) and the underlying tissue biology. Nevertheless, in clinical practice, several limitations need to be acknowledged, as most mapping techniques depend on several confounding factors. Relaxation time is the result of the combination of the subject, hardware, acquisition, reconstruction algorithm, and map analysis that were used; consequently, all steps in obtaining a relaxation time can add bias or uncertainty to its measurement. A comprehensive review on this scope can be found in Ogier et al. (147). In brief, patients’ heart rate, breathing pattern along with scanner characteristics, such as magnetic field and coils array affect the derived map. With regards to the acquisition and reconstruction techniques, well-established confounding factors include the pulse sequence choice, which is known to affect the quantification of the parameter to be mapped, due to the particular technical and physical limitations of chosen sequence (148). For instance, for T1 mapping, different sequences such as MOLLI, shMOLLI, SASHA or SAPPHIRE show different accuracy and precision, as shown by Roujol et al. (149), and dedicated comparative studies have been done to determine which offers better diagnostic power (150). This is also the case for T2 mapping, where the use of dedicated T2-prep pulses is known to provide significantly underestimated T2 values compared to spoiled gradient echo and multi-echo spin echo sequences (151). Prior work has also suggested steady-state preparation schemes to reduce the oscillations that occur in the transient state of steady state free precession due to off-resonance, and the linear flip angle approach was shown to have a superior performance in the presence of large off-resonance frequencies (152). Furthermore, k-space readout, be it linear or centric, has been shown to affect accuracy and precision in T2 mapping (148). Similarly, T1rho relaxation is dependent on the applied spin-locking frequency. Additionally, the widely used MOLLI T1-mapping sequence is recognized to be confounded by alterations in T2, and linear T2prepared balanced steady state free precession values are confounded by T1. On some occasions, parameter estimation errors arise when estimating a single parameter without taking into account the effect of other parameters that are inherently coupled; T2-prepared sequences will be more prone to T2^* susceptibility artifact due to imperfect refocusing of the signal during the preparation whereas T1 quantification in the presence of iron will be biased and a corrected T1 (cT1) is required (130). Other sources of quantification variability such as magnetization transfer (153) or partial volume (154) may affect accuracy and precision. Promisingly, some of these effects can be eliminated or diminished with multi-parametric sequences such as MRF or CMR Multitasking, where several parameters of interest are estimated at the same time for each voxel, removing mis-registration inaccuracies and reducing estimation biases, furthermore multiple corrections can be included on the framework (119, 155–158). Unfortunately, the reproducibility of the aforementioned techniques is still impacted by confounding factors. In particular, multitasking and fingerprinting techniques, where modeling of the signal evolution is utilized to calculate the parameters, error liability is possible where not all influences on signal evolution are included in the model (148) (e.g., the cumulative effect of magnetisation transfer in MOLLI sequence, partial volume, off-resonance effects, magnetisation transfer) (158). Considering those effects on dictionary generation can minimize imperfections. Additionally, the increase of the number of parameters to be estimated for a given number of data points also leads to an increase in the complexity of the acquisition/reconstruction and may affect accuracy and precision as well as increasing computational demands.
4.5. Future perspectives for clinical integration of QMRI in cardiometabolic diseaseSignificant progress has been made to-date to better understand the histological alterations of cardiac and hepatic tissue in cardiometabolic disease and their potential correlation to QMRI techniques. The quantification of cardiac fibrosis in T2DM has been extensively studied with T1 mapping and ECV methods and this has been associated with adverse cardiovascular events. Several pilot studies have also demonstrated myocardial fibrosis in hypertension. Parametric tissue characterization has demonstrated hepatic fibrosis, steatosis and inflammation in proof-of-principle studies in NAFLD. Nevertheless, the scope of QMRI in cardiometabolic disease has not been fully investigated. This is attributed primarily to two factors. Firstly, the standardization of the existing clinical single-parametric mapping techniques has been suboptimal and current guidelines suggest the generation of site-specific normal ranges. Validation and subsequent standardization of the new methods has not been performed either and is a crucial step to enhance clinical uptake. Furthermore, the reproducibility and robustness of the proposed methods needs to be ensured in multi-center and multi-vendor studies. The design of prospective, longitudinal studies tailored to the relevant clinical questions, incorporating the novel technologies available, is also mandatory to expedite clinical adoption (159). Efforts toward reproducibility and standardization can often be accelerated through an overarching international organization that many parties trust, such as the Quantitative Image Biomarker Alliance of the Radiological Society of North America and the Quantitative MR Study of the International Society for Magnetic Resonance in Medicine (ISMRM).
Additionally, advanced acquisition schemes often come at the cost of lengthy acquisition and post-processing times. Further applications of multi-parametric QMRI that incorporate deep-learning based approaches demonstrate promising results at no extra time-cost either at acquisition or image processing level and would augment the diagnostic information (160–162). This could also allow the exploration of additional contrast weightings, including for example tissue diffusion. Furthermore, in view of the multi-organ manifestations of cardiometabolic disease, studies investigating simultaneously the liver and cardiac tissue are anticipated, to gain insight into the pathophysiology of cardiac-liver axis (140).
5. LimitationsOngoing research in cardiometabolic disease has discovered novel mechanistic pathways across various organ systems, including cardiac and skeletal muscle, pancreas, liver, adipose tissue and microcirculation. An elaborate review on inter-organ pathogenetic interrogation and multimodality imaging perspective is out of scope of this article and has been covered elsewhere (4). Additional MRI techniques that have been applied in cardiometabolic disease include magnetic resonance elastography and magnetic resonance spectroscopy. Magnetic resonance elastography has been primarily utilized for the evaluation of liver stiffness. It relies on the demonstration of propagating shear waves within the liver employing a phase-contrast type sequence (163). Magnetic Resonance spectroscopy investigates cardiac and hepatic metabolism in vivo by measuring proton signals as a function of their resonance frequency. By using the gyromagnetic properties of 1H, 31P, 13C, and 23Na, Magnetic Resonance Spectroscopy relates energy metabolism to (dys)function of the heart (164, 165). This article, which focuses on relaxation and proton-density fat fraction mapping techniques, cannot elaborate on the aforementioned methods due to space constraints. The reader is directed to (163–165) for deeper insights into the physics and applications of the respective methodology.
6. ConclusionCardiometabolic disease is a cluster of complex diseases that involve changes in the physiology of myocardial and hepatic tissue. Quantitative MR imaging is a valuable tool to characterize this disease, although a single quantitative parameter may not provide sufficient information. Simultaneous multiparametric MRI has demonstrated the feasibility of obtaining fast, co-registered multiple parametric maps within a single short MR scan and is promising for comprehensive understanding of the disease. QMRI frameworks are currently at a transition point between development and clinical adoption. Inclusion of standardization agreements, quality control protocols, and reproducibility assessment are essential for the clinical validation and uptake of these new promising techniques to gain further insight into cardiometabolic disease.
Author contributionsAF, CV, and CP devised and wrote the manuscript. CP and RB reviewed the manuscript. All authors contributed to the article and approved the submitted version.
AcknowledgmentsThe authors acknowledge financial support from the BHF PG/18/59/33955 and RG/20/1/34802, EPSRC EP/P001009, EP/P032311/1, EP/P007619/1, and EP/V044087/1, Wellcome EPSRC Centre for Medical Engineering (NS/A000049/1), ICN2021_004, Fondecyt 1210637, Fondecyt 1210638, ANID Basal FB210024, and Millennium Nucleus NCN19_161.
Conflict of interestThe authors declare that the research was conducted in the absence of any commercial or financial relationships that could be construed as a potential conflict of interest.
Publisher’s noteAll claims expressed in this article are solely those of the authors and do not necessarily represent those of their affiliated organizations, or those of the publisher, the editors and the reviewers. Any product that may be evaluated in this article, or claim that may be made by its manufacturer, is not guaranteed or endorsed by the publisher.
AbbreviationsCMR, cardiovascular magnetic resonance; T2DM, type 2 diabetes mellitus; ECV, extracellular volume; HTN, hypertension; IR, inversion recovery; LGE, late-gadolinium enhancement; LVH, left ventricular hypertrophy; MOLLI, modifier look-locker imaging; MRF, magnetic resonance fingerprinting; NAFLD, non-alcoholic fatty liver disease; NASH, non-alcoholic steatohepatitis; QMRI, quantitative magnetic resonance imaging; SR, saturation recovery.
References1. Messroghli D, Moon J, Ferreira V, Grosse-Wortmann L, He T, Kellman P, et al. Clinical recommendations for cardiovascular magnetic resonance mapping of T1, T2, T2* and extracellular volume: a consensus statement by the society for cardiovascular magnetic resonance (SCMR) endorsed by the European association for cardiovascular imaging (EACVI). J Cardiovasc Magn Reson. (2017) 19:75.
2. Thomaides-Brears H, Lepe R, Banerjee R, Duncker C. Multiparametric MR mapping in clinical decision-making for diffuse liver disease. Abdom Radiol. (2020) 45:3507–22. doi: 10.1007/s00261-020-02684-3
PubMed Abstract | CrossRef Full Text | Google Scholar
3. Ferreira V, Schulz-Menger J, Holmvang G, Kramer C, Carbone I, Sechtem U, et al. Cardiovascular magnetic resonance in nonischemic myocardial inflammation: expert recommendations. J Am Coll Cardiol. (2018) 72:3158–76. doi: 10.1016/j.jacc.2018.09.072
PubMed Abstract | CrossRef Full Text | Google Scholar
4. Dorbala S, Ando Y, Bokhari S, Dispenzieri A, Falk R, Ferrari V, et al. ASNC/AHA/ASE/EANM/HFSA/ISA/SCMR/SNMMI expert consensus recommendations for multimodality imaging in cardiac amyloidosis: part 1 of 2—evidence base and standardized methods of imaging. Circ Cardiovasc Imaging. (2021) 14:e000029.
5. Deva D, Hanneman K, Li Q, Ng M, Wasim S, Morel C, et al. Cardiovascular magnetic resonance demonstration of the spectrum of morphological phenotypes and patterns of myocardial scarring in Anderson-Fabry disease. J Cardiovasc Magn Reson. (2016) 18:14. doi: 10.1186/s12968-016-0233-6
留言 (0)