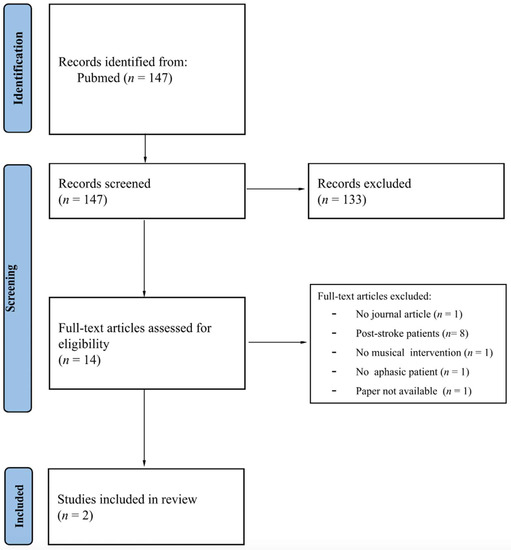
Figure 1.
Flowchart of the study selection process.
![Biomedicines 11 00080 g001]() Figure 2.
Figure 2.
Forest plots. (
A) Primary outcome: comparison between baseline and endpoint of active groups [
19,
20,
21,
22,
23,
24,
25,
26]. (
B) Secondary outcome: comparison between endpoints of both active and placebo groups [
20,
22,
24,
25].
![Biomedicines 11 00080 g002]() Figure 3.
Figure 3.
Electric field modeling analysis [
19,
20,
21,
22,
23,
24,
25,
26]. (
A) Mean and standard deviation of electric field strength of montages across different brain regions of interest. (
B) Electric field distribution based on the different montages used. Note: For this analysis, we used the D’Urso et al. study (cathode) as reference, as this montage has already been found to produce stronger EFs in regions of interest for OCD [
41,
42]. A higher mean represents a stronger EF in the regions of interest. Results displayed in bold font represent significance in comparison to D’Urso et al., 2016 (cathode). Therefore, Da Silva et al., 2021 [
22] and D’Urso et al., 2006 (anode) [
23] did not show any EF strength differences in comparison to the reference montage. Abbreviation: ACC—anterior cingulate cortex; N/A—not applicable (For the left ACC analysis, the electric field modeling was able to quantify only one subregion. Therefore, no standard deviation is presented.); ROI—region of interest; SMA—supplementary motor area. p-values represent the linear regression results. p-values ≤ 0.05 were considered significant.
![Biomedicines 11 00080 g003]()
Table 1.
Summary of the included studies.
Table 1.
Summary of the included studies.
Demographic DataClinical DatatDCS Strategy ReferenceSample SizeMean Age% FemaleTreat. StrategyTRDNumber of SessionsCurrent IntensityDuration (min)Electrode PositionElectrode Size (cm2)Study DesignRisk of BiasBation et al. (2016) [
21]844.2 (13.8)75Add-onYes10220Anode: right cerebellum
Cathode: left OFC35Open label trialModerateBation et al. (2019) [
20]2143 (15.9)57.14Add-onYes10220Anode: right cerebellum
Cathode: left OFC35RCTLowDa Silva et al. (2021) [
22]4437.65 (11.59)60.46Add-onYes20230Anode: left deltoid
Cathode: SMA25RCTLowD’Urso et al. (2016) [
23] (cathode)6N/IN/IAdd-onYes10220Anode: right deltoid
Cathode: bilateral pre-SMA35 and 25Partial cross-over, repeated measures ModerateD’Urso et al. (2016) [
23] (anode)6N/IN/IAdd-onYes10220Anode: bilateral pre-SMA
Cathode: right deltoid25 and 35Partial cross-over, repeated measures ModerateGermaneau et al. (2020) [
19]2142.7 (13)38.1Add-onYes10230Anode: right supraorbital area
Cathode: bilateral SMA35Open label trialModerateGowda et al. (2019) [
25]2528.37 (5.51)16Add-onYes10220Anode: pre-SMA
Cathode: right supraorbital area35RCTSome ConcersKumar et al. (2021) [
26]2021.6 (7.64)45Add-onYes20220Anode: right occipital area
Cathode: SMA25*Open label trialModerateYoosefee et al. (2020) [
24]6037.25 (24.1)81.6AugmentationN/I24220Anode: left DLPFC
Cathode: right OFC35RCTLow
Table 2.
Results of univariate meta-regression analyses.
Table 2.
Results of univariate meta-regression analyses.
Coef (B)95% CIp Lower LimitUpper LimitAugmentation Strategy−0.02−0.880.460.54Sessions per day0.49−0.181.180.15Session duration −0.27−0.090.410.43Number of weeks−0.05−0.160.480.27Session total−0.03−0.080.010.18

 Figure 2.
Forest plots. (A) Primary outcome: comparison between baseline and endpoint of active groups [
Figure 2.
Forest plots. (A) Primary outcome: comparison between baseline and endpoint of active groups [ Figure 3.
Electric field modeling analysis [
Figure 3.
Electric field modeling analysis [
留言 (0)