


記住我
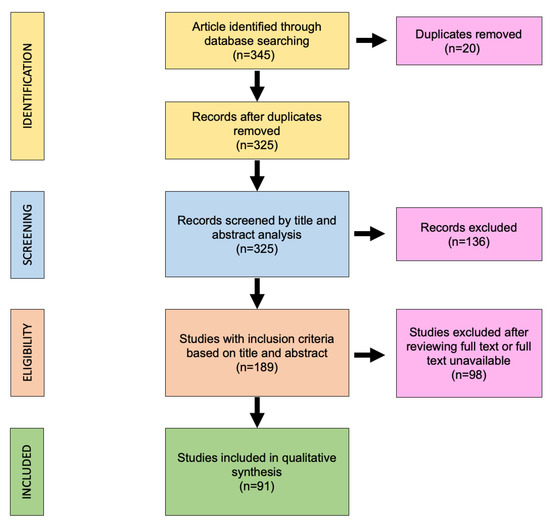
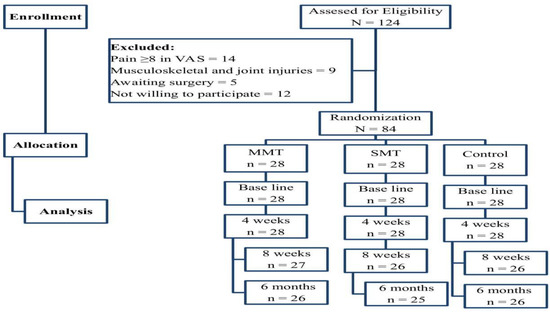

Figure 1. Selection of study patients.
Figure 2. Kaplan–Meier curves for the time to the first repeat GP consultation for disturbed sleep in patients treated with Silexan versus Z-drugs.
Figure 3. Proportion of Silexan and Z-drug patients with a repeat diagnosis of sleep disorder within 15 days up to one year after the index date.
Table 1. Basic characteristics of the study sample after propensity score matching.
Table 1. Basic characteristics of the study sample after propensity score matching.
VariablePatients with Silexan PrescriptionPatients with Z-Drug Prescriptionp-ValueN520490,526 Age mean (SD)48.7 (19.2)61.5 (18.2)<0.00116–30 years [n (%)]1172 (22.5%)5948 (6.6%)<0.00131–40 years [n (%)]680 (13.1%)7255 (8.0%)<0.00141–50 years [n (%)]938 (18.0%)12,090 (13.4%)<0.00151–60 years [n (%)]982 (18.9%)16,669 (18.4%)0.40961–70 years [n (%)]594 (11.4%)14,668 (16.2%)<0.001>70 years [n (%)]838 (16.1%)33,896 (37.4%)<0.001Sex: female [n (%)]3456 (66.4%)53,982 (59.6%)<0.001Private health insurance [n (%)]622 (12.0%)9020 (10.0%)<0.001Depression1128 (21.7%)16,665 (18.4%)<0.001Anxiety disorder586 (11,3%)4945 (5.5%)<0.001Reaction to severe stress and adjustment disorder685 (13.2%)7226 (8.0%)<0.001Diabetes345 (6.6%)12,233 (13.5%)<0.001Back pain1216 (23.4%)20,396 (22.5%)0.161Osteoarthritis 392 (7.5%)9939 (11.0%)<0.001Chronic bronchitis/COPD210 (4.0%)6679 (7.4%)<0.001Cancer167 (3.2%)7864 (8.7%)<0.001Table 2. Association between Silexan prescription and the probability of a repeated sleep disorder diagnosis within a period of 15–365 days after the index date (multivariable logistic regression).
Table 2. Association between Silexan prescription and the probability of a repeated sleep disorder diagnosis within a period of 15–365 days after the index date (multivariable logistic regression).
VariableOdds Ratio (95% CI) *p-ValueSilexan versus Z-Drugs0.56 (0.51–0.60)<0.001Male vs. female1.01 (0.98–1.04)0.659Age: 18–30 yearsReference Age: 31–40 years1.25 (1.15–1.36)<0.001Age: 41–50 years1.43 (1.32–1.54)<0.001Age: 51–60 years1.64 (1.52–1.76)<0.001Age: 61–70 years1.93 (1.79–2.08)<0.001Age: 70+ years2.49 (2.32–2.68)<0.001Private health insurance vs. statutory insurance1.23 (1.17–1.29)<0.001Depression1.35 (1.30–1.40)<0.001Anxiety disorder1.19 (1.12–1.26)<0.001Reaction to severe stress and adjustment disorder1.06 (1.01–1.12)0.030Diabetes1.33 (1.28–1.39)<0.001Back pain1.14 (1.10–1.18)<0.001Osteoarthritis1.24 (1.19–1.30)<0.001Chronic bronchitis/COPD1.37 (1.30–1.44)<0.001Cancer1.13 (1.08–1.19)<0.001Table 3. Association between Silexan prescription and the probability of a repeat sleep disorder diagnosis within a period of 15–365 days after the index date, stratified by age group [Silexan versus Z-Drugs] (multivariable logistic regression).
Table 3. Association between Silexan prescription and the probability of a repeat sleep disorder diagnosis within a period of 15–365 days after the index date, stratified by age group [Silexan versus Z-Drugs] (multivariable logistic regression).
Age StratificationOdds Ratio (95% CI) *p-ValueAge: 16–30 years0.56 (0.46–0.69)<0.001Age: 31–40 years0.65 (0.52–0.82)<0.001Age: 41–50 years0.57 (0.47–0.69)<0.001Age: 51–60 years0.53 (0.44–0.63)<0.001Age: 61–70 years0.48 (0.38–0.59)<0.001Age: 70+ years0.58 (0.50–0.68)<0.001
留言 (0)