


記住我

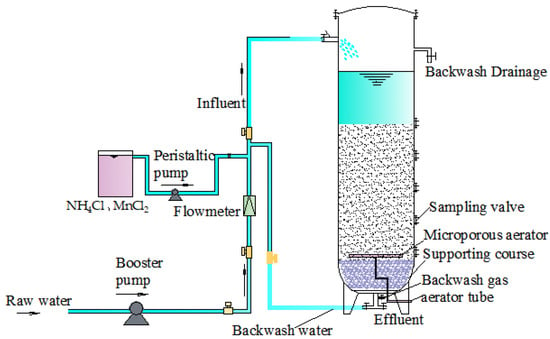
Figure 1. The flow chart for treatment of CG samples derived from the discarded natural coal gangue.
Figure 1. The flow chart for treatment of CG samples derived from the discarded natural coal gangue.
Figure 2. The adsorption kinetic curves of TC by CG: (a) the proposed schematic diagram of TC adsorption by CG with increasing contact time; (b) effect of contact time on TC adsorption by CG, (c) the quasi-first order kinetic model fitting line; (d) the quasi-second order kinetic model fitting line. (TC concentration of 40 mg/L, CG dosage of 1 g/L, pH of 6.2, contact temperature of 25 °C, and stirring speed of 120 rpm).
Figure 2. The adsorption kinetic curves of TC by CG: (a) the proposed schematic diagram of TC adsorption by CG with increasing contact time; (b) effect of contact time on TC adsorption by CG, (c) the quasi-first order kinetic model fitting line; (d) the quasi-second order kinetic model fitting line. (TC concentration of 40 mg/L, CG dosage of 1 g/L, pH of 6.2, contact temperature of 25 °C, and stirring speed of 120 rpm).
Figure 3. The adsorption isotherms curves of TC by CG: (a) impact of initial TC concentration on adsorption capacity under different temperatures (25 °C, 35 °C, 45 °C), (CG dosage of 1 g/L, contact time of 3h, pH of 6.2 and 120 rpm); (b) Langmuir and Freundlich adsorption isotherm of TC adsorbed by CG under different temperature (25 °C, 35 °C, 45 °C), (c) Plot of LnKd vs. 1/T for TC adsorption by CG.
Figure 3. The adsorption isotherms curves of TC by CG: (a) impact of initial TC concentration on adsorption capacity under different temperatures (25 °C, 35 °C, 45 °C), (CG dosage of 1 g/L, contact time of 3h, pH of 6.2 and 120 rpm); (b) Langmuir and Freundlich adsorption isotherm of TC adsorbed by CG under different temperature (25 °C, 35 °C, 45 °C), (c) Plot of LnKd vs. 1/T for TC adsorption by CG.
Figure 4. Effect of adsorbent dosage for TC adsorption: (a) Effect of CG dosage on removal efficiency and adsorption capacity of TC by CG (contact time of 3 h, TC concentration of 40 mg/L, pH of 6.2 and temperature of 25 °C, 120 rpm); (b) the proposed schematic diagram of TC adsorption by CG with increasing CG dosage.
Figure 4. Effect of adsorbent dosage for TC adsorption: (a) Effect of CG dosage on removal efficiency and adsorption capacity of TC by CG (contact time of 3 h, TC concentration of 40 mg/L, pH of 6.2 and temperature of 25 °C, 120 rpm); (b) the proposed schematic diagram of TC adsorption by CG with increasing CG dosage.
Figure 5. Effect of adsorbent particle size for TC adsorption: (a) Effect of CG particle size on removal efficiency and adsorption capacity of TC by CG (contact time of 3 h, TC concentration of 40 mg/L, CG dosage of 1 g/L, pH of 6.2 and temperature of 25 °C, 120 rpm), (b) the proposed schematic diagram of TC adsorption by CG with reduced CG particle size.
Figure 5. Effect of adsorbent particle size for TC adsorption: (a) Effect of CG particle size on removal efficiency and adsorption capacity of TC by CG (contact time of 3 h, TC concentration of 40 mg/L, CG dosage of 1 g/L, pH of 6.2 and temperature of 25 °C, 120 rpm), (b) the proposed schematic diagram of TC adsorption by CG with reduced CG particle size.
Figure 6. Effect of solution pH for TC adsorption: (a) Effect of solution pH on removal efficiency of TC by CG (contact time of 3 h, TC concentration of 40 mg/L, CG dosage of 1 g/L, contact temperature of 25 °C, and stirring speed of 120 rpm); (b) the Zeta potential of CG with increasing pH in an aqueous solution, (c) the proposed schematic diagram of TC adsorption by CG with increasing solution pHs.
Figure 6. Effect of solution pH for TC adsorption: (a) Effect of solution pH on removal efficiency of TC by CG (contact time of 3 h, TC concentration of 40 mg/L, CG dosage of 1 g/L, contact temperature of 25 °C, and stirring speed of 120 rpm); (b) the Zeta potential of CG with increasing pH in an aqueous solution, (c) the proposed schematic diagram of TC adsorption by CG with increasing solution pHs.
Figure 7. The material characterization results of CG particles: (a) SEM images of the CG before adsorption; (b) XRD; (c) The FT-IR spectra of the CG before and after adsorption; (d) the nitrogen adsorption–desorption isotherms before and after reaction.
Figure 7. The material characterization results of CG particles: (a) SEM images of the CG before adsorption; (b) XRD; (c) The FT-IR spectra of the CG before and after adsorption; (d) the nitrogen adsorption–desorption isotherms before and after reaction.
Figure 8. The proposed adsorption mechanism of TC adsorption by CG.
Figure 8. The proposed adsorption mechanism of TC adsorption by CG.
Table 1. The thermodynamic parameters for TC adsorption by CG.
Table 1. The thermodynamic parameters for TC adsorption by CG.
T (K)ΔG (J/mol)ΔH (KJ/mol)ΔS (J/mol·K)R2298−1154308−174418.63566.3470.999318−2326Table 2. The comparisons of TC adsorption between CG and other minerals.
Table 2. The comparisons of TC adsorption between CG and other minerals.
Used MineralsConcentration of Pollutants and Adsorption Equilibrium TimeAdsorption Capacity Qmax
留言 (0)