


記住我
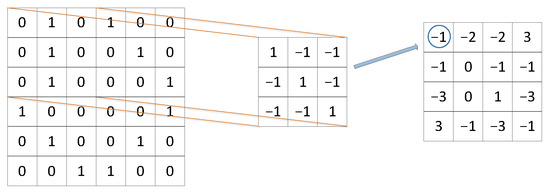


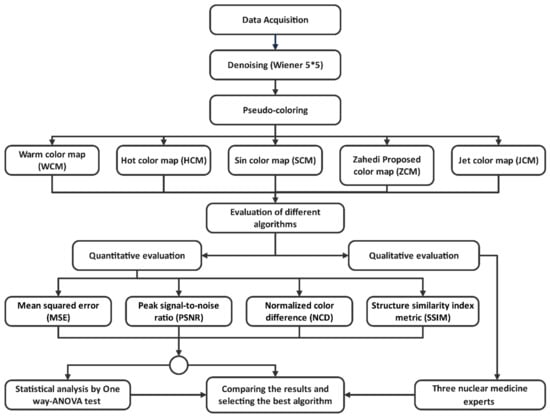


Figure 1. Steps of the study.
Figure 1. Steps of the study.
Figure 2. Flowchart of patient inclusion and exclusion.
Figure 2. Flowchart of patient inclusion and exclusion.
Figure 3. The basic principle of the pseudo-coloring process.
Figure 3. The basic principle of the pseudo-coloring process.
Figure 4. The visual results of WCM, HCM, SCM, ZCM, and JCM pseudo-coloring algorithms for a 61-year-old male. Note: WCM: Warm color map; HCM: Hot color map; SCM: Sine color map; ZCM: Zahedi-proposed color map; JCM: Jet color map.
Figure 4. The visual results of WCM, HCM, SCM, ZCM, and JCM pseudo-coloring algorithms for a 61-year-old male. Note: WCM: Warm color map; HCM: Hot color map; SCM: Sine color map; ZCM: Zahedi-proposed color map; JCM: Jet color map.
Figure 5. The graphs of the mean of (a) MSE, (b) PSNR, (c) NCD, and (d) SSIM. Note. MSE: Mean squared error; PSNR: Peak signal-to-noise ratio; NCD: Normalized color difference; SSIM: Structure similarity index metric.
Figure 5. The graphs of the mean of (a) MSE, (b) PSNR, (c) NCD, and (d) SSIM. Note. MSE: Mean squared error; PSNR: Peak signal-to-noise ratio; NCD: Normalized color difference; SSIM: Structure similarity index metric.
Figure 6. The box plots of (a) MSE, (b) PSNR, (c) NCD, and (d) SSIM. Note. MSE: Mean squared error; PSNR: Peak signal-to-noise ratio; NCD: Normalized color difference; SSIM: Structure similarity index metric.
Figure 6. The box plots of (a) MSE, (b) PSNR, (c) NCD, and (d) SSIM. Note. MSE: Mean squared error; PSNR: Peak signal-to-noise ratio; NCD: Normalized color difference; SSIM: Structure similarity index metric.
Table 1. Obtained MSE, PSNR, NCD, and SSIM indices by applying different pseudo-coloring algorithms for the myocardial perfusion SPECT image of a 61-year-old male. The up arrow (↑) indicates that the larger the average value, the better the model performance. The down arrow (↓) has the opposite meaning.
Table 1. Obtained MSE, PSNR, NCD, and SSIM indices by applying different pseudo-coloring algorithms for the myocardial perfusion SPECT image of a 61-year-old male. The up arrow (↑) indicates that the larger the average value, the better the model performance. The down arrow (↓) has the opposite meaning.
Pseudo-Coloring/IndexMSE (↓)PSNR (dB) (↑)NCD (↓)SSIM (↑)Warm color map (WCM)0.002726.30550.15840.9577Hot color map (HCM)0.007521.93800.32840.9147Sine color map (SCM)0.32344.90260.07320.6139Zahedi-proposed color map (ZCM)0.32564.87320.22320.5906Jet color map (JCM)0.093810.27790.19140.6115Table 2. Average (± standard deviation (SD)) indices of mean squared error (MSE), peak signal-to-noise (PSNR), normalized color difference (NCD), and structure similarity index metric (SSIM) for different applied pseudo-coloring algorithms in this study. The up arrow (↑) indicates that the larger the average value, the better the model performance. The down arrow (↓) has the opposite meaning.
Table 2. Average (± standard deviation (SD)) indices of mean squared error (MSE), peak signal-to-noise (PSNR), normalized color difference (NCD), and structure similarity index metric (SSIM) for different applied pseudo-coloring algorithms in this study. The up arrow (↑) indicates that the larger the average value, the better the model performance. The down arrow (↓) has the opposite meaning.
Pseudo-Coloring/IndexMSE ± SD (↓)PSNR (dB) ± SD (↑)NCD ± SD (↓)SSIM ± SD (↑)Warm color map (WCM)0.0021 ± 0.000627.5484 ± 1.30410.1406 ± 0.00890.9643 ± 0.0086Hot color map (HCM)0.0060 ± 0.001722.9967 ± 1.25850.2903 ± 0.02320.9268 ± 0.0170Sine color map (SCM)0.3254 ± 0.00234.8754 ± 0.03130.0730 ± 0.00390.6196 ± 0.0102Zahedi-proposed color map (ZCM)0.3269 ± 0.00154.8551 ± 0.02080.1971 ± 0.01540.6001 ± 0.0142Jet color map (JCM)0.0931 ± 0.002210.3115 ± 0.10150.1774 ± 0.00920.6175 ± 0.0116
留言 (0)