
記住我


There is a growing general awareness of substance abuse in women and the importance of gender in medical research and treatment. Biological and psychological differences between men and women may manifest differently in the cognition and personality of those with substance use disorder (SUD). Women have been found to be more susceptible than men to alcohol’s effects on behavioral and cognitive functions.1 Evidence suggest that females are more impaired in tasks of executive functions,2,3 visual memory,3 and wechsler adult intelligence scale (WAIS) scores.4 In contrast, gender does not appear to influence the impairment of cognitive functions in tests of memory, attention, visuospatial ability, and language in the Repeatable Battery for the Assessment of Neuropsychological Status (RBANS).5 In addition, men and women do not differ in the Montreal Cognitive Assessment (MoCA); there are no differences in visuospatial and executive functions, memory, attention, language, and delayed recall tests.6
Differences in personality factors between males and females with alcohol and substance users have been marginally examined. Mulder reviewed personality-based explanations in alcoholism research, interest in which increased in the 1980s. It appeared that patients with alcohol use disorder who also abuse other substances have different personality characteristics from those who do not.7 Individuals who abuse other substances are younger, more impulsive, disinhibited, and extroverted. Moreover, studies have shown that personality may be an important mediator of the genetic effects of alcoholism. The majority of studies have centered on antisocial personality disorder and conduct disorder, while others have focused on normally distributed personality disorders. Studies have found a clear association between antisocial behavior and alcoholism; measures of impulsivity or novelty seeking appeared less predictive. In women, high negative emotionality may predate alcoholism. Nevertheless, personality variables explain a small proportion of the risk of dependence. Vulnerability to alcoholism is increased by poorer educational achievement, deviant peers, and general disadvantage.7
The results of a study of the Minnesota Multiphasic Personality Inventory (MMPI) profiles indicated that scale 4 (ie, psychopathic deviance) is likely to be elevated in individuals who abuse substances.8 Scale 4 is typically not significantly elevated in medical patients. The 24/42 (ie, depression-psychopathic) 2-point code type is found in men with alcohol use disorder. This same code type and the 46/64 (ie, psychopathic-paranoia) code type are often found in women with alcohol use disorder. Neither of these code types is common in other medical patients who do not abuse alcohol.
Gender differences in comorbidity are also important. The prevalence of personality disorders in alcoholism ranges from as low as 22% to 40% to as high as 58% to 78%.9 Anxiety and mood disorders are the most prevalent comorbid disorders in women with alcohol use disorder, whereas substance abuse and antisocial personality disorders are most frequent in men with alcohol use disorder. In a large sample, women diagnosed with borderline personality disorder more often than men, whereas men had higher rates of antisocial and narcissistic personality disorders than women.10
Previous studies have not ruled out the fact that the worst neuropsychological performance of men and women is limited to premorbid cognitive differences and education nor have they considered the impact of the onset age of regular substance use on differences in personality characteristics between men and women. The present study examined (1) the cognitive and personality differences between men and women; (2) the impact of education level, duration of regular substance use, and singlesubstance and polysubstance use on cognition; and (3) the impact of education level, onset age of regular substance use, and singlesubstance and polysubstance use on personality characteristics.
METHODS ParticipantsThis research is a retrospective cross-sectional study. Data was collected from patients of Järvenpää Addiction Hospital who underwent neuropsychological examination in 2004 to 2012. An abstinence period of one month was required before testing, given the longer-lasting, subacute cognitive, and neural effects of cannabis.
The inclusion criteria were as follows: (1) aged 18 to 65 years, (2) native Finnish speakers with a substance use diagnosis, and (3) minimum of one month of abstinence. Meanwhile, the exclusion criteria were as follows: (1) younger than 18 years old; (2) human immunovirus-positive patients or those having other chronic diseases possibly affecting the central nervous system; and (3) history of neurological disorder, opioid substitution treatment, or epileptic seizures.
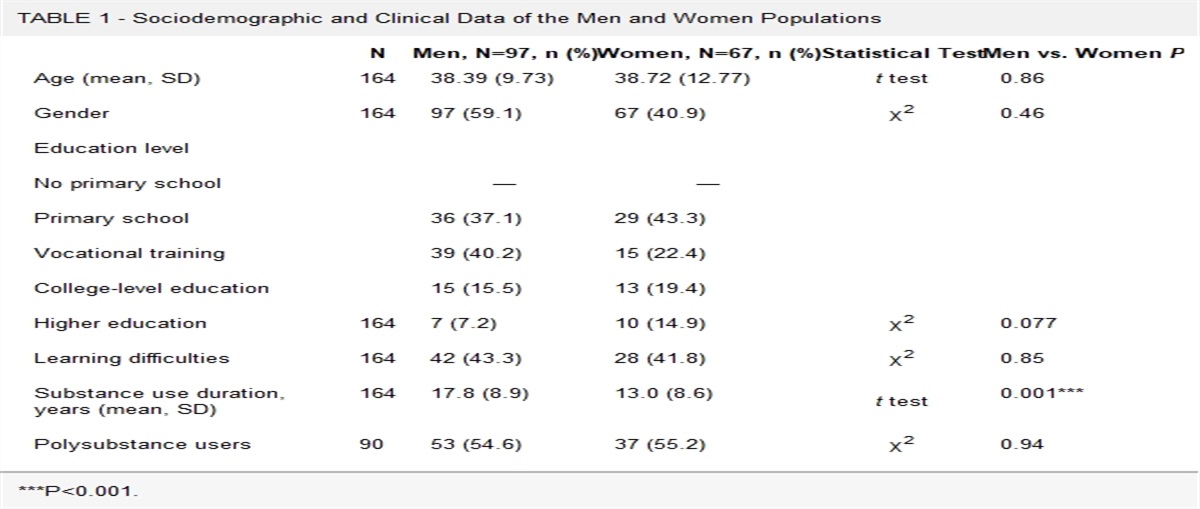
The study group consisted of 164 hospitalized patients with SUD, both men (n=97) and women (n=67). No gender differences were found in age, level of education, learning difficulties, or polysubstance use. Duration of regular substance use was significantly longer in men than in women. This variable was controlled in later statistical analyses (Table 1).
TABLE 1 - Sociodemographic and Clinical Data of the Men and Women Populations N Men, N=97, n (%) Women, N=67, n (%) Statistical Test Men vs. Women P Age (mean, SD) 164 38.39 (9.73) 38.72 (12.77) t test 0.86 Gender 164 97 (59.1) 67 (40.9) χ2 0.46 Education level No primary school — — Primary school 36 (37.1) 29 (43.3) Vocational training 39 (40.2) 15 (22.4) College-level education 15 (15.5) 13 (19.4) Higher education 164 7 (7.2) 10 (14.9) χ2 0.077 Learning difficulties 164 42 (43.3) 28 (41.8) χ2 0.85 Substance use duration, years (mean, SD) 164 17.8 (8.9) 13.0 (8.6) t test 0.001*** Polysubstance users 90 53 (54.6) 37 (55.2) χ2 0.94The majority of subjects used alcohol as a singlesubstance, with (89.4% among men and 80.0% among women). About half of the men (48%) and more than half of the women (55%) were polysubstance users. The majority of polysubstance users abused alcohol (ie, 80.0% among men and 62.2% among women) in addition to sedatives, cannabis, opioids, and stimulants.
Experienced psychiatrists made the diagnoses following the criteria of ICD-10 based on all available information at the time of discharge. SUD diagnoses also included alcohol overuse or dependence. Data on the years of regular substance use was obtained from medical records, medical examinations, and interviews with a nurse and a social worker.
The study was approved by the ethical committee of the A-Clinic Foundation (23.1.2013). All procedures followed were in accordance with the ethical standards of the responsible committee on human experimentation, both institutional and national, and the Helsinki Declaration of 1975, as revised in 2000 (5). Patients had informed consent of the aims of the study, and their participation was voluntary.
MEASURES Neuropsychological AssessmentsNeuropsychological testing was conducted as part of a work clinical assessment and a treatment plan assessment by the first author who is experienced in using the methods. Table 2 presents all neuropsychological measures.
TABLE 2 - Neuropsychological Measures Cognitive Domain Test Score Units Premorbid IQ Vocabulary (WAIS-R; Wechsler, 1975) Standard score Attention Digit Span Forward Total raw score, max 12 Digit Span Backward Total raw score, max 12 Speed of Processing Digit Symbol (WAIS-R; Wechsler, 1975) Standard Score Simple reaction time (CogniSpeed; Revonsuo et al, 1993) Time to complete (ms) Perceptual Reasoning Block Design (WAIS-R; Wechsler, 1975) Standard Score Raven Standard Matrices (Raven, 2004) Verbal Memory and Learning Verbal subtests of the WMS-R (Wechsler, 1987) Verbal Memory Index Immediate Logical Memory Total raw score, max 50 Delayed recall of Logical Memory Total raw score, max 50 Immediate Associate Learning Total raw score, max 24 Delayed recall of Associate Learning Total raw score, max 8 Visual Memory and Learning Visual subtests of (WMS-R (Wechsler, 1987) Visual Memory Index Immediate Visual Learning Total raw score, max 18 Delayed recall of Visual Learning Total raw score, max 6 Immediate Visual Reproduction Total raw score, max 41 Delayed recall of Visual Reproduction Total raw score, max 41 Delayed Memory WMS-R (Wechsler, 1987) Delayed Memory Index Inhibitory Capacity CogniSpeed version of the Stroop Color-Word Test (Stroop, 1935) Time to complete (ms), and number of errors Neutral Condition, COL Congruous Word Condition, CON Incongruous Word Condition, IN Executive Function CogniSpeed version of the Stroop Color-Word Test (Stroop, 1935) Time to complete (ms) Total Stroop (IN-CON) Stroop Interference (IN-COL)IQ indicates intelligence quotient; WAIS, wechsler adult intelligence scale.
The computerized CogniSpeed tasks11 were used to measure simple reaction time and automatic and conscious information processing. The Simple Reaction Time subtest of the computerized CogniSpeed test battery was performed first. Inhibitory capacity was assessed by the CogniSpeed version of the Stroop Color-Word Test.12 The test has 3 subtests: (1) Neutral Condition (COL), (2) Congruous Word Condition CON, and (3) Incongruous Word Condition (IN). COL and CON are related to more automatic information processing, while IN involves more conscious and effort-intensive processing. The Total Stroop Effect is the difference between reaction times in CON and IN, whereas Stroop Interference is the difference between reaction times in IN and COL.
Studies have confirmed that the CogniSpeed software is a sensitive instrument for measuring the performance of healthy participants and patients with brain disease.11,13,14
Personality AssessmentPersonality variables were measured using the subscales of the MMPI, namely hypochondriasis, depression, hysteria, psychopathic deviate, masculinity-femininity, paranoia, psychasthenia, schizophrenia, and hypomania scales.8,15
Statistical AnalysesThe sociodemographic data of the 2 patient groups were compared using the Student t test and Mann-Whitney U test for continuous measurements and the χ2 test or the Fisher exact test for categorical variables. For statistical comparisons, P<0.05 was considered statistically significant.
Analysis of covariance was used to study associations between neuropsychological measures and men and women populations, controlling for education level, regular substance use in years, polysubstance use (yes/no), and calendar age. Analysis of covariance was also used to study associations between personality variables and men and women populations, controlling for education level, polysubstance use (yes/no) and onset age of regular substance use. Explanatory variables and interactions that do not significantly affect the primary outcome were removed from the analysis. Every neuropsychological measurement was analyzed separately. Model-based means were also presented. Logarithmic transformation was used for simple reaction time, IN and COL to achieve normal distribution assumption for residuals. Data was analyzed by using the Statistical Package for Social Sciences software (SPSS Inc., Chicago, IL) and the SAS System version 9.4 for Windows (SAS Institute Inc., Cary, NC).
RESULTS Analyses of Covariance of Neuropsychological TestsThe primary differences between men and women in the neuropsychological tests are presented in Table 3.
TABLE 3 - Group Comparisons of Neuropsychological Measures Men, N=95 Women, N=67 Cognitive Domain N Mean (SD); Median (Interquartile Range: 25%-75%) N Mean (SD); Median (Interquartile Range: 25%-75%) P (t test) P (Mann-Whitney U test) Premorbid IQ Vocabulary 95 8.36 (2.6) 67 9.33 (2.8) 0.026* Attention Digit span forward 95 5.95 (1.1) 67 6.00 (1.0) 0.76 Digit span backward 95 4.60 (1.1) 67 4.69 (1.0) 0.62 Speed of processing Digit symbol 54 4.31 (2.7) 46 5.70 (2.7) 0.012* Simple reaction time Dominant hand 92 368.0 (335.8-454.8) 61 378.0 (325.5-453.0) 0.93 Nondominant hand 89 362.0 (328.0-427.0) 61 389.0 (335.5-467.0) 0.38 Perceptual reasoning Block design 33 7.85 (3.6) 31 8.23 (2.8) 0.64 Raven 88 102.67 (14.4) 60 95.82 (11-7) 0.003** Verbal memory and learning Verbal memory index 42 93.62 (16.8) 25 99.00 (17.0) 0.21 Immediate logical memory 42 24.00 (8.9) 25 26.92 (7.6) 0.18 Delayed logical memory 41 19.15 (9.4) 35 23.08 (7.6) 0.87 Immediate associate learning 42 16.40 (4.5) 25 18.12 (5.4) 0.17 Delayed associate learning 41 6.54 (2.9) 24 6.75 (1.5) 0.74 Visual memory and learning Visual memory index 40 77.38 (22.0) 25 81.52 (21.6) 0.46 Immediate visual learning 41 10.59 (6.9) 24 12.33 (5.6) 0.30 Delayed visual learning 40 4.18 (1.8) 24 4.79 (1.9) 0.19 Immediate visual reproduction 42 34.38 (5.4) 25 34.48 (3.9) 0.94 Delayed visual reproduction 41 28.32 (9.9) 24 28.08 (9.0) 0.93 Delayed memory Delayed memory index 40 79.43 (22.8) 25 86.08 (18.9) 0.23 Inhibitory capacity Neutral Condition (COL) COL ms 92 575.5 (493.3-714.3) 61 561.0 (484.5-632.0) 0.54 COL errors 92 1.0 (0.3-3.0) 61 1.0 (0.0-2.0) 0.05 Congruous Word Condition (CON) CON ms 92 539.0 (485.8-641.5) 61 542.0 (464.5-625.0) 0.40 CON errors 92 1.0 (0.0-2.0) 61 1.0 (0.0-2.0) 0.17 Incongruous Word Condition (IN) IN ms 91 686.0 (550.0-921.0) 61 642.0 (569.0-839.5) 0.88 IN errors 91 1.0 (0.0-4.0) 61 2 (0.0-4.0) 0.55*P<0.05.
**P<0.01.
IQ indicates intelligence quotient.
There were significant differences between men and women in a test of Vocabulary of WAIS-R, the Digit Symbol test, and the Raven test. Women performed better in the Vocabulary test and were faster in the Digit Symbol test, while men performed better in the Raven test indicating better skills in perceptual reasoning. Performance in the Digit Symbol test was, however, below normal average for both men and women. Tests of visual memory and learning and delayed memory were also below average in both men and women. Men were clinically below average in tests of Visual Memory Index. Both men and women were as slow as 63-year and 64-year olds in tasks of Stroop Congruence and Incongruence.12
Neuropsychological tests were separately tested, adjusting for calendar age, education level, polysubstance use, and years of regular substance use. Calendar age was adjusted with neuropsychological test without age correction as CogniSpeed tasks of simple reaction time, COL, CON, and IN. In addition, age was adjusted with tests of WAIS-R using original data of raw scores (ie, Digit Span Forward and Backward tests, and Block Design test).
After adjustment, all the differences between men and women disappeared, and there were no correlations nor interactions with substance use variables (ie, duration of regular substance use and multidrug use) or background variables (ie, education level).
Analyses of Covariance of the Personality Test of MMPIPersonality tests were separately tested, adjusting for education level, polysubstance use, and onset age of regular substance use. Men and women differed in almost all scales. Table 4 outlines the primary differences between men and women and the results of multiway analysis of covariance.
TABLE 4 - Results of Multiway Analysis of Covariance of the Associations Between Personality Variables of Minnesota Multiphasic Personality Inventory, Gender, and Covariables Gender Differences Gender and Covariables Personality Variables Men, N=97 Women, N=67 Gender Education Level Onset Age of Regular Use Polysubstance Use Clinical Scales Mean (SD) Mean (SD) F 141 P F 141 P F 141 P F 1n1 P Hypochondriasis (Hs) 75.85 (16.10) 69.05 (12.61) 6.98 0.0092* 0.31 0.82 0.00 0.95 0.49 0.48 Depression (D) 91.89 (18.58) 77.80 (16.65) 18.84 <0.0001*** 0.43 0.73 0.62 0.43 0.36 0.55 Hysteria (Hy) 74.21 (13.13) 68.34 (10.64) 8.55 0.0040** 1.23 0.302 0.16 0.69 2.71 0.102 Psychopathic Deviate (Pd) 80.27 (15.40) 78.19 (13.43) 0.27 0.61 1.41 0.24 1.02 0.32 3.44 0.066 Masculinity-Femininity (Mf) 63.38 (10.28) 57.97 (14.22) 4.90 0.028* 1.12 0.34 5.73 0.018* 0.32 0.57 Paranoia (Pa) 76.11 (15.68) 71.36 (11,87) 2.87 0.093 1.12 0.34 0.00 0.97 5.33 0.023* Psychasthenia (Pt) 84.84 (19.01) 73.20 (13.00) 14.20 0.0002** 0.06 0.98 0.04 0.84 4.23 0.041* Schizophrenia (Sc) 87.37 (21.79) 75.98 (14.72) 11.26 0.0010** 1.92 0.13 0.02 0.88 3.06 0.082 Hypomania (Ma) 63.78 (13.52) 67.12 (12.74) 2.99 0.086 3.41 0.019* 0.18 0.67 9.22 0.0029** Social Introversion (Si) 65.43 (13.26) 63.24 (15.88) 0.88 0.35 1.35 0.26 0.00 1.00 0.67 0.42 Validity scales Lie (L) 47.26 (7.36) 50.71 (10.96) 3.20 0.076 0.15 0.93 4.70 0.032* 0.95 0.33 Infrequency (F) 79.28 (16.52) 74.34 (14.48) 2.33 0.13 2.41 0.070 0.74 0.39 6.00 0.016* K-correction 50.11 (8.20) 56.17 (13.00)
留言 (0)