


記住我


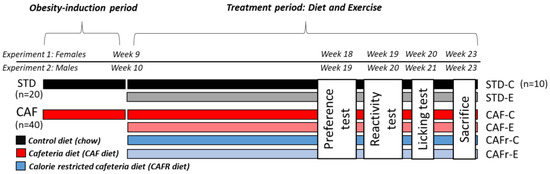

Figure 1. Study Design of Diet Intervention and Colitis Protocol. Male and female C57BL6/J mice (n = 120) were randomized into either a low (5% w/w) milk fat or high (21% w/w) milk fat diet supplemented with either 0%, 1%, or 2% w/w of milk polar lipids (MPL) for three weeks (n = 10/group/sex). Colitis was induced using 1% dextran sodium sulfate (DSS) in drinking water for the next five days and regular drinking water was given for the final five days. Colons were collected for transcriptomics by RNA sequencing, and real-time qRT-PCR, and cecal feces were collected for 16S rRNA sequencing for microbiota analysis. Fecal samples were collected for lipidomics analysis. Disease Activity Index (DAI) was recorded daily consisting of a weight loss, bleeding, and stool consistency score. Abbreviations: AMF, anhydrous milk fat; CTL, control.
Figure 1. Study Design of Diet Intervention and Colitis Protocol. Male and female C57BL6/J mice (n = 120) were randomized into either a low (5% w/w) milk fat or high (21% w/w) milk fat diet supplemented with either 0%, 1%, or 2% w/w of milk polar lipids (MPL) for three weeks (n = 10/group/sex). Colitis was induced using 1% dextran sodium sulfate (DSS) in drinking water for the next five days and regular drinking water was given for the final five days. Colons were collected for transcriptomics by RNA sequencing, and real-time qRT-PCR, and cecal feces were collected for 16S rRNA sequencing for microbiota analysis. Fecal samples were collected for lipidomics analysis. Disease Activity Index (DAI) was recorded daily consisting of a weight loss, bleeding, and stool consistency score. Abbreviations: AMF, anhydrous milk fat; CTL, control.
Figure 2. MPLs exacerbate colitis in LFD but attenuate colitis in HFD. (A) Colon weight/length ratios. (B) Daily DAI scores of female and male mice over the colitis induction and recovery periods. Area under the curve (AUC) of the DAI scores of male and female mice over the 10-day DSS protocol (C), and during the colitis induction (D), and recovery periods (E). For panel B, ** indicates p-value < 0.01 for LFD 2% vs. 0% *** indicates p-value < 0.001, # indicates p-value < 0.05 for HFD 2% vs. 0%, ## indicates p-value < 0.01 for HFD 2% vs. 0%, ### p-value < 0.001 for HFD 2% vs. 0%. For panels A and C-E, * p-value <0.05, *** p-value <0.001 using three-way ANOVA with Fisher’s least significant difference for multiple comparisons. Values reported as mean ± standard error of the mean, n = 10/sex/group.
Figure 2. MPLs exacerbate colitis in LFD but attenuate colitis in HFD. (A) Colon weight/length ratios. (B) Daily DAI scores of female and male mice over the colitis induction and recovery periods. Area under the curve (AUC) of the DAI scores of male and female mice over the 10-day DSS protocol (C), and during the colitis induction (D), and recovery periods (E). For panel B, ** indicates p-value < 0.01 for LFD 2% vs. 0% *** indicates p-value < 0.001, # indicates p-value < 0.05 for HFD 2% vs. 0%, ## indicates p-value < 0.01 for HFD 2% vs. 0%, ### p-value < 0.001 for HFD 2% vs. 0%. For panels A and C-E, * p-value <0.05, *** p-value <0.001 using three-way ANOVA with Fisher’s least significant difference for multiple comparisons. Values reported as mean ± standard error of the mean, n = 10/sex/group.
Figure 3. Transcriptomics shows MPLs augment colon inflammatory gene expression in LFD, yet attenuate inflammation in HFD in male mice. (A) Volcano plot of LFD 2% vs. 0%-fed male mice (n = 4/group). (B) Heat map of top 25 differentially expressed genes (DEG). (C) Top 10 upregulated Gene Ontology (GO): Biological Processes and KEGG Pathways. (D) Top 10 downregulated GO: Biological Processes and KEGG Pathways. (E) Volcano plot of HFD 2% vs. 0%-fed male mice (n = 4/group). (F) Heat map of top 25 DEG. (G) Top 10 Upregulated GO: Biological Processes and KEGG Pathways.
Figure 3. Transcriptomics shows MPLs augment colon inflammatory gene expression in LFD, yet attenuate inflammation in HFD in male mice. (A) Volcano plot of LFD 2% vs. 0%-fed male mice (n = 4/group). (B) Heat map of top 25 differentially expressed genes (DEG). (C) Top 10 upregulated Gene Ontology (GO): Biological Processes and KEGG Pathways. (D) Top 10 downregulated GO: Biological Processes and KEGG Pathways. (E) Volcano plot of HFD 2% vs. 0%-fed male mice (n = 4/group). (F) Heat map of top 25 DEG. (G) Top 10 Upregulated GO: Biological Processes and KEGG Pathways.
Figure 4. Effect of MPLs on colon gene expression. Colonic RNA gene expression was determined using real-time qRT-PCR and standardized to the geometric mean of Gapdh, Actb (β-actin), and Rplp0 reference genes using the 2−ΔΔCt method. (A) Interleukin (IL)-1α (Il1a), (B) IL-1β (Il1b), (C) IL-6 (Il6), (D) aconitate decarboxylase (Acod1), (E) S100a9, (F) intelectin 1 (Itln1), (G) lipocalin 2 (Lcn2), (H) CXC motif chemokine receptor 1 (Cxcl1), (I) matrix metallopeptidase 3 (Mmp3), and (J) histidine decarboxylase (Hdc). Values are reported as mean ± standard error of the mean, n = 4–7/group. * indicates p-value < 0.05, ** indicates p-value < 0.01, and *** indicates p-value < 0.001 using three-way ANOVA with Fisher’s least significant difference for multiple comparisons.
Figure 4. Effect of MPLs on colon gene expression. Colonic RNA gene expression was determined using real-time qRT-PCR and standardized to the geometric mean of Gapdh, Actb (β-actin), and Rplp0 reference genes using the 2−ΔΔCt method. (A) Interleukin (IL)-1α (Il1a), (B) IL-1β (Il1b), (C) IL-6 (Il6), (D) aconitate decarboxylase (Acod1), (E) S100a9, (F) intelectin 1 (Itln1), (G) lipocalin 2 (Lcn2), (H) CXC motif chemokine receptor 1 (Cxcl1), (I) matrix metallopeptidase 3 (Mmp3), and (J) histidine decarboxylase (Hdc). Values are reported as mean ± standard error of the mean, n = 4–7/group. * indicates p-value < 0.05, ** indicates p-value < 0.01, and *** indicates p-value < 0.001 using three-way ANOVA with Fisher’s least significant difference for multiple comparisons.
Figure 5. MPLs increase fecal microbial diversity. Cecal feces were collected and analyzed using 16S rRNA sequencing (n = 4/group). Alpha diversity (A–C), beta diversity (D), and relative abundance at phylum (E) are shown. Diversity measures were analyzed via nonmetric multidimensional scaling and taxa comparisons were analyzed via three-way ANOVA with Fisher’s Least Significant Difference for multiple comparisons.
Figure 5. MPLs increase fecal microbial diversity. Cecal feces were collected and analyzed using 16S rRNA sequencing (n = 4/group). Alpha diversity (A–C), beta diversity (D), and relative abundance at phylum (E) are shown. Diversity measures were analyzed via nonmetric multidimensional scaling and taxa comparisons were analyzed via three-way ANOVA with Fisher’s Least Significant Difference for multiple comparisons.
Figure 6. MPLs increase fecal phospholipid and sphingolipid metabolites in male mice. A heatmap of the sum of lipid classes (A) and total ceramides (B), sphingomyelin (C), and lysophosphatidylserines (D). Data were normalized using log transformation and were analyzed using a one-way ANOVA with false discovery rate FDR q-value < 0.05 (n = 3/group). Values with unlike letters indicate differences at p < 0.05 using post-hoc comparisons. Abbreviations: LysoPE, lysophosphatidylethanolamine; LysoPS, lysophosphatidylserines; LysoPG, lysophosphatidylglycerol; PI-Ceramides, phosphatidylinositol-cermamides; LysoPI, lysophosphatidylinositol; PI, phosphatidylinositol; MGDG; Monogalactosyldiacylglycerols; GlyeroPLs, glycerophospholipids; PG, phosphatidylglycerol; PS, phosphatidylserine; PE, phosphatidylethanolamine; PEtOH, phosphatidylethanol; LysoPC, lysophosphatidylcholine; PC, phosphatidylcholine.
Figure 6. MPLs increase fecal phospholipid and sphingolipid metabolites in male mice. A heatmap of the sum of lipid classes (A) and total ceramides (B), sphingomyelin (C), and lysophosphatidylserines (D). Data were normalized using log transformation and were analyzed using a one-way ANOVA with false discovery rate FDR q-value < 0.05 (n = 3/group). Values with unlike letters indicate differences at p < 0.05 using post-hoc comparisons. Abbreviations: LysoPE, lysophosphatidylethanolamine; LysoPS, lysophosphatidylserines; LysoPG, lysophosphatidylglycerol; PI-Ceramides, phosphatidylinositol-cermamides; LysoPI, lysophosphatidylinositol; PI, phosphatidylinositol; MGDG; Monogalactosyldiacylglycerols; GlyeroPLs, glycerophospholipids; PG, phosphatidylglycerol; PS, phosphatidylserine; PE, phosphatidylethanolamine; PEtOH, phosphatidylethanol; LysoPC, lysophosphatidylcholine; PC, phosphatidylcholine.
Figure 7. MPLs increase fecal ceramide and sphingolipid species in male mice. A heat map of the top 25 lipid species (A), PCA plot (B), one-way ANOVA plot (C), and phosphatidylserine (PS) 39:1 species (D) are shown. Data were normalized using log transformation and were analyzed using a one-way ANOVA with false discovery rate (FDR) q-value < 0.05 (n = 3/group). Values with unlike letters indicate differences at p < 0.05 using post-hoc comparisons. Abbreviations: Cer, Ceramide; SM, sphingomyelin.
Figure 7. MPLs increase fecal ceramide and sphingolipid species in male mice. A heat map of the top 25 lipid species (A), PCA plot (B), one-way ANOVA plot (C), and phosphatidylserine (PS) 39:1 species (D) are shown. Data were normalized using log transformation and were analyzed using a one-way ANOVA with false discovery rate (FDR) q-value < 0.05 (n = 3/group). Values with unlike letters indicate differences at p < 0.05 using post-hoc comparisons. Abbreviations: Cer, Ceramide; SM, sphingomyelin.
Table 1. Diet Composition.
Table 1. Diet Composition.
Diet Component (g per 1 kg)LFD 0%LFD 1% LFD 2% HFD 0%HFD 1% HFD 2% Casein808080808080L-Cystine333333Sucrose200200200200200200Corn Starch175172.51702017.515Lactose21.3510.68021.3510.680Anhydrous Milkfat52260207181155Soybean Oil202020202020Cellulose505050505050Mineral Mix, AIN-93G-MX (94046)434343434343Vitamin Mix, AIN-93-VX (94047)191919191919Choline Bitartrate333333TBHQ, antioxidant0.040.040.040.040.040.04Cholesterol1.51.31.121.51.31.12Skim milk powder—Dyets 40315033216603321660Beta serum powder—Tatua BSP20205.54110205.5411Calcium Carbonate (40% calcium by wt)00.681.3600.681.36Potassium Chloride (53% potassium by wt)00.190.3800.190.38Sodium Chloride (40% sodium by wt)00.250.5100.250.51Table 2. Diet Composition by Macronutrient.
Table 2. Diet Composition by Macronutrient.
Diet Component LFD 0%LFD 1%LFD 2%HFD 0%HFD 1%HFD 2%Total Protein (g/kg)200.2200.3200.4200.2200.3200.4Total Carbohydrate (g/kg)568.7566.5564.0414.0411.5409.0Total Fat (g/kg)74.776.378.0229.7231.3233.0Total Lactose (g/kg)194.0194.0194.0194.0194.0194.0Total Cholesterol (g/kg)1.61.681.682.062.062.06Total Phospholipid (g/kg)0.510.320.10.510.320.1% kcal from Protein21.421.321.317.717.717.7% kcal from Carbohydrate60.760.460.036.636.336.1% kcal from Fat17.918.318.745.74646.2Calorie Density (kcal/g)3.753.753.754.524.524.52Table 3. Body, Tissue Weights, and Food Intake.
Table 3. Body, Tissue Weights, and Food Intake.
p-Value (Three-Way ANOVA) LFD 0%LFD 1%LFD 2%HFD 0%HFD 1%HFD 2%MPLFatSexInteractionEnd Body Weight (g) Female21.52 ± 1.3021.02 ± 1.4621.27 ± 1.1121.24 ± 1.4922.87 ± 2.6021.48 ± 1.56n.s.<0.001<0.001MPL*Fat (0.018)
留言 (0)