1. IntroductionThe accurate estimation of daily energy expenditure is essential for conducting comprehensive nutrition assessments, planning menus and meals, prescribing weight and chronic disease interventions, preventing malnutrition, and determining parenteral and enteral nutrition support formulations. Factors that determine energy expenditure in humans remain under investigation, particularly in persons with a high body mass. Resting energy expenditure (REE) continues to be the most frequently measured constituent of total daily energy expenditure (TEE), as it comprises ~60–70% of TEE (with the thermic effect of food comprising ~10% and physical activity energy expenditure comprising the remaining 15–30%). Prior studies show that the prediction of REE including age, sex, height, weight, fat and/or fat-free mass as independent variables accounts for ~65% of the inter-individual variability in REE [
1,
2]. As current evidence does not support a robust genetic effect, with heritability estimates of REE being only 0.3 MJ/day [
3], it is likely that a significant portion of the unexplained inter-individual variance in REE is related to cardiometabolic risk factors including biomarkers indicative of impaired glucose or lipid metabolism and insulin resistance [
3].The findings of studies in adults with obesity on the relationship between glycemia and REE are ambiguous. Whereas one study in adults with obesity and type 2 diabetes detected no correlation between fasting plasma glucose or HbA1c and REE [
4], another showed that including fasting plasma glucose in regression modeling improved the prediction of REE by 3% [
5]. Further, glucose disposal and fasting insulin level were significant determinants of REE in Pima peoples, independent of age, sex and body composition [
6]. The relationship between glucose, insulin, insulin resistance and REE has also been observed in an inter-generational study of 149 families [
3]. More recently, a positive association between insulin resistance and REE has been shown in normal and overweight healthy adults after adjustment for age and sex [
7]. As insulin resistance is an early pathological indicator for the development of T2D, the higher REE observed in persons with T2D [
3,
8] and the metabolic syndrome [
9] may be a function of their insulin resistance.However, the gold standard method of determining the presence of insulin resistance, the hyperinsulinemic-euglycemic clamp [
10], is a costly, time-consuming and invasive approach used primarily in research settings. Consequently, surrogate markers of insulin resistance are more widely used, including the HOMA-IR and HOMA-2IR scores. Yet, the measurement of blood insulin level is not a routinely performed component of standard clinical practice, assay methods have not been standardized [
11], and it is an expensive test. Thus, other non-insulin-based surrogate indicators of insulin resistance that are more widely available across health care settings include the calculation of the ratio of triglyceride to HDL-cholesterol (TG/HDL) and the triglyceride glucose index (TyG). Both an increased plasma triglyceride level and a decreased HDL-cholesterol level are independent predictors of insulin resistance [
12]. An increased TG/HDL ratio has been observed in persons with impaired fasting glucose, prediabetes, T2D and the metabolic syndrome compared to normoglycemic individuals [
13,
14,
15]. Moreover, analysis from 10,132 participants of the U.S. National Health and Nutrition Examination Survey (NHANES) showed that each 0.1 unit increase in the TG/HDL ratio was associated with a 51% increased risk of insulin resistance after adjustment for demographic, anthropometric and clinical covariates [
16].Beyond being a surrogate biomarker of insulin resistance, an elevated TG/HDL ratio may be an indicator of imbalance in the delivery and uptake of lipids to the liver, and consequently, dysfunctional hepatic lipid metabolism that contributes to the pathophysiology of insulin resistance. Indeed, the TG/HDL ratio is independently associated with non-alcoholic fatty liver disease [
17]. Moreover, it is now under investigation that changes in the liver, including the increased delivery of free fatty acids to the liver in the state of high adiposity (obesity), when subcutaneous adipose tissue has reached its limit of expansion to store excess lipid, alters endocrine and paracrine functions to cause insulin resistance [
18]. Notably, more recent metabolomic and lipidomic methods have identified lipid families and subclasses that function in regulating insulin sensitivity and action [
19]. Yet, scientific debate continues as to the causative role and specific mechanisms underlying the impact of lipid classes on the development of insulin resistance.
The investigation of the combined effects of the traditional predictors (sex, age, height, weight) and clinically available cardiometabolic biomarkers on REE to better approximate daily energy (caloric) needs in persons of varying body mass status is limited. Therefore, the purpose of the current study was to: (1) determine the cardiometabolic biomarkers that significantly contribute to the inter-individual variation in REE after adjustment for age, sex, height, weight and fat or fat-free mass in individuals with normal weight, overweight, and obesity; and (2) assess the contribution of cardiometabolic biomarkers in the prediction of REE when individuals with a normal weight, overweight and obesity are categorized by their glycemic and metabolic syndrome status.
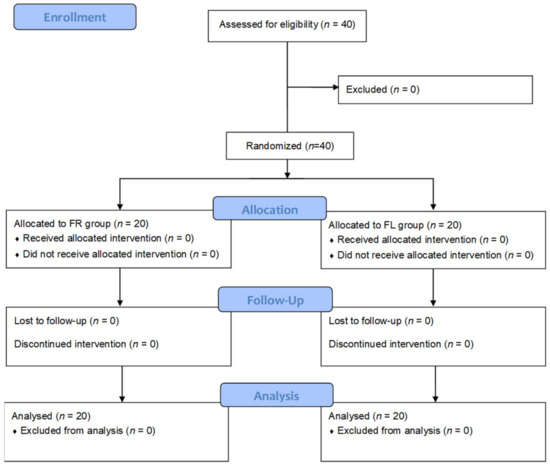
3. ResultsOf the 645 participants who met the eligibility criteria (
Figure 1), 380 (58.9%) were female, 265 (41.1%) were male, 418 (64.8%) self-identified as white and 227 (35.2%) self-identified as Black, with no significant differences observed in the proportion of participants in each of the four BMI categories by sex or race/ethnicity. Overall, 38 (5.9%) participants were normal weight, 86 (13.3%) were overweight, 442 (68.6%) had class I/II obesity and 79 (12.2%) had class III obesity (
Table 1). The average age was 42.2 ± 13.5 years, with obese participants being significantly older than normal weight participants by 7–10 years (F = 6.413, p
The primary outcome, resting energy expenditure, was significantly lower in normal weight participants compared to all other BMI groups (all Ps < 0.001), with a mean difference of an additional 266.9 ± 67.2 kcal/day being expended over 24 h in overweight participants, 247.9 ± 58.4 kcal/day in obesity class I/II participants and 492.8 ± 69.4 kcal/day in obesity class III participants. The REE in class III participants was also significantly higher than that in overweight and class I/II participants by a mean difference of 225–245 kcal/day (Ps < 0.001). There was no difference in respiratory quotient across the four groups (p = 0.24), which averaged 0.82 ± 0.06, and no significant differences among groups were observed in substrate utilization, as the proportions of fat, carbohydrates and protein being oxidized during metabolic testing were similar (all Ps > 0.20).
3.1. Differences in Linear Regression Models by BMI CategoryUnivariate analysis confirmed that there were significant associations between the traditional predictors of age, sex, height, weight and REE (
Table 2). In addition, REE correlated with fat-free mass (r = 0.76, pr = 0.19, pr = 0.34, pR2 = 0.11 vs. 0.03,
Figure 2). Measurements of regional and total fat (amounts and percentages), including VAT, were not significantly associated with REE.Multivariate regression modeling with the traditional predictors (age, sex, height, weight) accounted for 58–63% of the variance in REE: normal weight adjusted R2 = 0.62, overweight adjusted R2 = 0.63, obese class I/II adjusted R2 = 0.58, obese class III adjusted R2 = 0.61 (
Table 3, Model 1). Adjusting the traditional model for fat-free mass increased the amount of the variability in REE, accounting for only 1% in the normal weight group but for 16% in the overweight group and for 7% in the Class I/II and Class III obese groups (
Table 3, Model 2).Within these groups, there were significant differences in TG/HDL ratios and HOMA-IR scores. The TG/HDL ratio was significantly higher in overweight, obese Class I/II and obese Class III participants compared to normal weight participants (1.68 ± 0.99, 2.63 ± 2.03, 3.26 ± 2.05, respectively, vs. 1.12 ± 0.55, all Ps
Table 3, Model 3). Thus, 71–87% of the overall inter-individual variability in REE was accounted for in the models that included the TG/HDL ratio.The HOMA-IR score was 4.2–5.5 units higher in obesity Class III participants compared to normal weight, overweight and obesity Class I/II participants (all Ps
Table 3, Model 4). 3.2. Differences in Linear Regression Models by Glycemic and Metabolic Syndrome StatusTo further assess the impact of the TG/HDL ratio as a predictor of REE, we conducted two sub-analyses; first, participants were grouped by their glycemic status and then by their metabolic syndrome status. A comparison of descriptive characteristics by subgroups is presented in
Table 4 and
Table 5. Among the 645 participants, the REE was 162.5 ± 41.4 kcal/day higher in those with type 2 diabetes (T2D) compared to normoglycemic participants and 174.7 ± 47.2 kcal/day higher compared to those with prediabetes (Ps p = 0.93).As with REE, there was no significant difference detected in HOMA-IR scores between normoglycemic and prediabetic participants (p = 0.48). However, the TG/HDL ratio differed among the three groups from 2.0 ± 1.5 in normoglycemic participants to 2.7 ± 1.8 in prediabetic participants and 4.3 ± 2.7 in those with T2D (all Ps
Table 6 (Models 2 and 3), adding fat-free mass to the traditional model (age, sex, height, weight) and including the TG/HDL ratio as a predictor variable increased the amount of the inter-individual variance accounted for in predicting REE by 11–13%. In contrast, adding HOMA-IR to these models (
Table 6, Model 4) either reduced or increased the variance accounted for in predicting REE by only 1%.The REE, HOMA-IR score and TG/HDL ratio were also significantly higher when comparing participants by metabolic syndrome status (
Table 5), with 125.6 ± 29.4 kcal more being expended daily by participants with metabolic syndrome (p2 times higher in those with metabolic syndrome. Consistent with the findings when participants were grouped by glycemic status, including the TG/HDL ratio in the final model increased the inter-individual variability accounted for in predicting REE by 9–12% when participants were grouped by metabolic syndrome status (
Table 7). 4. Discussion
The major novel finding of the present study, conducted in a large cohort of adults with a wide range of age and BMI, is that TG/HDL ratio is an independent predictor of REE. Importantly, the TG/HDL ratio was significantly associated with the REE in both univariate and multivariate regression analyses. It is noteworthy that the estimation of REE in these 645 participants, who ranged in age from 18 to 81 years, showed substantial improvement when adjusting for TG/HDL ratio. Overall, 71–87% of the inter-individual variability in estimating REE was accounted for when the traditional predictors (age, sex, height, weight) were adjusted for fat-free mass and TG/HDL ratio.
An elevated TG/HDL ratio has long been associated with having an atherogenic lipid profile and, more recently, with being in a state of insulin resistance [
29,
30]. Thus, the TG/HDL ratio is a biomarker for both impaired glucose and lipid metabolism. Indeed, a high TG/HDL ratio is associated with insulin resistance in children, adolescents, and adults of various ages and BMIs [
16,
31,
32,
33,
34], and much prior evidence demonstrates that the TG/HDL ratio is equal or more accurate when compared to any other surrogate biomarker of insulin resistance. It is interesting that both the normoglycemic participants and participants who did not meet the criteria for having metabolic syndrome encompassed a range of BMIs and of hyperinsulinemia. While some studies have suggested that the TG/HDL ratio is only a biomarker for insulin resistance in Caucasian or white persons, data from larger longitudinal or population-based studies show a similar relationship in Hispanics, African Americans, and Asians, as observed with Caucasians [
35,
36,
37]. In the present study, we found no effect on the inter-individual variability in REE when including race/ethnicity in regression models.
The steeper slope of the regression line that was observed for the association between TG/HDL ratio and REE compared to the association between HOMA-IR and REE indicates not only a stronger relationship between TG/HDL ratio and REE but that an increase in the TG/HDL ratio is associated with a greater increase in REE. Supporting these findings, when participants were categorized by glycemic or metabolic syndrome status, we found that the TG/HDL ratio was a robust independent predictor of REE. Further, adding HOMA-IR to the regression models did not improve the proportion of the variance accounted for in predicting REE.
Beyond the current awareness of TG/HDL ratio as a biomarker of insulin resistance, it has become evident that an elevated TG/HDL ratio may be indicative of the lipid handling dysfunction in the liver and skeletal muscle that likely causes insulin resistance. In the normal weight individual, it is expected that metabolically healthy subcutaneous adipose tissue (SAT) will store large amounts of energy in the form of triglycerides. In the obese state, it is more likely that the dysregulation of SAT expansion and storage will occur, and lipids will begin to accumulate in other depots. Excess lipid deposits in the intraabdominal space (visceral adiposity) are part of a complex pathophysiological phenotype that includes the release of free fatty acids and the storage of triglycerides in the liver, in skeletal muscle, adjacent to and surrounding the heart, in the pancreas, and in the kidneys. This accumulation of ectopic fat disrupts organ and tissue function, promoting a state of impaired sensitivity or response to insulin action, i.e., insulin resistance. Intrahepatic triglyceride content is a robust predictor of insulin action, not only in the liver but also in skeletal muscle and adipose tissue [
38]. In a normal (non-hyperinsulinemic) state, the oxidation of VLDL-TG would contribute 10–20% to resting energy expenditure [
39]. However, a state of chronic hyperinsulinemia is associated with overproduction and reduced clearance of VLDL-triglyceride. While de novo lipogenesis typically supplies about 5% to the hepatic triglyceride pool, the investigation of non-alcoholic fatty liver disease has shown that this contribution increases to 25–40% in a state of hyperglycemia and hyperinsulinemia. Such dysregulation of lipid metabolism may be a result of diet (i.e., high saturated fat or high simple sugar dietary intake) and/or genetics [
40]. Of relevance is that these factors likely induce mitochondrial dysfunction and oxidative stress from the overproduction of reactive oxygen species [
41]. Evidence from rodent and in vitro models has shown that hepatic steatosis is a marker for this impaired metabolic milieu [
42].Another distinctive finding from the present study was that REE did not differ between persons with Class I and Class II obesity but was significantly higher in those with Class III obesity (BMI ≥ 40 kg/m2). Limited evidence has been published on REE in persons with severe obesity. The present data suggest that the impact of having a high body mass on REE becomes most influential when both body mass and insulin resistance are severely high. Baseline data from bariatric surgery patients with Class III obesity showed that those with insulin resistance had a higher REE than those who were insulin-sensitive, even when adjusted for fat-free mass [
43]. Both the HOMA-IR score and TG/HDL ratio were significantly higher in participants with Class III obesity compared to those with Class I/II obesity. In Class III obese participants, the univariate and multivariate relationship between TG/HDL ratio and REE was stronger than that between HOMA-IR score and REE, which is in line with the other findings of this study.It is interesting that we did not detect any difference in substrate oxidation or respiratory quotient among the BMI groups. While it is theorized that increased fatty acid oxidation would produce increased energy expenditure, little published evidence supports the concept that switching to greater fat oxidation increases energy expenditure. However, the flow of the substrate to storage or oxidation is controlled by insulin action. To date, there remains several mechanisms under study to explain ectopic fat, other factors, and pathways associated with reduced insulin action. One area of continued investigation and debate is the potential for altered mitochondrial activity and function in the state of insulin resistance, which may affect bioenergetics. The evidence remains conflicting, as some studies show a compensatory increase in mitochondrial oxidative capacity in insulin resistance, while others show decreased or unchanged capacity [
44,
45,
46].The limitations of the present study include that we did not assess all conceivable factors that may associate with REE, such as cardiorespiratory fitness or physical activity level. Adding time spent in moderate-to-vigorous physical activity had a small effect in estimating REE in young adults [
47]. It is also possible that the energy cost of exercise and weight-bearing activities, including movement, differs among persons with varying BMI status. Secondly, cross-sectional data do not allow for elucidating the factors involved in the dynamic nature of energy expenditure. Lastly, the measurement of body composition by more technologically advanced imaging methods, such as CT and MRI, may be superior to DXA, although DXA is more widely available and cost-effective. Moreover, our prior data showed only slight differences in measurements of whole body and regional fat between MRI and DXA, with a small potential overestimation of lean tissue by DXA [
24]. The strengths of the present study include the large sample size, the presence of a wide range of ages, BMI status, and glycemic and insulinemic statuses among participants and the use of the gold standard indirect calorimetry method for measuring REE, which was performed in the fasted state under well-controlled thermoneutral environmental conditions.
In conclusion, the results indicate that adjusting the classical covariates associated with REE (age, sex, height, weight) for fat-free mass (representing metabolically active organs and tissue) substantially increases the variance accounted for in the prediction modeling of persons who are overweight and have Class I, II or III obesity. However, there remains a significant portion of the inter-individual variability in REE that can be accounted for by including the TG/HDL ratio. Furthermore, an elevated TG/HDL ratio has proven to be a robust risk factor for impaired fasting glucose, prediabetes, type 2 diabetes, metabolic syndrome and cardiovascular disease in multiple studies. Thus, the utility of calculating the TG/HDL ratio, a parameter widely accessible in standard clinical practice, is not only to aid healthcare providers in identifying patients with lipid handling dysfunction and/or insulin resistance but to optimize the estimation of REE to better determine energy requirements and meet therapeutic goals for weight and chronic disease management.


留言 (0)