


記住我


Conceptualization, J.-Y.K. and S.-W.O.; Data curation, J.K. and J.-Y.K.; Formal analysis, J.K. and J.-Y.K.; Funding acquisition, J.-Y.K. and S.-W.O.; Investigation, J.K. and J.-Y.K.; Methodology, J.K. and J.-Y.K.; Project administration, J.-Y.K. and S.-W.O.; Supervision, J.-Y.K.; Validation, J.K. and J.-Y.K.; Visualization, J.K.; Writing—original draft, J.K.; Writing—review and editing, J.K., J.-Y.K., S.-W.O. and H.-G.K. All authors have read and agreed to the published version of the manuscript.
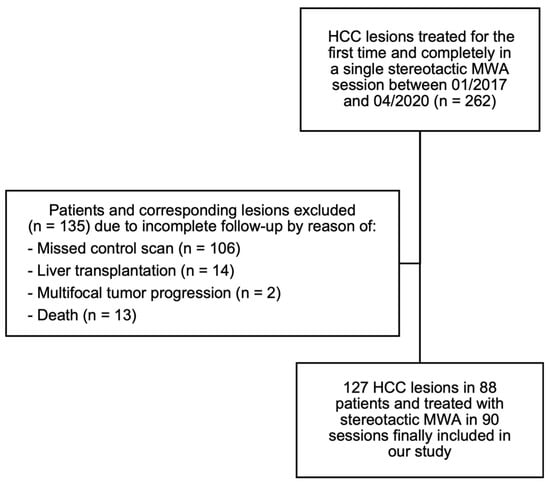
Figure 1. Flowchart of the enrollment of the study population, CT = computed tomography, CM = contrast media.
Figure 1. Flowchart of the enrollment of the study population, CT = computed tomography, CM = contrast media.
Figure 2. (a) Quantitative analysis of CT images on which two trained researchers drew five regions of interest in the thyroid gland, sternocleidomastoid muscle (SCM), internal jugular vein (IJV), common carotid artery (CCA); and (b) subcutaneous fat of the posterior neck.
Figure 2. (a) Quantitative analysis of CT images on which two trained researchers drew five regions of interest in the thyroid gland, sternocleidomastoid muscle (SCM), internal jugular vein (IJV), common carotid artery (CCA); and (b) subcutaneous fat of the posterior neck.
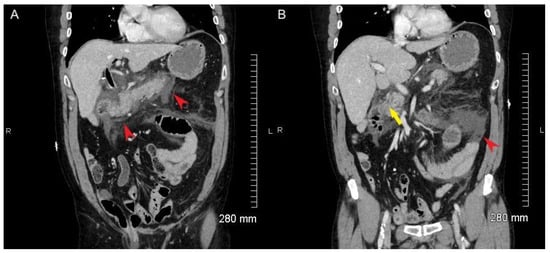
Figure 3. Computed tomography (CT) images of a 60-year-old woman obtained using low-concentration-iodine (240 mgI/mL) CM (contrast media), corresponding to Group A (a); follow-up image using high-concentration-iodine (320 mgI/mL) CM, corresponding to Group B (b). Both images have same tube voltage (100 kVp). Although there is a little streak artifact in the Group A image, both radiologists considered both images to be of good to excellent overall image quality. CT images of a 73-year-old man obtained using low-concentration-iodine (240 mgI/mL) CM and low tube voltage (90 kVp), corresponding to Group a (c); and follow-up image using high-concentration-iodine (320 mgI/mL) CM, corresponding to Group b (d). Despite the streak artifact present in the Group a image, both images were considered to exhibit good overall image quality.
Figure 3. Computed tomography (CT) images of a 60-year-old woman obtained using low-concentration-iodine (240 mgI/mL) CM (contrast media), corresponding to Group A (a); follow-up image using high-concentration-iodine (320 mgI/mL) CM, corresponding to Group B (b). Both images have same tube voltage (100 kVp). Although there is a little streak artifact in the Group A image, both radiologists considered both images to be of good to excellent overall image quality. CT images of a 73-year-old man obtained using low-concentration-iodine (240 mgI/mL) CM and low tube voltage (90 kVp), corresponding to Group a (c); and follow-up image using high-concentration-iodine (320 mgI/mL) CM, corresponding to Group b (d). Despite the streak artifact present in the Group a image, both images were considered to exhibit good overall image quality.
Figure 4. Differences in SNR and CNR between (a) Group A and B; and (b) Group a and b. * = p-value < 0.05, Student’s t-test.
Figure 4. Differences in SNR and CNR between (a) Group A and B; and (b) Group a and b. * = p-value < 0.05, Student’s t-test.
Table 1. Qualitative scales of image sharpness, noise, and overall image quality.
Table 1. Qualitative scales of image sharpness, noise, and overall image quality.
ScoreSharpnessArtifactOverall Image Quality1Blurred contourInterfering structurePoor2AverageNo interfering structureSuboptimal3Sharp contourNo artifactAcceptable4 Good5 ExcellentTable 2. Mean value of patient characteristics.
Table 2. Mean value of patient characteristics.
GroupTable 3. Results of qualitative image analysis according to parameters.
Table 3. Results of qualitative image analysis according to parameters.
GroupTable 4. Interobserver agreement for each variable.
Table 4. Interobserver agreement for each variable.
k *Sharpness0.658Noise0.586Overall image quality0.718Table 5. The mean attenuation, SNR, and CNR of quantitative analysis.
Table 5. The mean attenuation, SNR, and CNR of quantitative analysis.
Group AGroup Bp-ValueGroup aGroup bp-ValueAttenuation Fat−93.58−94.230.427−96.73−93.300.216SCM73.5976.160.028 *70.1075.470.324IJV204.01252.98<0.001 *217.53236.600.439CCA234.14312.49<0.001 *253.36297.900.185Thyroid188.67220.31<0.001 *194.49214.450.087SNR SCM6.346.210.4676.096.140.492IJV17.7420.58<0.001 *19.0719.270.788CCA20.2925.73<0.001 *22.1024.450.509Thyroid16.2817.990.008 *16.8417.520.384CNRSCM14.4213.990.25614.5313.840.592IJV25.8128.360.024 *27.5026.970.867CCA28.3733.51<0.001 *30.5432.160.616Thyroid24.3625.770.16770.1075.470.570Table 6. The CTDIvol, DLP, and effective doses of Group a and Group b.
Table 6. The CTDIvol, DLP, and effective doses of Group a and Group b.
Group aGroup bp-ValueCTDIvol (mGy)5.39 ± 1.586.14 ± 2.130.020 *DLP (mGy × cm)195.66 ± 56.59244.18 ± 90.67<0.001 *Effective dose (mSv)2.93 ± 0.853.67 ± 1.36<0.001 *Dose reduction (%)−19.9
留言 (0)