
記住我


For patients with renal tumors who were highly suspected of distant metastasis, 18F-FDG PET/CT would be performed for a systemic oncological assessment in our hospital. The electronic medical records of consecutive RCC patients who underwent 18F-FDG PET/CT examination prior to surgery from March 2014 to August 2021 were retrospectively reviewed.
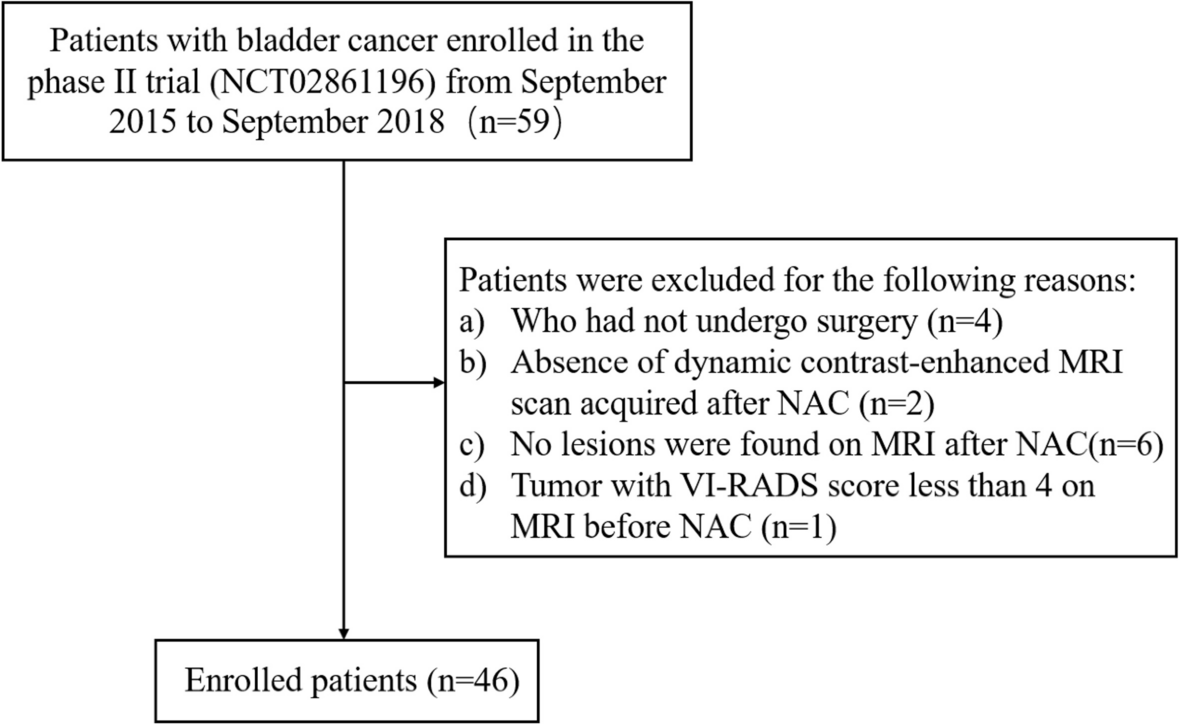
The inclusion criteria were as follows [15,16,17]: (1) newly diagnosed RCC by primary tumor pathological analyses, (2) radical nephrectomy or combined with tumor thrombectomy (for patients with VTT) performed at our hospital, and (3) 18F-FDG PET/CT performed before operation and systematic treatment initiation. The additional inclusion criterion for prognosis analysis was available follow-up data for more than 6 months after operation for the patients without disease progression. The additional exclusion criteria for prognosis analysis were as follows: (1) patients with false-negative diagnosis of presence of VTT in 18F-FDG PET/CT imaging, (2) patients with histological subtype of non-ccRCC, (3) patients with presence of other combined primary malignancy or a history of malignancy including RCC, and (4) patients with bilateral synchronous RCC. The flow diagram of the inclusion and exclusion of patients is presented in Fig. 1.
Fig. 1
The flow diagram about the inclusion and exclusion of patients
The documented clinicopathological parameters included age, gender, blood glucose, body mass index (BMI), symptoms, histological subtype, and WHO/ISUP grade. Patients with hematuria, abdominal mass, abdominal distension, abdominal/waist/back pain, nausea, fatigue, fever, weight loss, and metastasis as first symptoms (including cough, sputum with blood, bone pain, and so on) were considered symptomatic [18, 19]. The presence or absence of VTT was determined by experienced genitourinary pathologists. Based on the Mayo clinic classification system, the levels of VTT were classified into early VTT group (Mayo 0-II) and advanced group (Mayo III-IV), and confirmed by experienced senior urologists according to intraoperative findings.
Patient records were anonymized and deidentified before analysis. The retrospective data collection and analysis procedures were approved by the Ethics Committee of our hospital, waiving the need for written informed consent.
Imaging analysis of 18F-FDG PET/CTAs described in our previous studies [15], preoperative 18F-FDG PET/CT images were acquired. Two experienced senior nuclear medicine physicians, who were unaware of the patients’ information, evaluated the images independently. If they came to different viewpoints, the third blinded senior nuclear medicine physician would evaluate the image to reach a consensus.
Referring to our previous studies [15], according to the PET/CT images, with reference to contrast-enhanced CT or MRI if necessary, we measured the primary tumor SUVmax by carefully delineating a volume of interest (VOI). The VOI was carefully put on the primary lesion to encompass the tumor as much as possible with the minimum physiological activity of the renal calyces. VTT was diagnosed according to the abnormal accumulation of 18F-FDG in the renal vein or inferior vena cava, which was higher than that in the abdominal aorta at the same level. A region of interest (ROI) was outlined for measuring the SUVmax of VTT [20]. The tumor size was expressed as the maximum diameter line of the primary tumor on PET/CT. The regional lymph node and/or distant metastases were evaluated in line with the eighth edition of the American Joint Committee on Cancer (AJCC) TNM staging system [8].
Follow up and clinical endpointAs depicted previously [17], follow-up surveillance after surgery included abdomen ultrasonography or abdomen CT, chest X-ray, and laboratory data, which were regularly collected every 3 months for the first 2 years, then every 6 months until the fifth year, and annually afterward. Disease-free survival (DFS) was defined as the date from operation to recurrence and/or metastasis proven by radiology or pathology, death of any cause, or censored at the last follow-up [17]. Recurrence was defined as locoregional recurrence or progression of the initial distant metastases according to the Response Evaluation Criteria in Solid Tumor (RECIST) guideline (version 1.1) [16].
Statistical analysisThe diagnostic efficacy of 18F-FDG PET/CT for VTT and its level was expressed as sensitivity, specificity, accuracy, positive predictive value (PPV), and negative predictive value (NPV). The kappa test was employed to estimate the consistency between imaging results and pathologically or clinically confirmed results for the presence or level of VTT, respectively.
Continuous variables were shown as the mean ± SD or medians (first quartile-third quartile, Q1-Q3), and categorical variables were shown as numbers (percentages). Student’s t test was used to compare the age, BMI and primary tumor size between the advanced VTT group and early VTT group. Mann–Whitney ? test was used to compare primary tumor SUVmax and VTT SUVmax between the advanced VTT group and early VTT group, and was used to compare VTT SUVmax between different groups divided by histological subtype, WHO/ISUP grade, level of VTT and distant metastasis. Fisher’s exact test was used to compare the gender and symptoms between advanced VTT group and early VTT group. Receiver operating characteristic (ROC) curves were generated for the optimal cutoff value and area under the curve (AUC) for the continuous variables of primary tumor size and SUVmax. Spearman rank correlation test was used to confirm the linear correlation between VTT SUVmax and primary tumor SUVmax.
Univariate logistic regression analysis was carried out to identify the variables associated with early VTT and advanced VTT. The continuous variables were dichotomized into disease-free and disease-progression groups, using the cutoff values by the receiver operating characteristic (ROC) curve analysis. Univariate and multivariate Cox proportional hazard analyses were used to evaluate potential prognostic factors for DFS, and the hazard ratios (HR) and 95% confidence intervals (CI) of the predictors were acquired. Survival analysis was assessed by Kaplan-Meier curves, and the log-rank test was employed to compare the survival rates.
Statistical analyses were executed using SPSS 26.0 software (SPSS Software Inc., Chicago, IL, USA) and GraphPad Prism 8.0 software (GraphPad Software Inc., La Jolla, CA, USA). P < 0.05 were deemed statistically significant.
留言 (0)