
記住我


As widely known, type 2 diabetes mellitus (T2DM) frequently causes macrovascular and microvascular pathologic changes and, thereby, it increases the risks for the development of myocardial infarction, heart failure (HF), stroke, renal failure and reduced survival. Thus, T2DM often constitutes an important comorbidity in chronic HF (CHF). However, although almost 50 years ago, the Framingham study had already evidenced that the subjects with T2DM showed four- to eight-fold higher risk of CHF [1]; even today, it is a matter of debate whether the hyperglycemia, hyperinsulinemia and the other related metabolic disorders have a causal role in CHF or they are merely an epiphenomenon [2]. On the other hand, it is fairly intuitive that the CHF-related neurohormonal activation and proinflammatory state could trigger the glucose plasma level dysregulation and insulin resistance. In fact, as reported in a recent publication, elevated glycemic variability in acute HF admissions of patients with diabetes predicts short-term mortality. Patients with glucose coefficient of variation of more than 30.0% have an independent more than two-fold higher risk of 6-month death after an acute HF hospitalization [3]. Consequently, in acute decompensated CHF, during sympathetic over-activity, hyperglycemia should also be considered as a marker of decompensation and not only as a pathophysiological complication. Therefore, the aim of our study was to understand if the hyperglycemia and other cardiac damage biomarkers ([N terminal-pro-brain natriuretic peptide (NT-proBNP), troponin, repolarization ECG repolarization variables, etc.] could be used to stratify the 30-day mortality risk in decompensated CHF subjects. In particular, we recently observed that an increase of Tpeak–Tend interval (Te), obtained during 5-min ECG recoding, was able to stratify the short-period mortality risk in this kind of patients [4–6]. Previously, in a meta-analysis based on patients with different cardiovascular risk profiles [7] and in a large longitudinal epidemiologic study [8], an increased risk of cardiovascular mortality, sudden arrhythmic death and total mortality associated with a Te increase were reported.
Methods Patients and protocolA total of 171 consecutive patients admitted to the Geriatric department were enrolled, from February 2019 to January 2021, due to decompensated CHF. We defined patients with decompensated or compensated CHF as in European Society of Cardiology guidelines, available at that time [9].
When enrolled, all patients underwent to: clinical history, physical examination, standard ECG, transthoracic echocardiography, 5 min of II lead ECG (MiocardioEvent, Rome, Italy) recording, a venous blood sample for NT-proBNP dosage, obtained by Alere Triage Analyzer (Alere, San Diego, California, USA) and other routine serum variables, and, finally, an arterial blood sample for gas analysis. We used the Cockcroft–Gault formula to assess the creatinine clearance.
The patients provided written informed consent for the use of their records for research purpose, and the study was in accordance with good clinical practice and the principles of the Declaration of Helsinki of clinical research involving human patients. The study underwent Ethical Committee of Policlinico Umberto I approbation. Clinical trial was registered with the following ID: ClinicalTrials.gov number, NCT04127162.
Offline data analysisWe recorded 5 min of II lead ECG (Miocardio Event, Rome, Italy), and the signals were acquired, digitalized at a sampling frequency of 500 Hz, and wirelessly transmitted to a cloud platform for the data storage via mobile phone [4–6]. Subsequently, all digitized signal recordings were downloaded by the cloud platform and automatically analyzed, and checked by a single physician blinded to subjects’ circumstances. Therefore, we measured the following intervals from the respective time series in ECG recordings: RR, QT and Te; QT was obtained by measuring the interval from the onset of the Q-wave to the T-wave end; Te was obtained from T peak to end of T-wave. To identify the repolarization intervals, we used a software originally proposed by Berger et al. [10] and validated in other subsequent studies [11–13].
We, therefore, calculated mean (QT mean and Te mean), variance and SD (QTSD and TeSD) values for each of these repolarization phase intervals, and finally, we calculated the variance normalized for mean of QT (QTVN) and Te (TeVN) [4,14,15].
QTVN = QT variance/(QT mean)2
TeVI = Te variance/(Te mean)2
Software for data analysis was designed and produced by our research group with the LabView program (National Instruments, Austin, Texas, USA).
Statistical analysisAll variables with normal distribution were expressed as means ± SD, whereas nonnormally distributed variables as median and interquartile range. Categorical variables were analyzed with the χ2 test. Unpaired Student’s t-test was used to compare data for the normally distributed variables; on the contrary, Mann–Whitney test was used to compare nonnormally distributed variables (as evaluated by Kolmogorov–Smirnov test). Uni- and multivariable forward (A. Wald) Cox proportion-hazard regression analysis were used to determine the association between different repolarization continue variables (covariates) and total and cardiovascular 30-day mortality. We used the following covariates for the prognostic model: age, BMI, SBP, DBP, heart rate, left ventricular ejection fraction (LVEF), the arterial partial pressure of oxygen/fraction of inspired oxygen ratio (PaO2/FIO2 ratio), the alveolar-capillary oxygen partial pressure gradient (A-aDO2), NT-proBNP, high sensitivity cardiac Troponin T (troponin), C-reactive protein, serum potassium, calcium and fasting glucose, creatinine clearance, glycated hemoglobin (HbA1c), total cholesterol, HDL-cholesterol, LDL-cholesterol, triglycerides, QT mean, Te mean, QTSD, TeSD, QTVN and TeVN.
We used Kaplan–Maier to plot survival curve with three dichotomized variables individually or in combination: subjects with fasting glucose ≥7 mmol/l, subjects with HBA1c ≥6.5% and, finally, subjects with Te ≥ 116 ms. This last cutoff was used according to previous studies [6,8]. Kaplan–Maier survival curves were compared with log-rank test. P-values of less than or equal to 0.05 were considered statistically significant. All data were evaluated by use of the database SPSS-PC+ (SPSS-PC+ Inc, Chicago, Illinois, USA).
ResultsStarting from 170 eligible study subjects, six were not included, because the quality of ECG was suboptimal for repolarization analysis (absence or flat T-wave). Then, we conducted the study on a total of 164 acutely decompensated CHF patients (Table 1). During the 30-day follow-up, 26 patients died (overall mortality rate: 16%): 15 (9%) died for bronchopneumonia and respiratory failure, 9 (5%) for terminal HF, one (0.6%) for fatal myocardial infarction and one (0.6%) for sudden cardiac death (sustained ventricular tachycardia and ventricular fibrillation) (overall cardiovascular mortality rate: 7%).
Table 1 - General characteristics of the study subjects Patients’ characteristics All Deceased subjects Survivors P N = 164 N = 26 N = 138 Age, years 83 ± 10 87 ± 10 81 ± 9 0.011 M/F, n 90/74 13/13 77/61 0.586 BMI, kg/m2 26 ± 5 26.1 ± 6.8 26.0 ± 4.5 0.881 SBP, mmHg 123 ± 19 116 ± 16 127 ± 16 0.008 DBP, mmHg 69 ± 11 65 ± 9 70 ± 11 0.037 Left ventricular ejection fraction, % 42 ± 10 39 ± 11 43 ± 14 0.054 PaO2/FiO2 ratio, 328 ± 101 287 ± 144 336 ± 87 0.042 A-aDO2, mmHg 38 (53) 74 (208) 36 (46) 0.071 NT-proBNP, pg/ml 2250 (6589) 10 282 (15271) 1840 (5831) <0.001 C-reactive protein (mg/dl) 3.29 (8.43) 4.93 (14.3) 3.14 (7.4) 0.307 High sensitivity cardiac troponin/ (pg/l) 38 (50) 81 (101) 36 (37) 0.006 Serum potassium (mmol/l) 4.08 ± 0.59 4.16 ± 0.64 4.12 ± 0.56 0.727 Serum calcium (mmol/l) 2.15 ± 0.23 2.18 ± 0.19 2.16 ± 0.26 0.738 Creatinine clearance (ml/m) 44 (35) 32 (27) 45 (32) 0.005 Fasting glucose (mmol/l) 6.8 ± 2.4 7.9 ± 2.6 6.6 ± 2.3 0.019 HbA1c (%) 6.1 ± 1.4 6.3 ± 1.4 6.1 ± 1.4 0.497 Total cholesterol (mmol/l) 3.7 ± 1.3 3.5 ± 0.9 3.8 ± 1.0 0.365 HDL-cholesterol (mmol/l) 1.11 ± 0.37 0.98 ± 0.22 1.13 ± 0.38 0.190 LDL-cholesterol (mmol/l) 2.16 ± 1.38 1.70 ± 0.58 2.23 ± 1.44 0.255 Triglycerides (mmol/l) 1.82 ± 1.30 1.71 ± 0.89 1.83 ± 1.35 0.703 Left ventricular ejection fraction 42 ± 10 39 ± 8 43 ± 11 0.054 CHF with depressed systolic function, n (%) 101 (62) 22 (85) 79 (57) 0.008 CHF with preserved systolic function, n (%) 63 (48) 4 (15) 59 (43) 0.008 Hypertension, n (%) 129 (79) 19 (73) 110 (80) 0.449 Hypercholesterolemia, n (%) 77 (47) 13 (50) 64 (46) 0.734 Diabetes, n (%) 65 (40) 9 (35) 56 (41) 0.568 Renal insufficiency, n (%) 79 (48) 13 (50) 66 (48) 0.839 Known myocardial ischemia history, n (%) 58 (35) 11 (42) 47 (34) 0.420 Valve diseases 37 (23) 6 (23) 31 (23) 0.945 Premature supraventricular complexes, n (%) 18 (11) 3 (12) 15 (11) 0.920 Premature ventricular complexes, n (%) 33 (20) 9 (35) 24 (17) 0.044 Permanent atrial fibrillation, n (%) 51 (31) 8 (31) 43 (31) 0.969 Left bundle branch block, n (%) 35 (21) 4 (15) 31 (23) 0.419 Right bundle branch block, n (%) 28 (17) 8 (31) 20 (15) 0.043 Pacemaker-ICD, n (%) 36 (22) 4 (15) 32 (23) 0.378 β-blockers, n (%) 106 (65) 16 (62) 90 (65) 0.719 Furosemide, n (%) 124 (76) 22 (85) 102 (74) 0.244 ACE/Sartans 69 (42) 5 (19) 64 (46) 0.010 Aldosterone antagonists, n (%) 20 (12) 2 (8) 18 (13) 0.444 Potassium, n (%) 8 (5) 0 (0) 8 (6) 0.208 Nitrates, n (%) 24 (15) 3 (12) 21 (15) 0.626 Ivabradine, n (%) 5 (3) 1 (4) 4 (3) 0.797 Digoxin, n (%) 7 (4) 0 (0) 7 (5) 0.241 Statins, n (%) 49 (30) 5 (19) 44 (32) 0.196 Antiplatelet drugs, n (%) 67 (41) 9 (35) 58 (42) 0.481 Oral anticoagulants, n (%) 41 (25) 6 (23) 35 (25) 0.805 Diltiazem or verapamil, n (%) 6 (4) 0 (0) 6 (4) 0.279 Dihydropyridine calcium channel blockers, n (%) 23 (14) 3 (12) 20 (15) 0.691 Propafenone, n (%) 2 (1) 0 (0) 2 (1) 0.537 Amiodarone, n (%) 16 (10) 3 (12) 13 (9) 0.738 Ranolazina, n (%) 6 (4) 0 (0) 6 (4) 0.279 Valsartan/sacubitril, n (%) 2 (1) 0 (0) 2 (1) 0.537 Insulin, n (%) 22 (14) 4 (16) 18 (14) 0.801 Metformin, n (%) 11 (7) 0 (0) 11 (8) 0.136 Other antidiabetic drus, n (%) 3 (2) 0 (0) 3 (2) 0.448Data are expressed as mean ± SD, or median (interquartile range), or number of patients (%).
ACE, angiotensin converting enzyme; CHF, chronic heart failure.
Bold indicates statistical significance P < 0.05.
Age (P < 0.05), NT-proBNP (P < 0.001), troponin (P < 0.01) and fasting glucose (P < 0.05) were significantly higher in the deceased patients (Table 1). Moreover, SBP (P < 0.01), DBP (P < 0.05), PaO2/FIO2 ratio (P < 0.05) and creatinine clearance (P < 0.01) were significantly lower in the same group of subjects (Table 1).
Survival decompensated CHF patients reported lower levels of repolarization variability markers in comparison to the deceased subjects [QTSD (P < 0.01); QTVN (P < 0.05); TeSD (P < 0.01) and TeVN (P < 0.001)] (Table 2).
Table 2 - Short-period repolarization temporal dispersion variables in study patients ECG characteristics All Deceased subjects Survivors P N = 164 N = 26 N = 138 QT mean, ms 447 ± 76 458 ± 84 445 ± 74 0.434 QTSD, ms2 6.6 (5.4) 8.6 (3.9) 5.9 (5.2) 0.006 QTVN 0.24 (0.32) 0.33 (0.26) 0.26 (0.33) 0.015 Te mean, ms 107 ± 26 119 ± 33 104 ± 24 0.009 TeSD, ms2 7.2 (4.2) 8.7 (2.9) 6.8 (4.3) 0.009 TeVN 4.2 (5.6) 6.4 (7.3) 4.1 (7.3) 0.210Data are expressed as mean ± SD, or median (interquartile range), or number of patients (%).
QT, QT interval; QTVN, variance normalized for mean of QT; Te, Tend.
Bold indicates statistical significance P < 0.05
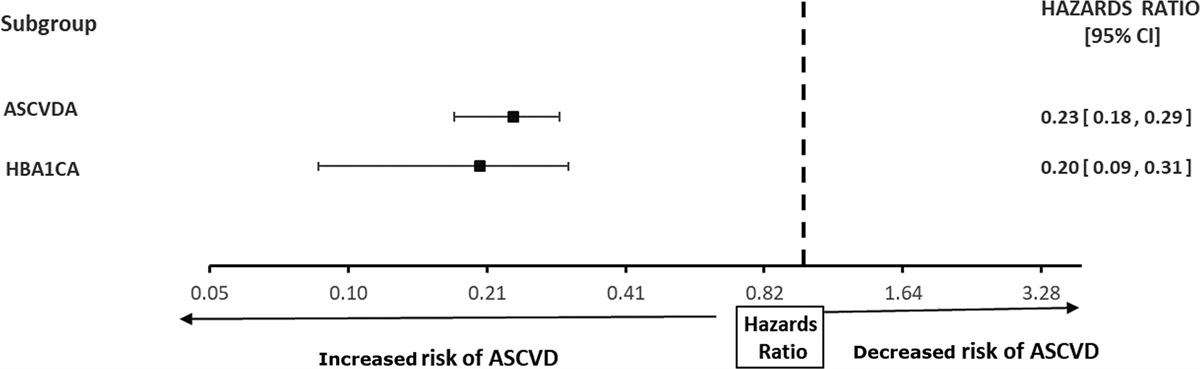
Univariable Cox regression analysis reported a significant relationship between that 30-day total mortality and age (hazard ratio, 1.07; 95% confidence interval, 1.01–1.12; P < 0.05), SBP (hazard ratio, 0.97; 95% confidence interval, 0.95–0.99; P < 0.01), DBP (hazard ratio, 0.96; 95% confidence interval, 0.92–1.00; P < 0.05), PaO2/FIO2 ratio (hazard ratio, 1.00; 95% confidence interval, 0.99–1.00; P < 0.05), A-aDO2 (hazard ratio, 1.00; 95% confidence interval, 1.00–1.00; P < 0.05), NT-proBNP (hazard ratio, 1.00; 95% confidence interval, 1.00–1.00; P < 0.01), troponin (hazard ratio, 1.00; 95% confidence interval, 1.00–1.00; P < 0.05), fasting glucose (hazard ratio, 1.58; 95% confidence interval, 1.19–2.10; P < 0.05), QTSD (hazard ratio, 1.17; 95% confidence interval, 1.01–1.36; P < 0.05), Te mean (hazard ratio, 1.03; 95% confidence interval, 1.01–1.05; P < 0.01) and TeSD (hazard ratio, 1.12; 95% confidence interval, 1.01–1.024; P < 0.05). Multivariable regression analysis confirmed a positive significant association between 30-day mortality and fasting glucose (P < 0.01), QTSD (P < 0.05) and Te mean (P < 0.01) (Fig. 1). In addition, the univariable Cox regression analysis showed the following variables significantly associated to a cardiovascular mortality: SBP (hazard ratio, 0.94; 95% confidence interval, 0.91–0.98; P < 0.01), DBP (hazard ratio, 0.92; 95% confidence interval, 0.86–0.99; P < 0.05), LVEF (hazard ratio, 0.93; 95% confidence interval, 0.88–0.98; P < 0.05), NT-proBNP (hazard ratio, 1.00; 95% confidence interval, 1.00–1.00; P < 0.01), troponin (hazard ratio, 1.00; 95% confidence interval, 1.00–1.00; P < 0.01), potassium (hazard ratio, 2.71; 95% confidence interval, 1.01–7.24; P < 0.05) fasting glucose (hazard ratio, 1.58; 95% confidence interval, 1.19–2.10; P < 0.05), QTSD (hazard ratio, 1.84; 95% confidence interval, 1.12–3.02; P < 0.05), Te mean (hazard ratio, 1.07; 95% confidence interval, 1.02–1.11; P < 0.01) and TeSD (hazard ratio, 1.16; 95% confidence interval, 1.01–1.34; P < 0.05). Multivariable regression analysis confirmed a positive significant association between 30-day mortality and fasting glucose (P < 0.05) and Te mean (P < 0.01) (Fig. 1).
 Fig. 1:
 Hazard ratio for Te mean, QTSD and fasting glucose in respect to total and cardiovascular mortality in multivariable analysis. QT, QT interval; Te, Tend.
The Kaplan–Maier survival curves indicated that the subjects with fasting glucose ≥7 mmol/l (P < 0.05) or Te ≥ 116 ms (P < 0.05) reported a significantly higher total or cardiovascular mortality in comparison to the subjects, respectively, with fasting glucose level < 7 mmol/l or Te < 116 ms (Fig. 2a and b). The double combination with Te ≥ 116 ms and fasting glucose ≥ 7 mmol/l (P < 0.01) or Te ≥ 116 ms and HBA1c ≥ 6.5% (P < 0.05) individuated subjects with higher risk for total or cardiovascular mortality (Fig. 3a and b).
 Fig. 2:
 (a) Kaplan–Meier survival curve for total mortality by grouping the patients for fasting glucose ≥7 mmol/l, HBA1c ≥ 6.5% and Te mean ≥ 116 ms. (b) Kaplan–Meier survival curve for cardiovascular mortality by grouping the patients for fasting glucose ≥ 7 mmol/l, HBA1c ≥ 6.5% and Te mean ≥ 116 ms. Te, Tend.
 Fig. 3:
 (a) Kaplan–Meier survival curve for total mortality by grouping the patients with the combination of Te ≥ 116 ms and fasting glucose ≥ 7 mmol/l. (b) Kaplan–Meier survival curve for cardiovascular mortality by grouping the patients with the combination of Te ≥ 116 ms and fasting glucose ≥ 7 mmol/l. Te, Tend.
DiscussionIn the present study, we observed an increase of 30-day mortality risk in decompensated CHF patients with higher fasting glucose plasma levels and prolonged Te duration. In particular, the association of these two variables resulted in the best predicative factors capable to identify these critical patients with higher risk of total and cardiovascular mortality. In fact, although age, creatinine clearance, blood pressure and NT-proBNP (Table 1) were significantly different in 30-day deceased CHF subjects, these variables were not able to indicate an increase of total or cardiovascular mortality risk in multivariable regression analysis. For these reasons, we believe that elevated fasting glucose level and an increase of Te mean could be also considered a simple noninvasive marker of short-period mortality in acutely decompensated patients. In previous studies, both fasting glucose [16] and Te mean [4–6] were significantly associated with short-period mortality in this kind of CHF subjects; the novelty of the present study was the evidence that these two studied variables mutually increased their predictive power. Whereas we do not know if these two variables are merely mortality risk markers or if they even have a causal role, however, the link between these two variables should be sought in the combination of frequent diabetes complications and pathophysiological CHF derangement. In fact, it is possible to hypothesize that the abnormal Te duration could be caused by a combination of myocardial diabetic [17] and CHF pathophysiologic alterations (autonomic nervous system imbalance). In particular, as a consequence of T2DM, micro- and macroangiopathies, autonomic neuropathy, myocardial hypertrophy and fibrosis are observable, and on the other hand, the typical CHF induced dysregulation as the neurohormonal activation and proinflammatory state [18]. Finally, elevated glucose blood levels could be considered a dynamic marker of the sympathetic hyperactivity [18] and higher levels of sympathetic activity are associated with a higher mortality risk [19].
However, it is well known that diabetes induces an increase of cardiomyocyte action potential duration and QT interval in surface ECG [20,21]. In particular, about 20 years ago, in National Heart and Nutritional Examination Survey III, it was reported an increase of subjects with acquired long QT in T2DM patients [22] and, subsequently, it was published that, in NANES III study, the cardiovascular and total mortality rate were higher in acquired long QT than in normal subjects [22]. Finally, it was reported that in T1DM and T2DM the channels mediating sodium, potassium and calcium currents were altered [23]. All these diabetes-related changes and myocardial CHF substrate contributed together to prolong and disperse the repolarization and its short-period markers (Table 2).
Although the electrophysiologic basis of Te remains controversial [24], some authors believe that the Te is a noninvasive marker of transmural repolarization dispersion [25]. In particular, the II ECG lead recordings, the same used in our study, could represent a marker of apicobasal and interventricular repolarization myocardial dispersion rather than transmural [24]. However, whatever the genesis of this parameter could be, Te remains a powerful predictive marker of total and cardiovascular mortality [4–8] and not a mere marker of sudden cardiac death.
Another important element to consider is that HbA1c was not significantly different between the studied groups, giving to the acute fasting glucose imbalance a stronger significance, suggesting that the modifications that occur in acutely decompensated patients are more important as mortality predictors than the T2DM itself.
Therefore, the 5-min single-lead ECG recording, evaluating the markers of left ventricular repolarization, which results altered in diabetic population, added an extra independent prediction to the outcome of this category of patients suffering from HF. This element is of particular interest considering that the evaluation of these ECG parameters can take place remotely and can be consulted by any operator connected with a simple device (e.g. smartphone), providing the proofs of the clinical severity and the possibility to remotely correct the therapy.
In conclusion, our data seem to indicate that two simple, routine, noninvasive, inexpensive, easily repeatable parameters, as fasting glucose and Te mean, are able to improve the stratification for death risk in acute decompensate CHF patients.
LimitationsAn actual limitation of the study is the absence of patients treated with SGLT2 inhibitors. The sample was, in fact, studied before the recent indications provided by the European Society of Cardiology guidelines on the use in class I evidence A of these drugs in subjects with HF and diabetes [26]. Further enrollment will help fill this gap. Moreover, an interventional study could definitively assess the power and utility of these evidences.
AcknowledgementsPart of the same database analyzed in this paper has been already studied in two previous published papers, from different point of view [5,6].
ClinicalTrials.gov number, NCT04127162.
Conflicts of interestThere are no conflicts of interest.
References 1. Kannel WB, Hjortland M, Castelli WP. Role of diabetes in congestive heart failure: the Framingham study. Am J Cardiol 1974;34:29–34. 2. Nielsen R, Nørrelund H, Kampmann U, Bøtker HE, Møller N, Wiggers H. Effect of acute hyperglycemia on left ventricular contractile function in diabetic patients with and without heart failure: two randomized cross-over studies. PLoS One 2013; 8:e53247. 3. Cunha FM, Cidade-Rodrigues C, Elias C, Oliveira D, Bettencourt P, Lourenço P. Glucose variability predicts 6-month mortality in patients hospitalized with acute heart failure. Intern Emerg Med 2021; 16:2121–2128. 4. Piccirillo G, Moscucci F, Bertani G, Lospinuso I, Sabatino T, Zaccagnini G, et al. Short-period temporal repolarization dispersion in subjects with atrial fibrillation and decompensated heart failure. Pacing Clin Electrophysiol 2021; 44:327–333. 5. Piccirillo G, Moscucci F, Mariani MV, Di Iorio C, Fabietti M, Mastropietri F, et al. Hospital mortality in decompensated heart failure. A pilot study. J Electrocardiol 2020; 61:147–152. 6. Piccirillo G, Moscucci F, Bertani G, Lospinuso I, Mastropietri F, Fabietti M, et al. Short-period temporal dispersion repolarization markers predict 30-days mortality in decompensated heart failure. J Clin Med 2020; 9:E1879. 7. Tse G, Gong M, Wong WT, Georgopoulos S, Letsas KP, Vassiliou VS, et al. The T peak - T end interval as an electrocardiographic risk marker of arrhythmic and mortality outcomes: a systematic review and meta-analysis. Heart Rhythm 2017; 14:1131–1137. 8. Bachmann TN, Skov MW, Rasmussen PV, Graff C, Pietersen A, Lind B, et al. Electrocardiographic Tpeak-Tend interval and risk of cardiovascular morbidity and mortality: results from the Copenhagen ECG study. Heart Rhythm 2016;13:915–924. 9. Ponikowski P, Voors AA, Anker SD, Bueno H, Cleland JGF, Coats AJS, et al. ESC guidelines for the diagnosis and treatment of acute and chronic heart failure: the task force for the diagnosis and treatment of acute and chronic heart failure of the European Society of Cardiology (ESC). Developed with the special contribution of the Heart Failure Association (HFA) of the ESC. Eur J Heart Fail 2016; 18:891–975. 10. Berger RD, Kasper EK, Baughman KL, Marban E, Calkins H, Tomaselli GF. Beat-to-beat QT interval variability: novel evidence for repolarization lability in ischemic and nonischemic dilated cardiomyopathy. Circulation 1997; 96:1557–1565. 11. Piccirillo G, Moscucci F, Pascucci M, Pappadà MA, D’Alessandro G, Rossi P, et al. Influence of aging and chronic heart failure on temporal dispersion of myocardial repolarization. Clin Interv Aging 2013; 8:293–300. 12. Piccirillo G, Moscucci F, Fabietti M, Parrotta I, Mastropietri F, Di Iorio C, et al. Arrhythmic risk in elderly patients candidates to transcatheter aortic valve replacement: predictive role of repolarization temporal dispersion. Front Physiol 2019; 10:991. 13. Piccirillo G, Moscucci F, Pofi R, D’Alessandro G, Minnetti M, Isidori AM, et al. Changes in left ventricular repolarization after short-term testosterone replacement therapy in hypogonadal males. J Endocrinol Invest 2019; 42:1051–1065. 14. Baumert M, Porta A, Vos MA, Malik M, Couderc JP, Laguna P, et al. QT interval variability in body surface ECG: measurement, physiological basis, and clinical value: position statement and consensus guidance endorsed by the European Heart Rhythm Association jointly with the ESC Working Group on Cardiac Cellular Electrophysiology. Europace 2016; 18:925–944.
留言 (0)