
記住我

A total of 240 patients with ARDS were enrolled in this study; 105 patients were considered to belong to the COVID-19 ARDS cohort and 135 patients to the bacterial pneumonia ARDS cohort. The study flow chart is shown in Fig. 1 (A, B). We followed up the survival rates of all patients within 28 days after a diagnosis of ARDS. No patients were lost to follow-up.
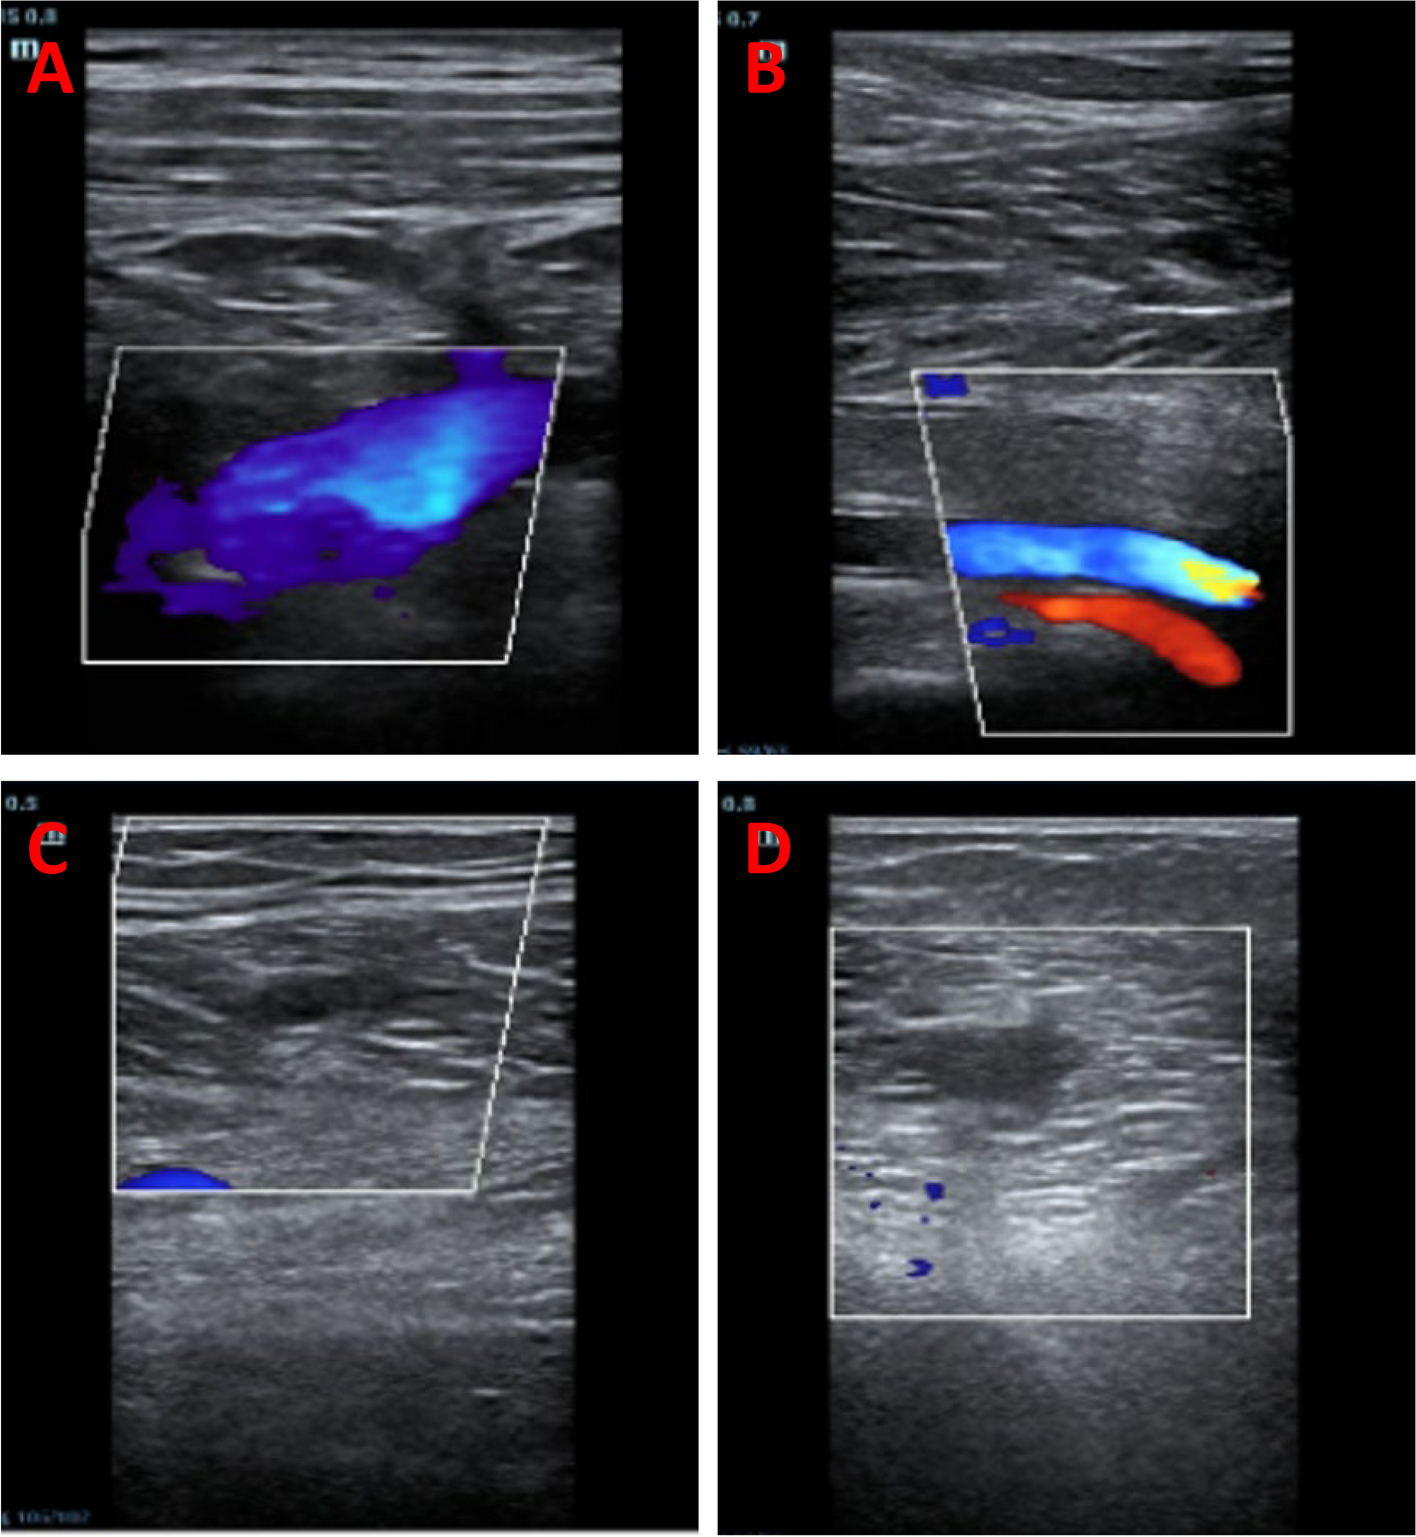
Ultrasound scan for screening for DVTLower extremity venous compression ultrasound scanning was performed for 240 patients regardless of clinical symptoms of the lower limbs (Fig. 1B). The median number of ultrasound scans was 1 (range, 1–5). Eighty (80/240) developed DVT was found and the other 160 was a negative result at the first ultrasound scan. Subsequently, 75 patients underwent more than one ultrasound scan; among those, 36 developed DVT and 39 had no DVT with 2 (range, 2–5) ultrasound examinations. The interval from the diagnosis of ARDS to the occurrence of DVT for the 36 patients who developed DVT was 8 (3, 14) days; the interval from the diagnosis of ARDS to the last ultrasound examination for the 39 cases with no DVT was 10 (5, 16) days. There was no difference between the two groups (P = 0.344).
Finally, of the 240 patients, 116 (48.3%) developed DVT, including 22 with proximal DVT and 94 with distal DVT, 77 of whom had muscular calf vein thrombosis only. The incidence of asymptomatic DVT was 94 (39.2%), including 15 (6.3%) proximal DVT and 79 (32.9%) distal DVT, of whom muscular calf vein thrombosis accounted for 67 (27.9%). For all the 240 patients, the interval from the diagnosis of ARDS to the occurrence of DVT in the DVT group was 7 (4, 12) days, and the interval from the diagnosis of ARDS to the last ultrasound examination in the non-DVT group was 8 (3, 14) days. There was no difference between the two groups (P = 0.725). In addition, six patients were clinically suspected of having PE; 4 were further confirmed by computed tomography pulmonary angiography (CTPA) examination (Table 1 and Supplementary-Table 1).
Table 1 Demographic and clinical characteristics of patients with ARDS caused by COVID-19 and bacterial pneumoniaDemographic and clinical characteristics of patients in COVID-19 and bacterial pneumonia ARDS cohortsOf the 240 patients with ARDS, 105 were infected with COVID-19 (age [63.6 ± 13.1] years, male 60 [57.1%]) and 135 with bacterial pneumonia (age [64.8 ± 15.1] years, male 101 [74.8%]). Compared with patients with bacterial pneumonia, the rate of underlying diseases (smoke, chronic respiratory disease, cerebral vascular disease, and chronic kidney disease), APACHE II scores, and SOFA scores (all P < 0.05) were all lower in patients with COVID-19. There was no difference in PaO2/FiO2 ratios between two groups (P = 0.858). More patients with COVID-19 received therapy of glucocorticoids (47.6% [50/105] vs 29.6% [40/135], P = 0.004), immunoglobulin (50.5% [53/105] vs 2.2% [3/135], P < 0.001), vasoactive drugs (35.2% [37/105] vs 20.0% [27/135], P = 0.008) and VTE prophylaxis (69.5% [73/105] vs 47.4% [64/135], P = 0.001). Of the 105 patients with COVID-19, 73 (69.5%) were given VTE prophylaxis; among whom, 62 (59.0%) received low molecular weight heparin, 11 (10.5%) only received physical prevention, no patient received anticoagulant instead of LMWH, and 40 (38.1%) received combined treatment with LMWH and physical prevention. Of the 135 patients with bacterial pneumonia, 64 (47.4%) were given VTE prophylaxis; among those, 55 (40.7%) received LMWH, 8 (5.9%) only received physical prevention, 1 (0.7%) received rivaroxaban as anticoagulation drug, and 40 (29.6%) received combined treatment with LMWH and physical prevention. There was significantly higher incidence of DVT (57.1% vs 41.5%; P = 0.016) and proximal DVT (15.2% vs 4.4%; P = 0.004) in patients with COVID-19 than in those with bacterial pneumonia (Table 1).
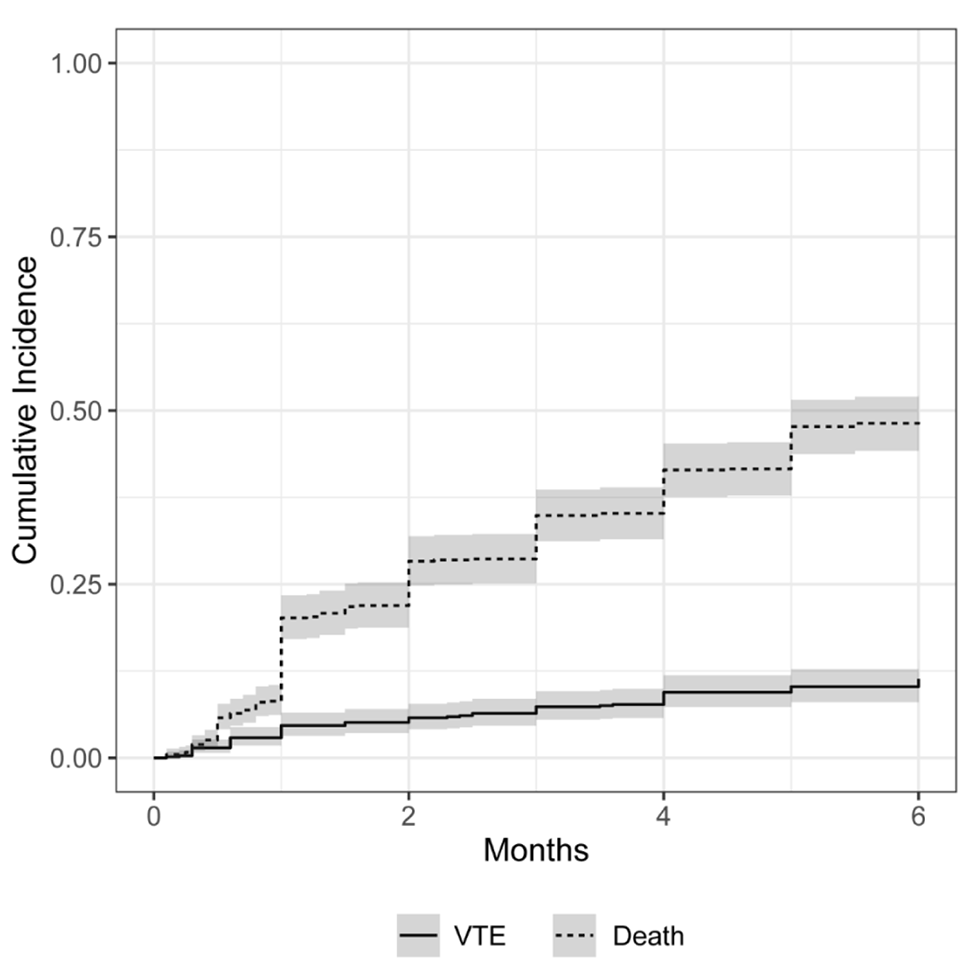
Next, based on univariate test results and prior knowledge, death was used as a competitive risk. Fine-Gray model showed that the 28-day cumulative incidence rate (95% CI) of DVT in patients with ARDS caused by COVID-19 and by bacterial pneumonia was 85.3% (66.6, 92.3%) and 62.7% (48.1, 72.0%) respectively. There was no significant difference between the two groups (P = 0.220) (Fig. 2).
Fig. 2
The 28-day cumulative incidence curves of DVT and 28-day cumulative death curves in COVID-19 and bacterial pneumonia ARDS cohorts. Based on univariate test results and prior knowledge, death was used as the competitive risk. The Fine-Gray test showed no significant difference in the 28-day cumulative incidence of DVT between the COVID-19 ARDS and bacterial pneumonia ARDS group (P = 0.220). Abbreviations: ARDS, acute respiratory distress syndrome; COVID-19, coronavirus disease 2019; DVT, deep vein thrombosis
Demographic and clinical characteristics of DVT vs non-DVT patients in overall ARDS cohortAmong 240 patients with ARDS (Supplementary Table 1), patients with DVT were older, and had longer bedridden time, higher Padua prediction scores, higher SOFA scores, lower serum creatinine levels, higher lactate dehydrogenase (LDH) levels, higher D-dimer levels, longer prothrombin time (PT), and lower PaO2/FiO2 ratios compared to patients without DVT (all P < 0.05). Also, more patients with DVT received therapy of glucocorticoids, immunoglobulin, vasoactive drugs, sedatives and invasive mechanical ventilation (IMV) (all P < 0.05). Moreover, patients with DVT had a significantly higher 28-day mortality (42.2% [49/116] vs 19.4% [24/124], respectively; P < 0.001) (Supplementary Table 1).
Demographic and clinical characteristics of DVT vs non-DVT patients in COVID-19 and bacterial pneumonia ARDS cohortsAmong 105 COVID-19 patients with ARDS, patients with DVT were older, had longer bedridden time, higher Well scores, higher SOFA scores, higher WBC counts, higher neutrophil counts, higher neutrophil-to-lymphocyte ratios, higher serum procalcitonin (PCT) levels, higher AST levels, higher alanine aminotransferase (ALT) levels, higher TBIL levels, higher DBIL levels, higher LDH levels, higher BUN levels, higher creatine kinase isoenzyme (CK)-MB levels, higher D-dimer levels, longer PT, and lower PaO2/FiO2 ratios compared to patients without DVT (all P < 0.05). Also, more patients with DVT received central venous catheterization (CVC), therapy of vasoactive drugs, sedatives, and IMV (all P < 0.05). There was no significant difference in serum creatinine levels and proportion of VTE prophylaxis between DVT and non-DVT groups (all P > 0.05). Patients with DVT had a significantly higher 28-day mortality (33.3% [20/60] vs 15.6% [7/45], respectively; P = 0.039) (Supplementary Table 2).
Among 135 patients with ARDS caused by bacterial pneumonia, patients with DVT had higher serum PCT levels and lower PaO2/FiO2 ratios, and more patients with DVT had the underlying chronic respiratory disease and received sedative therapy and IMV compared with patients without DVT (all P < 0.05). Also, there were significantly higher serum creatinine levels in patients without DVT (P = 0.015). Patients with DVT also had a significantly higher 28-day mortality (51.8% [29/56] vs 21.5% [17/79], respectively; P < 0.001) (Supplementary Table 3).
Independent risk factors associated with DVT in patients with ARDS caused by COVID-19 and bacterial pneumoniaBased on univariate test results and prior knowledge, death was used as a competitive risk. The Fine-Gray competitive risk model was used to explore the risk factors of DVT under COVID-19 and bacterial pneumonia subgroups (Table 2). Of the 105 ARDS patients with COVID-19, the independent contributors to DVT were higher CK-MB levels (HR, 1.014, 95% CI: 1.005–1.024; P = 0.003), lower PaO2/FiO2 ratios (HR, 0.997, 95% CI: 0.993–1.000; P = 0.081), and D-dimer levels ≥0.5 μg/mL (HR, 2.655, 95% CI: 0.945–7.456; P = 0.064), whereas in the bacterial pneumonia ARDS group, DVT was independently associated with IMV (HR, 3.029, 95% CI: 1.541–5.593; P = 0.001) and VTE prophylaxis (HR, 0.467, 95% CI: 0.267–0.816; P = 0.007). Increased CK-MB levels were only independently associated with increased incidence of DVT for patients with COVID-19 (test for interaction, P = 0.016; Fig. 3 and Table 2), whereas VTE prophylaxis was only independently associated with lower incidence of DVT for patients with bacterial pneumonia (test for interaction, P = 0.022; Table 2). In addition, IMV was independently associated with increased incidence of DVT for bacterial pneumonia ARDS patients instead of COVID-19 ARDS patients; nevertheless, the interaction analysis showed no significant difference between these two groups (test for interaction, P = 0.372; Table 2). There was no association between serum creatinine levels and incidence of DVT in both COVID-19 ARDS group and bacterial pneumonia ARDS group, the interaction analysis displayed no significant difference between two groups (test for interaction, P = 0.363; Supplementary Fig. 1).
Table 2 Risk factors of DVT in patients with ARDS caused by COVID-19 and bacterial pneumoniaFig. 3
Probability of DVT increased with CK-MB levels only in the COVID-19 ARDS group. The occurrence of DVT in the COVID-19 ARDS group (green line) increased with the rising of CK-MB levels, whereas there was no association between DVT and CK-MB levels in the bacterial pneumonia ARDS group (red line; test for interaction, P = 0.016). Data are adjusted for age, serum creatinine levels, serum PCT levels, D-dimer levels, PaO2/FiO2 ratios, and IMV. Abbreviations: ARDS, acute respiratory distress syndrome; CK, creatine kinase isoenzyme; COVID-19, coronavirus disease 2019; DVT, deep vein thrombosis; FiO2, a fraction of inspired oxygen; IMV, invasive mechanical ventilation; PaO2, partial pressure of arterial oxygen; PCT, procalcitonin
Comparison of diagnostic accuracy for assessing the risk of DVT of different ROCs in ARDS cohort caused by COVID-19We selected the risk factors based on the test results of the Fine-Gray model and proposed three new ways of combining forecasting models for assessing the risk of DVT in patients with ARDS caused by COVID-19 who were split by generating random numbers to produce a training data set (n*0.7) and a validation data set (n*0.3). The CK-MB level showed satisfactory predicting ability for DVT (AUC = 0.639; 95% CI: 0.428–0.850; sensitivity: 70.6%; specificity: 73.3%); yet, there was no significant difference between CK-MB level and the DVT Wells score (AUC = 0.537; P = 0.587 for these two curves) and the Padua prediction score (AUC = 0.717; P = 0.515 for these two curves; Supplementary Fig. 2) when predicting DVT. Similar results were obtained for the CO model, including CK-MB and PaO2/FiO2 ratio, which showed satisfactory predicting ability for DVT (AUC = 0.702; 95% CI: 0.516–0.887; sensitivity: 58.8%; specificity: 73.3%); however, there was no significant difference between the CO model and the DVT Wells score (P = 0.242 for these two curves) and the Padua prediction score (P = 0.888 for these two curves; Supplementary Fig. 2). However, the COD model, including CK-MB, PaO2/FiO2 ratio, and D-dimer level, showed satisfactory predicting ability for DVT (AUC = 0.803; 95% CI: 0.641–0.961; sensitivity: 66.7%; specificity: 82.4%) and better performance in predicting DVT compared to the Wells score (P = 0.020 for these two curves), but not compared to the Padua prediction score (P = 0.363 for these two curves; Fig. 4).
Fig. 4
Comparison of diagnostic accuracy for screening for DVT of different ROCs in ARDS cohort caused by COVID-19. We selected the risk factors based on the test results of the Fine-Gray model and proposed a combining prediction model for assessing the risk of DVT in patients with ARDS caused by COVID-19. Patients were split by generating random numbers to produce a training data set (n*0.7) and a validation data set (n*0.3) in the ARDS cohort caused by COVID-19. The COD model including CK-MB, PaO2/FiO2 ratio, and D-dimer level shows satisfactory predicting ability for DVT (AUC = 0.803; 95% CI: 0.641–0.961; sensitivity: 66.7%; specificity: 82.4%) and was significantly higher than that of the DVT Wells score (P = 0.020 for these two curves); there was no significant difference compared with the Padua prediction score (P = 0.363 for these two curves). Abbreviations: COD = CK-MB + PaO2/FiO2 ratio + D-dimer level; ARDS, acute respiratory distress syndrome; AUC, area under the curve; CI, confidence interval; CK, creatine kinase isoenzyme; DVT, deep vein thrombosis; FiO2, a fraction of inspired oxygen; PaO2, partial pressure of arterial oxygen; ROC, receiver operating characteristic
Nomogram for assessing the risk of DVTIn order to increase the practicability of the prediction model, we created a nomogram based on the selected predictors (Supplementary Fig. 3). There are three prediction variables. The corresponding points were obtained by making a vertical line upward based on the value of each variable. The total points were obtained by adding the points of the three variables. The probability DVT in 5 days, 7 days, and 14 days was obtained by making a vertical line downward based on the total points. The calibration plots showed good consistency of 5-, 7-, and 14 days DVT between the actual observation and the nomogram prediction (Supplementary Fig. 4).
留言 (0)