
記住我
The kidney is the main organ responsible for urine formation and excretion of drugs from the body. The kidneys develop between the 5th and 12th week of fetal life and increase significantly during the second half of pregnancy, owing to intense nephrogenesis (nephron formation) and a significant increase in the number of nephrons (1). Previous meta-analysis showed that the average weight of both kidneys increased from 0.22 g at 12 GA (gestational age in weeks) to 15.9, and 27.3 g at 32, and 40 GA, respectively (2). By the 13th week, the kidneys start to produce urine, due largely to the increase in the number of nephrons, which is a direct indicator of the functional capacity of the kidney. Nnephrogenesis commences at around 8 weeks GA. By 20 weeks, about 30% of adult number of nephrons have been formed and by birth in a term born infant, nephrogenesis is complete. This indicates that ~60% of nephrons are formed in the second half of gestation (3, 4). The number of nephrons in the normal human kidney varies from ~250,000 to over two million (5).
Postnatal renal function can be quantified by many different methods. However, limited options are available for assessing fetal renal function. The options available include amniotic fluid volume, ultrasonographic appearance of kidneys, urine production and the biochemical composition of fetal urine (6). Although the details of fetal kidney physiology are well-described, the clinical evaluation of fetal glomerular filtration rate (GFR) remains a challenging exercise. GFR either directly measured based on the clearance of exogenous filtration markers such as inulin; or estimated from the clearance of endogenous filtration markers-creatinine and cystatin C is regarded as the mainstay in clinical practice for assessing postnatal renal function (7), albeit with a number of identified limitations for each of the methods (8, 9).
Due to clinical and ethical constraints, few studies have reported GFR values, either from pre-clinical species (10–12) or from infants after birth, which are based on inulin clearance (13, 14) or creatinine clearance (15, 16), and are used in lieu of human fetal GFR at different gestational ages. It is known however, that the transition from fetal to new-born life is accompanied by multifactorial hemodynamic and functional changes. Fetal kidneys receive about 5% of fetal cardiac output (17). Postnatal kidneys on the other hand, received about 16% of cardiac output in a 2-days old new-born infant born at 35.4 GAs (18). Therefore, postnatal estimation of new-born GFR is likely to differ from the fetal GFR at term. Since these physiological parameters are gestational-age dependent, the neonatal GFR immediately at birth will also be gestational age dependent (9).
Measuring fetal GFR has its place in pharmacokinetics (PK) for predicting the fetal renal clearance of xenobiotics and their level in the amniotic fluid. Determination of fetal GFR requires quantifications of its variables, including urine flow, and concentration of the markers in the fetus, and in the fetal urine at different gestational weeks. Since inulin cannot be injected to the fetus for measuring GFR, the use of endogenous creatinine or Cystatin C is an alternative method.
The first direct measurement of fetal urinary production/flow rate was demonstrated by Campbell et al. (19). The measurement was based on volume estimations of the bladder, using static measurements of its longitudinal and transverse sections and regular observations of its emptying and filling, using 2-dimentional (2D) ultrasound (19). Since then, advancements in real time ultrasound measurements, including the use of 3D ultrasound with integrated “Virtual Organ Computer-aided AnaLysis” (VOCAL) software have resulted in more accurate visualizations of the filling and emptying cycles of the fetal bladder (20). The hourly fetal urine production rate (FUPR) can then be estimated, either by regression analysis of the acquired bladder volumes at different time points within the filling phase, or by the difference between the maximum and minimum bladder volumes divided by the time interval.
The aim of this paper was to assess the fetal GFR via undertaking a thorough analysis of the published literature on FUPR and fetal creatinine concentration in the fetal serum (SerCr), urine (UrCr), and in the amniotic fluid during fetal development.
Methods Literature SearchSearches for published literature articles relating to fetal urinary flow rate were carried out using PubMed (https://pubmed.ncbi.nlm.nih.gov/) and Google Scholar (https://scholar.google.com/) in April 2021. The key words utilized in the searches include “fetal urine/urinary production”, “fetal urine/urinary flow”, “fetal glomerular filtration” and “fetal GFR”. An additional search was carried out to identify published articles with measured values of creatinine in the fetal urine, serum and amniotic compartments at different gestational ages using for example the following search terms for creatinine- “amniotic fluid constituents”, “amniotic fluid creatinine”, “fetal amniotic creatinine”, “fetal urine creatinine”, “fetal urine biochemistry”, and “fetal urinary creatinine”. References within the individual search results were also reviewed to identify any additional articles that may have been missed in the initial searches.
Studies from both searches whose data were retained for the analysis were those that met the following criteria- (1) the subjects were healthy females with no known pregnancy-related complications, (2) the pregnancy was described as normal, and were not characterized by any known fetal abnormalities, including kidney abnormalities (3) only singleton pregnancies and (4) an explicit mention of gestational age at which fetal urine production rate or creatinine concentration was measured. Control data from subjects meeting the above-mentioned criteria for studies that were conducted specifically to look at complicated pregnancies were also included. One of the initial selection criteria was to only include studies carried out in a Caucasian population. However, due to the paucity of published data where only Caucasian population were considered, as well as evidence from the data suggesting there are no significant ethnic differences (Table 1), this was removed from the inclusion criteria.
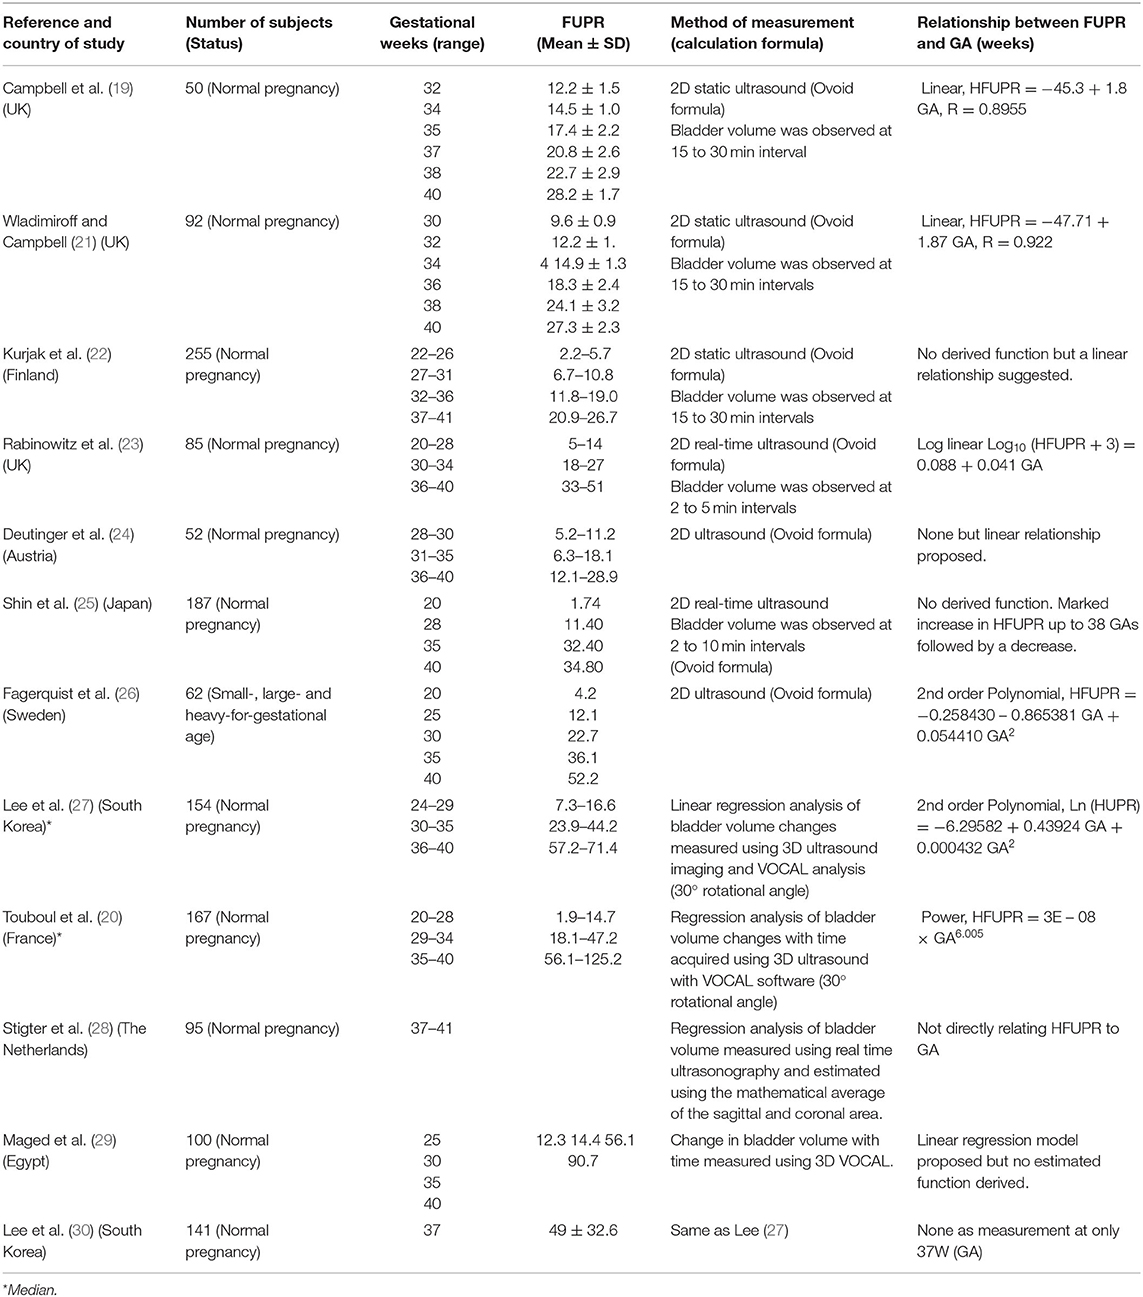
Table 1. Summary of studies with measured values of fetal urine flow rates (ml/h) at different gestational ages in normal pregnancy.
Data AnalysisFrom each individual study, the mean and standard deviation (SD) for both the fetal urinary production rate and the concentration of creatinine in the amniotic fluid, urine and fetal serum at the different gestational ages in weeks (GA) were calculated. The fetal age in weeks (FA) was calculated from the GA (FA= GA-2). The weighted mean (μ) from the different studies was then calculated using Equation 1:
μ= ∑j=1Nnj.xj∑j=1Nnj (1)where nj is the number of observations in the jth study, xj is the mean value from the jth study and N is the total number of studies for the current fetal age.
The weighted standard deviation (σ*) was calculated using Equation 2:
σ*=∑j=1Nnj(xj2+σj2)-μ2∑j=1Nnj∑j=1Nnj (2)Where nj is the number of observations in the jth study; N is the number of studies for the current fetal age; xj and σj are the mean and standard deviation of the FUPR respectively in the jth study, and μ is the weighted average across all N studies for the current fetal age (as given by Equation 1).
To quantify the fit to data of the regression analyses, a weighted mean squared error (MSE) was used, given by Equation 3:
MSE=1W.∑i=1Wni∑i=1Wni(yi-ui)2 (3)Where W is the total number of sampling times for the different fetal ages; ni is the total number of observations across all studies in the ith week; yi is the model predicted FUPR in the ith week, and μi is the weighted mean of the FUPR of all subjects in the ith week across all studies.
To identify which function best fits the data, weighted regression analyses was carried out for different growth functions including, linear, exponential, polynomial, and power law. Each function's parameters were optimized using the Microsoft built-in Excel's LINEST function. The weighted mean squared error and coefficient of determination (R2) value was then calculated for each of the three functions.
Calculation of Fetal GFRThe fetal creatinine based GFR was calculated according to Equation 4:
Fetal GFR (mL/min)=FUPR (mL/min) *Fetal UrCr (mg/L)Fetal SerCr (mg/L) (4)To account for interindividual variability, a sample of 800 fetuses was generated and data at six gestational ages (15, 20, 25, 30, 35, and 40 weeks) were summarized for the changes in the parameter values using constant coefficient of variations (CV), based on the observed data, of 30% for FUPR, 25% for UrCr, and 25% for SerCr. Due to the absence of fetal GFR measurements, data from preterm and term neonates observed immediately after birth were compared against the predicted fetal GFR using Equation 4.
ResultsThirteen different original research articles, which altogether provided over 1,300 measured values of FUPR from pregnant women across different gestational ages and met the pre-defined criteria, were identified in the literature (Table 1). The FUPR was highly variable in the collated data even for the same gestational age due to the measurement technique used. Seven of these studies, carried out between 1973 and 2001 used 2D ultrasonographic techniques, either with static or real-time measurements, with a total of 845 measurements. The other five studies conducted between 2007 and 2014 utilized 3D ultrasound with integrated VOCAL software with a total of 517 measurements.
The FUPR from these studies ranged from a minimum reported value of 0.5 ml/hr at 19 weeks GA (25), to 118.5 ml/hr at 40 weeks GA by Rabinowitz et al. (23), for the 2D ultrasound measurements; and from a minimum reported value of 3.25 ml/hr at 23 weeks GA to 125.2 ml/hr at 40 weeks GA (20), measured using the 3D VOCAL system. For most of the studies, the measured FUPR increased with gestational age, with further derivation of either a linear, exponential, or power function in some of the studies to describe the relationship between FUPR and GA (Table 1). The only exception was the study carried out by Shin et al., in which the FUPR seemed to decrease after 38 weeks GA (25).
A plot of the measured FUPR in ml/min against GA (weeks) from the different studies is shown in Figure 1, separated into data gathered using 2D (plot A) and those that used 3D (plot B) ultrasonic techniques. These plots show that the 2D technique yields estimates of urine production rates that are significantly less than measurements done using 3D ultrasound. To confirm this observation, the data was subset to isolate the mean production rates from 35 gestational weeks to term for both the 2D and 3D measurements. A two-tail, two-sample t-test assuming unequal variances, with alpha = 0.05, was carried out. Data from the 44 data points using 2D measurements (Mean = 0.48, SD = 0.21) and the 20 data points using 3D measurements (Mean = 1.18, SD = 0.30) from 35 to 40 GAs were significantly different (p < 0.0001).
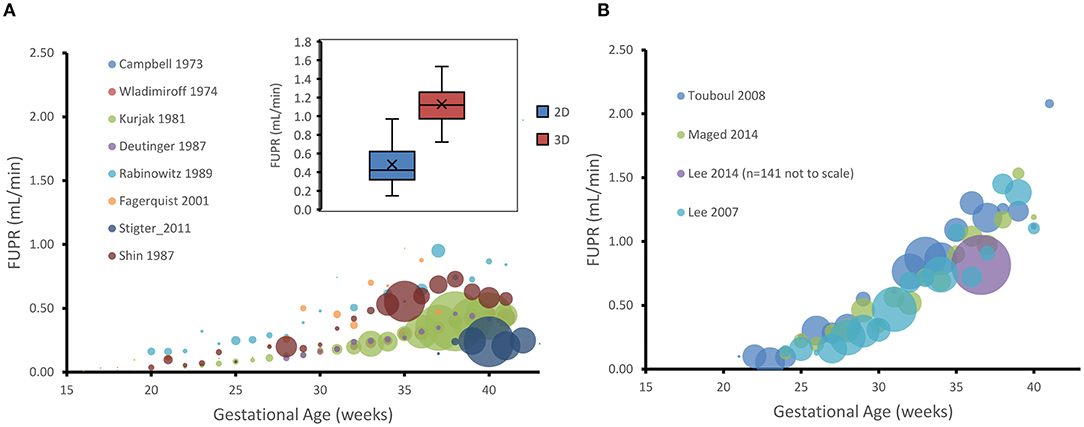
Figure 1. Gestational age plotted against hourly fetal urine production rate (FUPR) as measured either by 2D (A) or 3D (B) ultrasonic technique. Each data point is the mean FUPR from the subjects detailed in the studies shown in the legend for each age. The number of subjects averaged for each point are represented by the width of the bubble, ranging from, in A, n = 1 (26) to n = 39 (22) at week 38, and, in B to n = 14 (20) at week 33. Inset shows the data for estimates of FUPR calculated from either the 2D or 3D ultrasound techniques from 35 gestational weeks to term. Boxes: interquartile range. Median: midline. Crosses: mean. Whiskers: maximum and minimum.
Prediction of FUPR From Fetal AgeThe weighted mean for the collated data measured by 3D ultrasound indicated that the FUPR (mean ± SD) increases from 0.10 ± 0.08 ml/min at 21 GAs to 0.33 ± 0.15 ml/min at 30 GAs, reaching about 1.39 ± 0.64 ml/min at term. Since the 3D ultrasound data gives more accurate measurements of fetal bladder volume (31), the 3D data was used to create the predictive function for FUPR (Figure 2A). Results of FUPR data analysis for 3D studies indicated that the polynomial function provided the best fits to the observed data, however it predicted negative values at the beginning of the second trimester (Supplementary Figure 1A). In contrast, the power law function does not have this shortcoming and produced realistic FUPR estimates at all fetal ages, therefore, this power law function was selected (diagnostic statistics of the tested functions are available in the Supplementary Table 1).
FUPR3D (mLmin)= 3.21×10⁻⁷ FA4.21 (5)Where FA is fetal age in weeks.
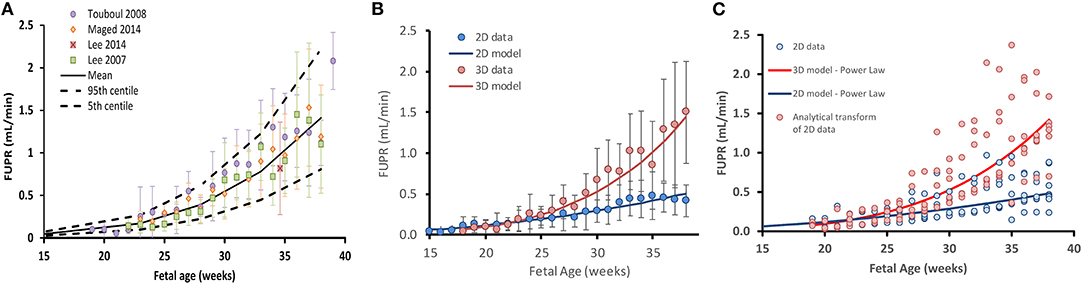
Figure 2. Fetal urine production rate (FUPR) during development. (A) FUPR as a function of fetal age (weeks). Colored filled circles are mean observations from 3D ultrasound data and error bars represent the standard deviation (SD). Solid black lines are predicted mean FUPR (From power law regression model, Equation 4) and dashed black lines represent the 5th and 95th percentiles for the observed data. (B) Observed mean 3D (red) and 2D (blue) ultrasound data. Each point is a weighted mean and standard deviation (bars), weighted by the number of subjects at each week. Power law regression models for each methodology are shown in solid lines. (C) Effect of transforming FUPR, as measured by 2D ultrasound (blue open circles). Summary data for every study plotted separately rather than averaged (as in the case in B). Resultant transformed data points (red open circles using Equation 7). Blue solid line: 2D power law regression model (Equation 5). Red solid line: 3D power law regression model (Equation 4).
The weighted mean for the collated data measured by 2D ultrasound indicated that the FUPR (mean ± SD) increases from 0.12 ± 0.1 ml/min at 21 GAs to 0.21 ± 0.11 ml/min at 30 GAs, reaching about 0.42 ± 0.19 ml/min at term. A power law function was selected among the tested functions (Supplementary Table 2), for the same reasons mentioned earlier for fitting 3D, resulting in Equation 6:
FUPR2D(mLmin)=1.69×10⁻⁴ FA2.19 (6)Performance of these functions together with the data are shown in Figure 2B.
Since 2D ultrasound methods are more commonly used for fetal assessments, it would be useful to have a function that can transform 2D-derived estimates of fetal urine production rates into values that would have been obtained using the 3D technique. To this end, we derived the following analytical function by dividing the 3D model by the 2D model as shown in Equation 7.
FUPR3D=1.89×10⁻³FA2.02FUPR2D (7)Where FUPR_2D is the estimate of FUPR as calculated using the 2D method and FUPR_3D is an estimate of fetal urine production rate that would have been obtained if the 3D technique had been employed instead. This equation can be applied as a correction function to transform 2D measurements to 3D estimates. The effect of applying this scaling function on the 2D data is shown in Figure 2C.
Amniotic Creatinine LevelSixteen different original research articles with measured values of creatinine concentrations in the amniotic fluid (N = 1,319) across various gestational ages, meeting the pre-defined inclusion criteria were identified (Table 2). The collected data were obtained from studies where amniotic fluid samples were withdrawn either by amniocentesis, from uncontaminated samples during labor, or at birth during scheduled cesarean sections. The weighted mean fetal creatinine levels showed a steady increase with gestational age, from 3.2 mg/L at 9 weeks GA to 25.7 mg/L at term.
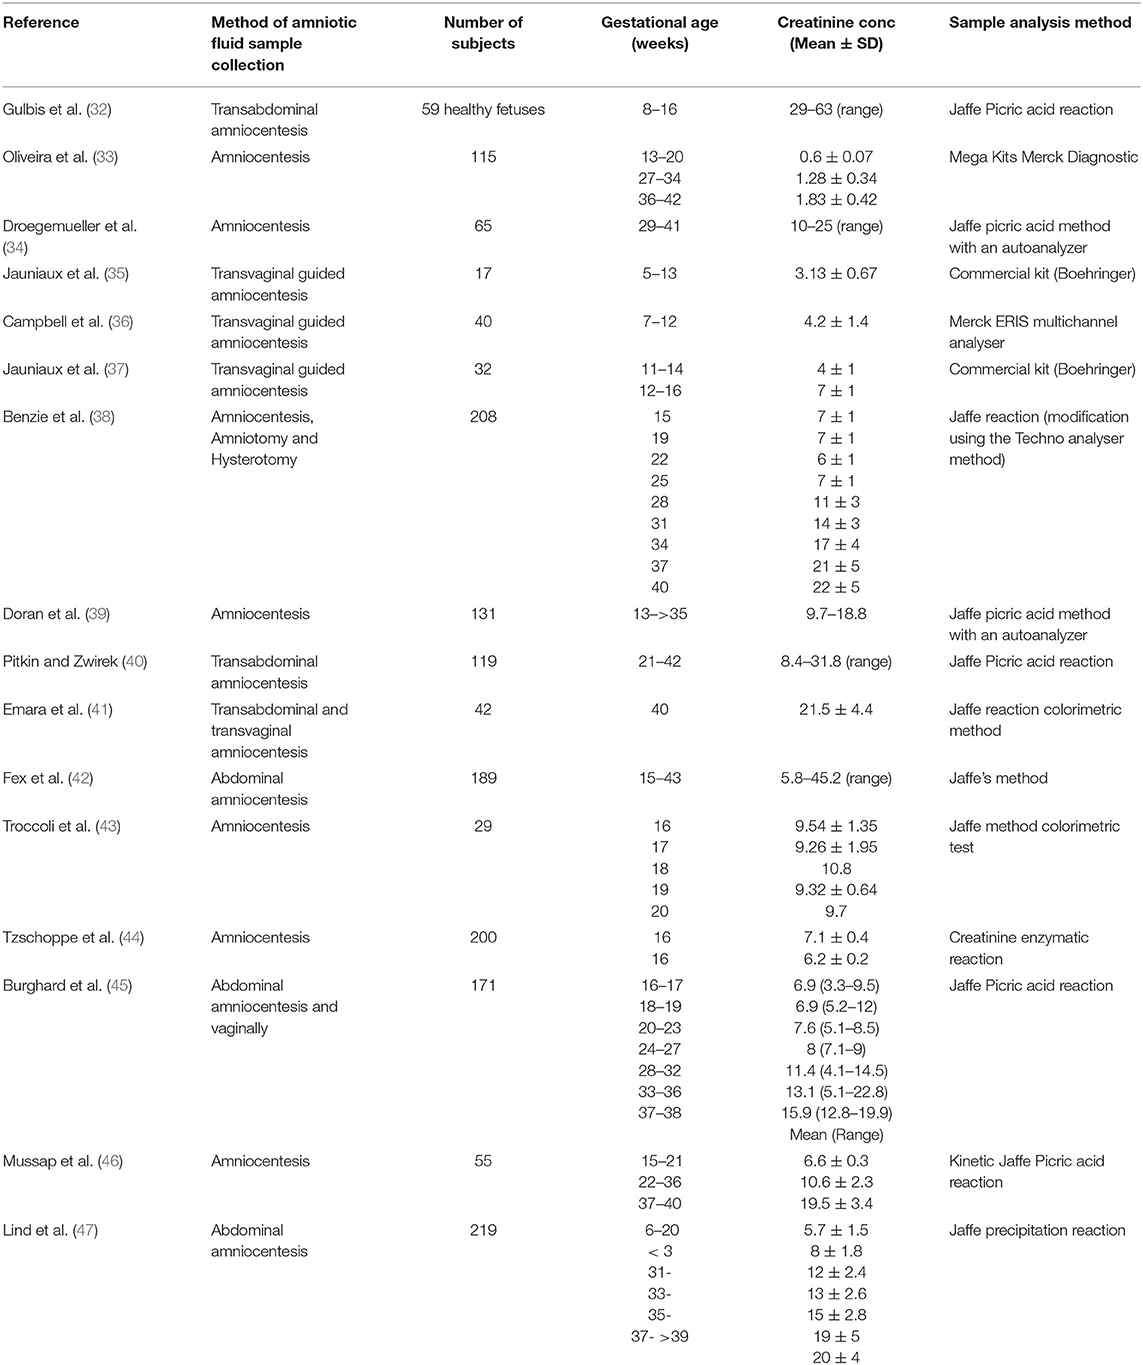
Table 2. Summary of studies with measured values of amniotic fluid creatinine concentration (mg/L) at different gestational ages.
Collected data on changes of amniotic creatinine concentration indicate a rapid increase in amniotic fluid creatinine concentration (mg/L) from a mean (SD) of 4.5 (1.1) at 10 GAs to 7.5 (1.8) at the middle of pregnancy reaching a value of 22 (5.4) at term (Figures 3A,B). The longitudinal changes in measured amniotic fluid concentration with gestational age between 5 and 40 GAs was best described by a 3rd order polynomial function (R2 = 0.97):
Amniotic Creatinine (mg/L)=0.0012 FA 3-0.0632 FA 2+1.304 FA-2.4653 (8) Amniotic Creatinine (mg/L)=0.0012 GA 3-0.0705 GA 2+1.5714 GA-5.3358 (9)A plot of predicted amniotic creatinine concentration vs. the predicted FUPR at different fetal ages indicate a strong linear relationship (R2 = 0.9527) between these two variables (Figure 3C).
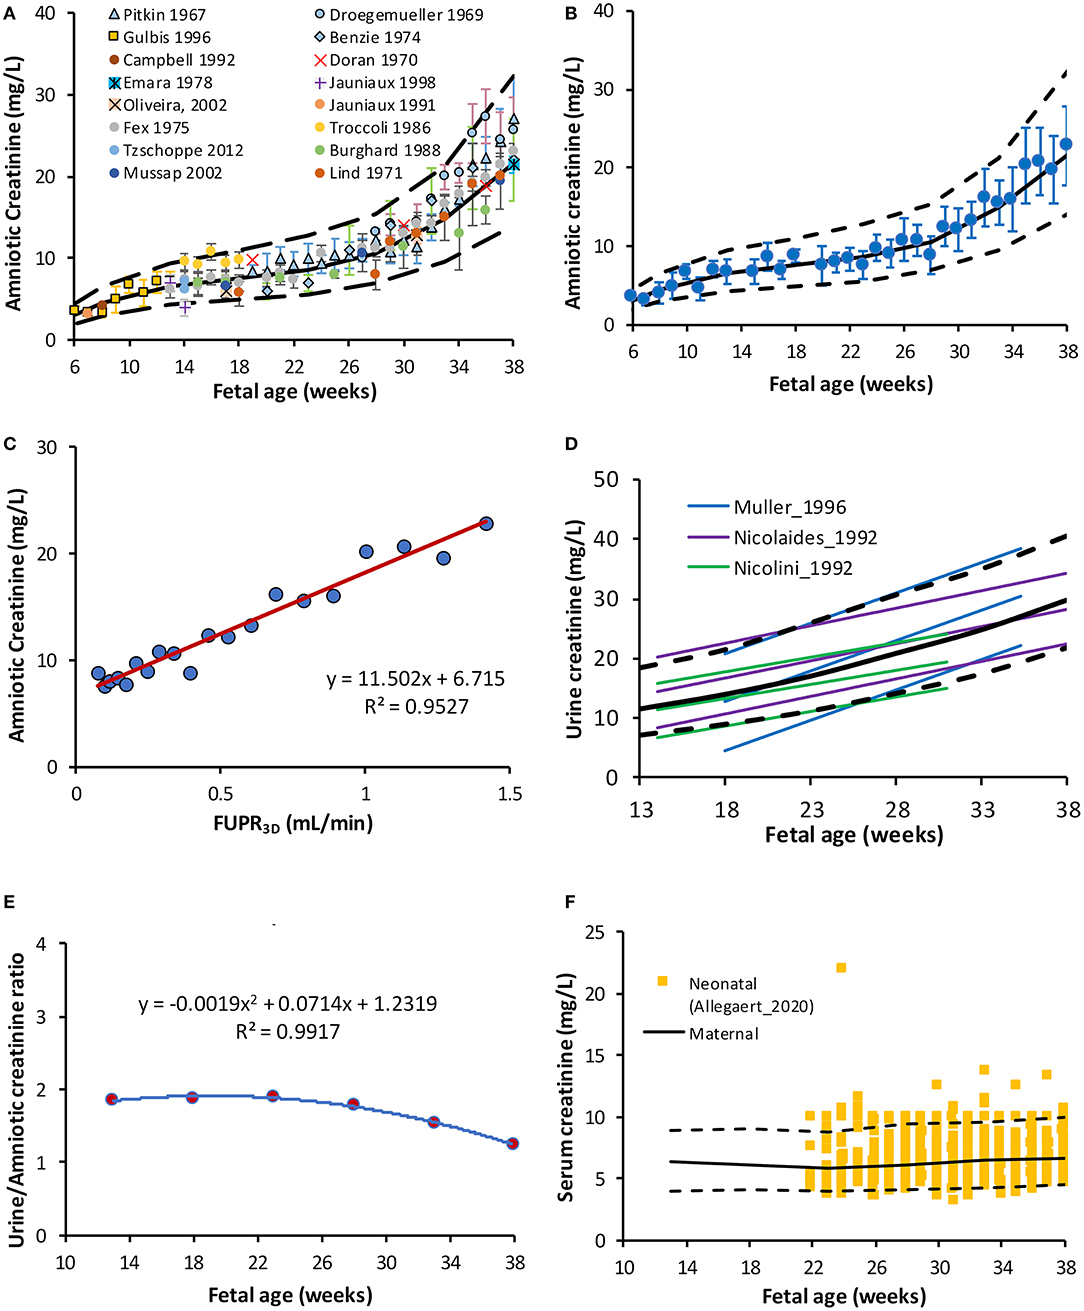
Figure 3. Creatinine level in the amniotic and fetal fluids. (A) Fetal amniotic creatinine concentration as a function of fetal age, (B) weighted means (circles) and SD of amniotic creatinine level plotted against Fetal age, (C) Amniotic creatinine concentration against predicted FUPR based on the function derived from 3D data (D) reported references values for the creatinine in fetal urine from fetuses diagnosed with (6, 48) and without (49) urinary tract uropathies (E) Fetal amniotic to urine creatinine ratio, and (F) Serum creatinine in maternal serum [lines (50)] overlaying measured neonatal serum creatinine at birth [squares (51)]. Solid and broken lines represent the median and 5th-95th intervals.
Fetal Urine CreatinineInformation on changes in fetal UrCr were limited to three studies (6, 48, 49), where samples were obtained from fetal renal pelvis, ureter, or bladder (Supplementary Table 3). The following polynomial function was derived to describe these three studies:
Fetal UrCr (mg/L)= 8.43+0.0720 GA +0.0119 GA2 (10) Fetal UrCr (mg/L)= 8.62+0.1195 FA +0.0119 FA2 (11)This equation was used to calculate fetal GFR (Scenario A). Data from two studies (6, 48) were obtained from fetuses with different uropathies, but were either “normal” with respect to their postnatal function or their kidney, which were histologically normal before elective termination of pregnancy, The fetal GFR was also assessed using the original equation reported by Nicolini et al. (49) for their “normal” fetuses aged 16–33 GAs:
Fetal UrCr (mg/L)= (31.2+4.29 GA)(1088.42) (12)The term (10/88.42) is for unit conversion from μmol/L to mg/L. Since this equation was derived from fetal data between 16 and 33 GAs, an assumption was made that this equation can be used to predict fetal UrCr at term (Scenario B).
Fetal Serum CreatinineData search retrieved limited information on fetal SerCr concentration (Supplementary Table 4). Fetal SerCr was shown to be similar to maternal level in 63 pregnancies at 20-26 GAs with fetal/maternal ratio =1 (52). Likewise, in another study with a cohort of mothers and their fetuses (n = 522), serum samples were simultaneously measured, and the maternal and fetal SerCr levels showed an equilibrium (fetal/maternal ratio = 1) from 16 GAs until term (53). Unfortunately, neither the fetal nor the maternal SerCr was reported separately. Previously, we reported an equation based on the meta-analysis of the maternal SerCr at different gestational weeks (R2 = 0.9543) (50):
Maternal SerCr (mg/L)=10 (0.80-0.0147 GA+0.0003 GA2) (13)Data were generated using this function assuming 25% CV and then compared against 4,509 SerCr measurements obtained at birth (23–42 GAs) from 1,181 newborns (51). Due to its low molecular weight (113.12 g/mol), creatinine freely passes the placental barrier and its level at birth is known to reflect the maternal level. Indeed, the comparison of maternal SerCr and neonatal SerCr results showed perfect overlap (Figure 3F) indicating the adequacy of using maternal SerCr for calculating the fetal GFR (i.e., Fetal SerCr = Maternal SerCr = neonatal SerCr at birth).
Fetal GFRPredicted fetal GFR values at different gestational weeks are given in Table 3 for the different fetal urine creatinine assumptions. Plot of the predicted fetal GFR profiles at different gestational and fetal ages are given in Figure 4. The profiles show good agreement with neonatal GFR values measured for preterm and term neonates within the first postnatal day.
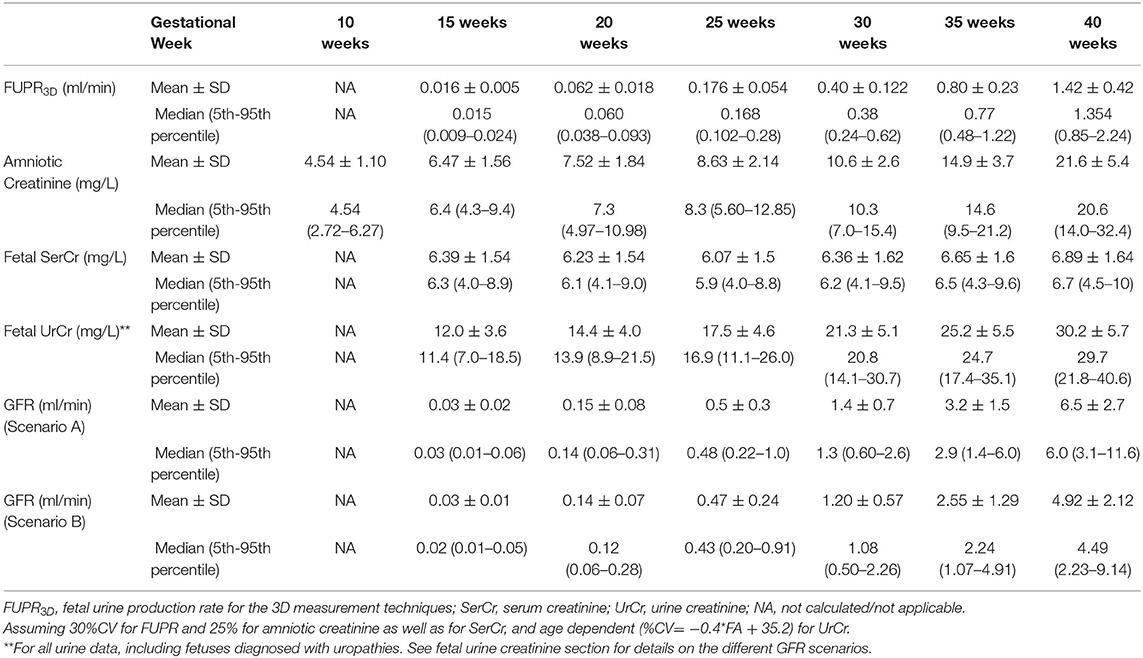
Table 3. Predicted values for fetal urine production rate (FUPR), creatinine level and GFR at different gestational weeks.
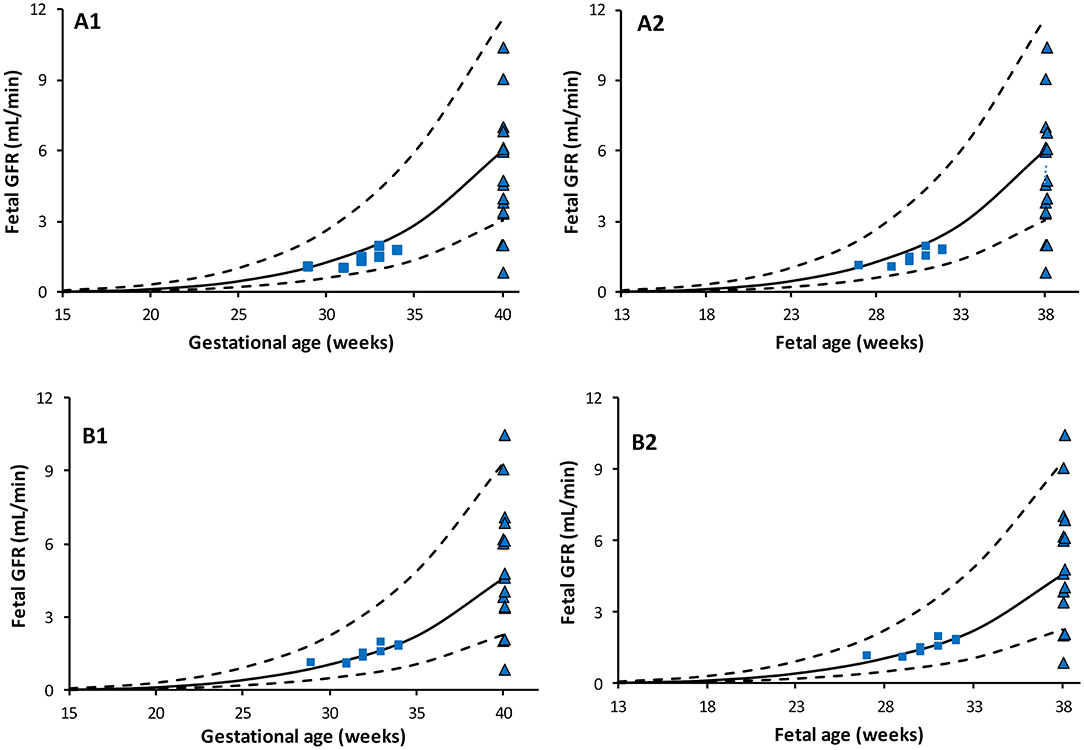
Figure 4. Predicted Fetal GFR profiles at different gestational (left) and fetal (right) ages. Scenario (A) using maternal SerCr in place of fetal SerCr, while fetal UrCr used equation based on data that include normal fetuses (49) and fetuses diagnosed with uropathies (6, 48). Scenario (B) using maternal SerCr in place of fetal SerCr, while fetal UrCr is only based on “normal” fetuses as per Nicolini et al. Solid lines represent median, broken lines represent 5th and 95th percentiles. Shapes represent observed neonatal GFR measured within few hours after birth in full term [triangle, Strauss et al. (54)] and preterm [squares: Coulthard et al. (55)] subjects.
DiscussionThis study quantifies the longitudinal increase of FUPR with respect to fetal age and the associated changes in creatinine levels in the fetal urine and amniotic fluid in uncomplicated pregnancies. These findings have potential applications in the assessment of normal fetal GFR maturation. Different studies have previously measured FUPR as an assessment of fetal renal function and perinatal outcomes in both normal and complicated pregnancies (21, 22, 30). FUPR estimation depends on the volume of the bladder, which is neither regular nor static, due to filling and emptying activities during fetal micturition. Historically, the 2D ultrasonic measurements derive bladder volume using an assumption that the bladder has a static ovoid or ellipsoid shape to compensate for the lack of depth information (27). The ellipsoid formula may underestimate or overestimate the bladder volume by up to 33%, depending on what bladder shape was being considered (56). In addition, since the mean time of the fetal bladder cycle is about 25 min (23), an estimated FUPR will also depend on the interval of bladder volume measurements. Studies conducted using real ultrasounds were able to capture the activity of the fetal bladder, and more frequent measurements at about 5 min intervals, produced higher FUPR than those made at 15-to-30-min intervals (Table 1).
The introduction of 3D ultrasonography offers more accurate volume measurements of irregular shapes (including fetal bladder volume) compared to the 2D ultrasonography, including fetal bladder volume as it quantifies the volume from the three spatial dimensions. When 3D ultrasonography is coupled with the rotational multiplanar technique VOCAL, a detailed and quick acquisition of the bladder volume can be obtained with lower inter- and intra-observer variability (57) and more reliable FUPR estimation than those measured using the 2D or manual planimetry 3D ultrasound (58).
The current study utilized FUPR values measured using 2D or 3D ultrasound to derive a function to predict changes of FUPR with fetal age. Previous studies derived various functions (Table 1) and proposed either a linear or a second order polynomial function (Table 1). Only one study proposed a power model function (20). From our analysis, the polynomial regression for the 3D data had the highest R2 value indicating the best fit to the observed data, however, it predicted negative values for FUPR before the 19th fetal week (Supplementary Figure 1). Since it is known that fetal urine production begins around 13 weeks, this function was not selected. Given that the difference between MSE and R∧2 for the power law and the polynomial regressions are small (Supplementary Table 1), the power law function was chosen for describing FUPR. The FUPR2D predicted a maximum fetal urinary flow rate of 0.5 ml/min (0.03 L/h) at 40 weeks GA. This value is ~3-fold less than the mean estimated value of 1.41 ml/min (0.085 L/h) at term using the FUPR3D technique. A correction function for the FUPR2D data has therefore been derived to facilitate FUPR measurement conversion at different fetal or gestational ages.
Assessment of fetal renal maturation has been attempted by different methods, including the measurement of amniotic fluid volume, clearance of endogenous or exogenous filtration markers, urine production and urinary analyte levels, which can be measured in either fetal urine or in amniotic fluid (6, 15). The volume of amniotic fluid is a poor indicator of renal function since it is not determined by the fetus only, but also by the mother, especially during the first half of pregnancy. Fetal urine becomes a major contributor to the amniotic fluid volume during the second half of pregnancy, and its contribution increases with pregnancy progression until term. The concentration of urinary analyte levels in the amniotic fluid is also challenged by identifying a pure “urinary analyte” that is of a large enough molecular weight (MWt), that it does not cross the maternal-amniotic and fetal-amniotic barrier by any route, but small enough to pass through the fetal glomerular pores by sim
留言 (0)