
記住我


A fundamental characteristic of eukaryotic cells is the existence of an organized actin cytoskeleton. Dynamic actin filaments are assembled into diverse architectures which coexist within one cytoplasm, each of which is involved in the exertion of forces for various cellular functions (Blanchoin et al, 2014). Key partners are families of actin-binding proteins (ABPs), which interact with actin monomers and filaments to regulate cytoskeletal organization and dynamics (Moseley & Goode, 2006; Pollard, 2016). Actin sequence is highly conserved across most eukaryotes, but while some cell types only express a single actin (e.g., yeasts), other cell types can express several similar actin isoforms (e.g., nonmuscle mammalian cells express beta- and gamma-actins, which are 99% identical), or even very different actin isoforms (e.g., Chlamydomonas reinhardtii expresses two actins, IDA5 and NAP1, which are only 65% identical) (Gunning et al, 2015; Boiero Sanders et al, 2020). An extreme case is plants, which can express a multitude of actin isoforms (e.g., Zea mays and Arabidopsis thaliana express 21 and 8 actin isoforms, respectively). Adding to this complexity, some actins can undergo partial posttranslational modifications (PTMs), such as arginylation or acetylation, which modify their biochemical properties (Kashina, 2014; A et al, 2020; Boiero Sanders et al, 2020).
Hence, while a number of organisms are able to assemble a complex actin cytoskeleton from one (or a limited number) of actin isoforms, other organisms require the presence of multiple actin isoforms to generate such variability. In line with this idea, segregation of actin isoforms is observed in vivo. Results from different mammalian cell lines have found that beta-actin was located mainly in the contractile ring, stress fibers, filopodia, and cell–cell contacts while gamma-actin was localized primarily in the cortex and lamellipodia (Dugina et al, 2009; Chen et al, 2017). In Arabidopsis thaliana, the main vegetative actin isoforms organize into different structures in epidermal cells (Kijima et al, 2018). However, it should be noted that expression in mice of a beta-coded gamma-actin, where the nucleotide sequence of beta-actin is modified minimally to express gamma-actin, led to viable mice with no detectable change in behavior (Vedula et al, 2017). This result indicates that at least in some cases, the absence of an actin isoform can be compensated by the expression of a similar isoform.
A particular challenge for the field is to understand how small differences at the molecular level lead to a major segregation of actin isoforms at the cellular level. To decipher the underlying mechanisms, it is natural to postulate that actin isoforms bear small yet significant biochemical differences. Our knowledge of the distinctions between actins is limited to a small number of actin orthologs (mainly S. cerevisiae Act1p, rabbit muscle actin, to a lesser extent beta- and gamma-actins, S. pombe Act1p and plant actins). Nonetheless, these studies reveal notable differences in their biochemical properties (Nefsky & Bretscher, 1992; Buzan & Frieden, 1996; Kim et al, 1996; Bryan & Rubenstein, 2005; Takaine & Mabuchi, 2007; Kijima et al, 2016), in their mechanical properties (Orlova et al, 2001; McCullough et al, 2011), and their ability to interact with the different actin-binding proteins (Nefsky & Bretscher, 1992; Eads et al, 1998; Takaine & Mabuchi, 2007; Ezezika et al, 2009; McCullough et al, 2011; Kang et al, 2014; Kijima et al, 2016), including nucleation factors of actin assembly (Ti & Pollard, 2011; Chen et al, 2017). How such differences account for spatial segregation of actin isoforms on a cellular scale remains unclear.
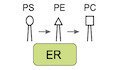
In this work, we investigated, from a general perspective, the molecular principles by which actin isoforms can be addressed to different networks. Analysis in a model system, that exploits at least two actins to perform various actin functions, would explain a particular mechanism in a relevant physiological context. However, the importance of actin renders genetic manipulations difficult, and the inter-connection of actin networks in such models complicates cellular analysis. Mammalian systems in particular express many ABP isoforms, which makes interpretation of molecular mechanisms combinatorially challenging. Furthermore, coexpression of multiple actin isoforms makes endogenous purification as a single species difficult, although new powerful protocols have been developed in recent years for their expression and purification (Hatano et al, 2018, 2020). To overcome these limitations, we decided to adopt an alternative strategy, by determining the consequences of heterologous actin expression in a system normally using a single actin. With this approach, we aimed at measuring the consequences of a perturbation caused by the use of a different actin at the level of the cell and its cytoskeleton. We decided to use the well-studied organism, budding yeast, for the simplicity of its genetics. Another advantage of budding yeast is that actin assembles predominantly into two well-defined structures. These structures are actin patches, which are sites of endocytosis and where actin filaments are short and branched by the Arp2/3 complex, and actin cables, which are central for maintenance of cell polarity and intra-cellular trafficking, and where actin filaments are nucleated by the formin family of proteins (Moseley & Goode, 2006). Lastly, budding yeast allows for clean purification of ABPs in a defined organismal context.
Our results demonstrate that actin functions are regulated both at the nucleotide level where defects in actin expression leads to cell growth defects, and at the amino acid level where expression of heterologous actins induces a massive reorganization of the actin cytoskeleton. We demonstrate that actin isoforms are used with different efficiencies by the distinct actin assembly pathways, resulting in their targeting to particular actin structures. Finally, dissection of the underlying molecular mechanisms allows us to propose an explanation of our results, and a general model of the molecular mechanisms enabling segregation of actin isoforms in cells.
Results Generation of a library of yeast strains expressing a variety of actin orthologsWe created a library of S. cerevisiae strains that express different actin orthologs to evaluate the consequences of actin variation on yeast actin cytoskeleton assembly. In order to ensure that defects were not due to potential misfolding or nonfunctional actin, we selected a diversity of actins from other species rather than using directed mutations. This approach guarantees that the actin orthologs are functional in a biologically relevant context, and maintain key physiological properties such as polymerization, depolymerization, nucleotide binding, and hydrolysis.
We chose 126 different actins from species covering the entire eukaryotic and archeal phylogenetic tree for analysis (Appendix Table S1 and Appendix Fig S1A). We also computationally predicted ancestral sequences to extend the range of actin variant possibilities. Because the actin protein sequence is highly conserved across species, ancestral sequence reconstructions score with high confidence (Appendix Fig S1B). We obtained in total 227 actin sequences (including 101 ancestral actins), from which we selected 19 for analysis. These actin orthologs were chosen to cover a spectrum from the most similar to wild-type S. cerevisiae’s actin (Act1p, called here Act_Sc) to very divergent actin orthologs, which represent a wide range of identities (from 99 to 60%) (Fig 1A, Table EV1 and Appendix Fig S1B and C), and to display differences across all domains of the actin fold (Fig 1B and C and Appendix Fig S1C).

Figure 1. Variety of actins selected for this study and analysis strategies
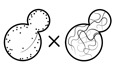
Simplified phylogenetic tree showing mainly the Dikarya subkingdom and including the external branches Homo sapiens (Hs) and Arabidopsis thaliana (At). The Id. column indicates amino acid sequences percentage identities, ranging from 100% (green) to 84% (magenta) identity for eukaryotic actins to S. cerevisiae’s actin, and 60–62% (black) for archaeal actins. Squares’ outlines are solid or dotted for sequences deriving from existing species or ancestral reconstruction, respectively. The “coded by” column indicates, which coding sequences were originally used to code genes of interest. Nucleotide sequence identities are ranging from 100% (blue) to 76% (orange) compared to S. cerevisiae’s actin coding sequence. Amino acid sequence of Saccharomyces cerevisiae actin. Arrows denote all the positions that are mutated in at least one of the actin variants tested in this study. Schematic representation of S. cerevisiae actin 3D structure (1YAG; Vorobiev et al, 2003), showing that mutations cover all regions of the protein. Dots indicate where mutations are located, using a different color code for all actins studied here. Schematic showing the mutagenesis strategies applied in this study, enabling to question respectively the importance of actin’s intron, the nucleotide sequence, the amino acid sequence, and the effect of expressing copolymers. Green color indicates whether modifications are brought in the coding sequence (leading to expression of wild-type Act1 protein (pink) or in the amino acid sequence (leading to expression of an Act1* actin ortholog).We synthesized the actin nucleotide sequences and subcloned them in a plasmid created specifically for rapid and robust actin gene replacement under endogenous promoter control in S. cerevisiae (Appendix Fig S1D). Homologous recombination was performed on diploid cells so that the presence of a wild-type actin copy would favor viability of the sickest strains. Despite this, we were unable to generate viable strains that could express four highly divergent archeal actins, corresponding to those of phyla Lokiarchaeota, Odinarchaeota, Thorarchaeota, and Heimdallarchaeota, which all share 60–62% of sequence identity with budding yeast actin. All mutants expressing eukaryotic actins could be generated, and were sporulated in order to study haploid cells expressing only the new actin variant. With this strategy, we created an extended library of yeast strains, from which we systematically studied the effect of deleting the actin intron in haploid cells, changing the nucleotide sequence without modifying the final actin protein in haploid cells, switching actin protein variants in haploid cells, and expressing copolymers of actin in diploid cells (Fig 1D).
Previous studies have demonstrated that the yeast actin intron is not essential for actin gene transcription and for normal cell growth (Ng et al, 1985). Indeed, our analysis found that an act1 gene construct without the intron in S. cerevisiae S288C (ScNI) does affect neither cell growth (Appendix Fig S2A and B) nor actin expression (Appendix Fig S2C and D). Fixation and phalloidin-labeling of the actin cytoskeleton reveals that the two main structures of actin filaments in yeast, actin patches and actin cables, are well-organized in yeast strains expressing actin in the absence of the intron and indistinguishable from wild-type cells (Sc) (Appendix Fig S2E–G). Therefore, all experiments presented in the following sections of this study were conducted on actins expressed in the absence of an intron.
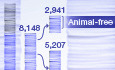
Cell fitness tolerates reduced wild-type actin expression above a thresholdWe were concerned that small changes to the actin nucleotide sequence might have consequences on actin expression levels and cell viability (Hoekema et al, 1987; Zhou et al, 2016). In mammals, for instance, nucleotide sequence was shown to differentiate beta and gamma actin functions (Vedula et al, 2017). Therefore, we expressed wild-type actin from a range of different nucleotide sequences. We used coding sequences from other organisms, which we modified minimally so that the final product remained S. cerevisiae’s actin at the protein level (Table EV1 and Appendix Fig S2H). Western blot analysis showed that silent mutations affect wild-type actin’s expression level to various extents (Fig 2A and B), with correlation between actin expression and the level of conservation of the nucleotide sequence (Fig EV1A). RNAseq analysis showed, on the contrary, that genes encoding actin regulators are not significantly differentially expressed (Fig EV1B). These data also revealed that a sizeable drop of actin expression (e.g., Act_Sc[Ca], derived from C. albicans’ actin gene, is expressed at 46% of normal level) has no effect on cell viability (Figs 2C and D, and EV1C and Appendix Fig S2I–J). We analyzed the organization of the cytoskeleton of phalloidin-labeled cells by measuring the total intensity of patches and cables (Appendix Fig S2K), their numbers (Appendix Fig S2L), as well as the overall balance between these two structures whose assembly is interdependent (Burke et al, 2014) by calculating a deviation index (Antkowiak et al, 2019) (Fig 2F). Sc[Ca] cells expressing less actin also have a less bright cytoskeleton, but keep a normal distribution between actin patches and cables, and normal cell polarity (Fig 2H). However, a more drastic drop of actin expression (e.g., Act_Sc[At], derived from A. thaliana’s ACT8 gene, is expressed at 24% of normal level) affects visibly cell viability (Fig 2C and D and Appendix Fig S2I–J), the organization (Fig 2E–G and Appendix Fig S2K–L), and the polarization (Fig 2H) of the actin cytoskeleton. Unexpectedly, none of these strains expressing wild-type actin showed a significant change in monomeric-to-filamentous (G/F) actin ratios (Fig EV1D). Expressing actin from a gene derived from the nucleotide sequence of H. sapiens ActB (Act_Sc[Hs]), whose nucleotide sequence is even less conserved, is lethal for cells. From these observations, we concluded that expression levels of actin orthologs should be controlled carefully in this study, but that half variations in actin expression have negligible effect on cell behavior.

Figure 2. Effects of silent mutations on actin expression levels, cell viability, and cytoskeletal organization
In this figure, the shape of the dots allows to identify the strains on the different graphs (circles for Sc, squares for ScNI, triangles for Sc[Ca], inversed triangles for Sc[Sp] and diamonds for Sc[At]). The color of the dots indicates the percentage of identity of the nucleotide sequences to the actin gene of S. cerevisiae, ranging from 100% (blue) to 76% (orange).
Actin expression levels shown by western blotting for strains expressing S. cerevisiae’s actin protein from various coding sequences, with tubulin (Tub1p) as a loading control. Quantification of actin expression levels, showing a decrease when more silent mutations are present. Data are presented as mean ± SD (n = 4 for Sc, n = 8 for ScNI; n = 12 for Sc[Ca], Sc[Sp], and Sc[At]; 2 biological replicates with n/2 technical replicates each). *P < 0.05 (Brown–Forsythe and Welch ANOVA tests, with Dunnett’s T3 multiple comparisons tests). Doubling times of yeast strains cultures, grown at 25°C in YPD medium. Data are presented as mean ± SD (n = 6 for Sc, n = 3 for ScNI, Sc[Ca], Sc[Sp] and Sc[At]; technical replicates). *P < 0.05 (Brown–Forsythe and Welch ANOVA tests, with Dunnett’s T3 multiple comparisons tests). Level of actin expression as a function of growth constant does not show any clear correlation. Rather, there is an apparent level of actin expression (0.25 < expression < 0.35) below which growth rates drastically reduce. Data are presented as mean ± SD (for actin expression values, n = 4 for Sc, n = 8 for ScNI; n = 12 for Sc[Ca], Sc[Sp] and Sc[At]; 2 biological replicates with n/2 technical replicates each; for growth constants, n = 6 for Sc, n = 3 for ScNI, Sc[Ca], Sc[Sp] and Sc[At]; technical replicates). r is a Pearson correlation coefficient considered nonsignificant if its two-tailed P-value is > 0.05. Phalloidin staining depicting F-actin organization. Images are maximum intensity projections of 3D stacks. Scale bar: 3 µm. In vivo actin network deviation indexes, defined to evaluate the patch-cable balance compared to S. cerevisiae haploid cells (value is 0 in S. cerevisiae’s cells, 1 when cells contain only actin patches and −1 when cells contain only cables). Data are presented as mean ± SD (n = 30 for all conditions). ***P < 0.001 (Brown–Forsythe and Welch ANOVA tests, with Dunnett’s T3 multiple comparisons tests). In vivo actin network deviation indexes as a function of actin expression levels does not show any clear correlation. Rather, we observe a threshold of actin expression levels (0.25 < expression < 0.35) below which actin cytoskeleton organization is affected. Data are presented as mean ± SD (for actin expression values, n = 4 for Sc, n = 8 for ScNI; n = 12 for Sc[Ca], Sc[Sp] and Sc[At]; 2 biological replicates with n/2 technical replicates each; for indexes, n = 30 for all conditions). Pearson correlation coefficient r is considered nonsignificant if P > 0.05. Polarity indexes, defined to assess whether cell polarity is normal or affected (value is 1 when all patches of medium to large budded cells are present in the bud, and −1 refers when all patches are in the mother cell). Data are presented as mean ± SD (n = 30 for all conditions). **P < 0.01, ***P < 0.001 (Brown–Forsythe and Welch ANOVA tests, with Dunnett’s T3 multiple comparisons tests).Data information: Abbreviations: ns - nonsignificant, Sc - wild-type S. cerevisiae cells, ScNI – S. cerevisiae cells where the actin gene has been replaced with the wild-type gene but without the intron, Sc[X] – S. cerevisiae cells where the actin gene has been replaced with a gene carrying silent mutations based on the sequences from species X (for the list of species and coding, see Table EV1 or Fig 1).
Source data are available online for this figure.
Click here to expand this figure.
Figure EV1. Effects of silent mutations on gene expression, cell growth, and monomeric-to-filamentous actin ratio, related to Fig 2
In this expanded view figure, the shape of the dots is conserved from Fig 2 and allows to identify the strains on the different graphs (circles for Sc, squares for ScNI, triangles for Sc[Ca], inversed triangles for Sc[Sp], diamonds for Sc[At] and crosses for nonviable strains). The color of the dots indicates the percentage of identity of the nucleotide sequences to the actin gene of S. cerevisiae, ranging from 100% (blue) to 75% (orange). Actin expression levels, relative to wild-type, as a function of nucleotide conservation, showing that increased number of silent mutations lowers actin expression. Data are presented as mean ± SD (n = 4 for Sc, n = 8 for ScNI; n = 12 for Sc[Ca], Sc[Sp] and Sc[At]; 2 biological replicates with n/2 technical replicates each). Pearson correlation coefficient r is considered nonsignificant if P > 0.05. Differential gene expression of Sc[Ca], Sc[Sp] and Sc[At] strains compared to ScNI strain. Y-axis represents the adjusted P-value of FDR (False Discovery Rate) calculated with Benjamini and Hochberg method, and X-axis fold-changes. Red dots highlight proteins of interest (actin and 32 regulatory proteins) and grey dots represent all the other proteins identified by RNA-seq. Growth constant as a function of nucleotide identity, showing a threshold of nucleotide conservation (78% < id < 82%) below which growth rates drastically reduce. Data are presented as mean ± SD (n = 6 for Sc, n = 3 for ScNI, Sc[Ca], Sc[Sp] and Sc[At]; technical replicates). Pearson correlation coefficient r is considered nonsignificant if P > 0.05. Evaluation of monomeric-to-filamentous actin ratios. Data are presented as mean ± SD (n = 12 for Sc and ScNI and 4 for Sc[Ca], Sc[Sp] and Sc[At]; 2 biological replicates with n/2 technical replicates each). (Brown–Forsythe and Welch ANOVA tests, with Dunnett’s T3 multiple comparisons tests).Source data are available online for this figure.
Actin amino acid sequence variations affect cell fitness and imbalance the linear-to-branched actin network ratioWe next focused our attention on the consequences of expressing 15 heterologous eukaryotic actin orthologs in yeast haploid cells. Actin genes were designed based on S. cerevisiae’s act1 sequence by making point mutations using yeast codon usage. Overall, all coding sequences used in this section are more than 90% identical to that of S. cerevisiae, which, according to the previous section, lowers the risk that actin expression is reduced excessively. Only 8 actin orthologs led to viable conditions. Their expression level varied, and appeared not to be correlated with the evolutionary relationship (Fig 3A and B). For example, Act_N1 was only expressed at 39% despite having a 98.4% identity to wild-type actin and showed normal viability and cytoskeletal organization (Fig 3A–G). For two strains studied in detail in this article, N2 and Ca, we also verified by RNAseq that genes encoding actin regulators, including the Arp2/3 complex and the two formins Bni1 and Bnr1, are not significantly differentially expressed (Fig EV2A).

Figure 3. Effects of swapping actin for different variants on cell viability and cytoskeletal organization
In this figure, the shape of the dots allows to identify the strains on the different graphs (closed circles for Sc, closed squares for ScNI, closed triangles for N1, inversed closed triangles for Kl, closed diamonds for N2, closed pentagons for Op, stars for Ca, open circles for Nc, half-open triangles for Yl, half-open inversed triangles for Hs and crosses for nonviable strains). The color of the dots indicates the percentage of identity of the amino acid sequences to S. cerevisiae’s actin, ranging from 100% (green) to 84% (magenta).
Actin expression levels shown by western blotting for strains expressing S. cerevisiae’s actin or other actins, with tubulin (Tub1p) as a loading control. Quantification of actin expression levels showing varying levels of expression that do not correlate with evolutionary relationship. Data are presented as mean ± SD (n = 8 for ScNI, n = 4 for all other strains; 2 biological replicates with n/2 technical replicates each). *P < 0.05 (Brown–Forsythe and Welch ANOVA tests, with Dunnett’s T3 multiple comparisons tests). Doubling times of yeast strain cultures grown at 25°C in YPD medium. Data are presented as mean ± SD (n = 3 for all conditions; technical replicates). *P < 0.05, ***P < 0.001 (Brown–Forsythe and Welch ANOVA tests, with Dunnett’s T3 multiple comparisons tests). Growth constant as a function of percentage identity of the actin variant, showing clear correlation (n = 3 for all conditions; technical replicates). Data are presented as mean ± SD. r corresponds to the Pearson correlation coefficient with a two-tailed P value and a confidence interval of 95%. Phalloidin staining of F-actin organization. Images are maximum intensity projections of 3D stacks and contrasts were adapted due to the fact that phalloidin labeling had a very different efficiency depending on the actin ortholog expressed. Micrographs of Sc and Sc_NI cells are reproduced from Fig 2E. Scale bar: 3 µm. In vivo actin network deviation indexes. Data are presented as mean ± SD (n = 30 for all conditions). *P < 0.05, ***P < 0.001 (Brown–Forsythe and Welch ANOVA tests, with Dunnett’s T3 multiple comparisons tests). Polarity indexes. Data are presented as mean ± SD (n = 30 for all conditions). *P < 0.05, ***P < 0.001 (Brown–Forsythe and Welch ANOVA tests, with Dunnett’s T3 multiple comparisons tests). Growth constant as a function of the in vivo actin network deviation index. Data are presented as mean ± SD (for growth constants, n = 3 for all conditions; technical replicates; for indexes, n = 30 for all conditions). r is a Pearson correlation coefficient considered nonsignificant if its two-tailed P-value is > 0.05. Effect of CK-666 (75 µM) on the organization of the actin cytoskeleton. Cells were stained with phalloidin after 30 min incubation with CK-666. Images are maximum intensity projections of 3D stacks. Scale bar: 3 µm. Quantification of actin patch resistance to CK-666 treatment. Bar graphs represent the percentage of cells with a given number of visible actin patches after CK-666 treatment. (n = 41 for ScNI, 55 for N2, 31 for Ca, 41 for Op, 55 for Hs).Data information: Abbreviations: ns—nonsignificant, Sc – wild-type S. cerevisiae cells, ScNI – S. cerevisiae cells where the actin gene has been replaced with the wild-type gene but without the intron, the other abbreviations correspond to cells expressing actins from other species (for the list of species see Table EV1 or Fig 1).
Source data are available online for this figure.
Click here to expand this figure.
Figure EV2. Effects of swapping actin for different variants on gene expression and monomeric-to-filamentous actin ratio, related to Fig 3
Differential gene expression of Ca and N2 strains compared to ScNI strain. Y-axis represents the adjusted P-value of FDR (False Discovery Rate) calculated with Benjamini and Hochberg method, and X-axis fold-changes. Red dots highlight proteins of interest (actin and 32 regulatory proteins) and grey dots represent all the other proteins identified by RNA-seq. Evaluation of monomeric-to-filamentous actin ratios. Control strains and strains expressing the most (resp. the least) conserved actin variants are analyzed in the upper (resp. the lower) western blot. Data are presented as mean ± SD (n = 12 for Sc and ScNI and n = 4 for all other conditions; 2 biological replicates with n/2 technical replicates each). **P < 0.01, ***P < 0.001 (Brown–Forsythe and Welch ANOVA tests, with Dunnett’s T3 multiple comparisons tests).Source data are available online for this figure.
While yeast strains expressing heterologous actin orthologs similar to S. cerevisiae wild-type actin (identity > 97%) grew well (Fig 3C and D and Appendix Fig S3D and E), had normal cytoskeletal organization (Fig 3E and F and Appendix Fig S3F and G), and were polarized normally (Fig 3G), yeast strains expressing more distant actins (identity < 97%) showed moderate to severe defects (Fig 3C–H). The strength of the growth phenotypes correlated with the degree of conservation of the actin orthologs (Fig 3D). Of the 8 strains expressing actin orthologs, only 6 could be labeled with phalloidin at varying levels of intensity, which can be attributed, apart from Act_N1, to different phalloidin binding sites from Act_Sc (Appendix Fig S3F and H). Interestingly, consequences on the organization of the actin cytoskeleton were not the same for all mutants. While cells expressing Act_N2 assembled, on average, an abnormally high number of actin patches, strains expressing Act_Op or Act_Ca assembled, on the contrary, a higher number of actin cables and few actin patches (Fig 3E, F and H, and Appendix Fig S3F–G). Though, the overall G/F actin ratio was maintained in these strains (Fig EV2B). Considering that actin networks do not assemble independently in cells, but that homeostatic actin networks share a limited monomeric actin pool (Burke et al, 2014), these observations suggest an imbalanced assembly between branched- and linear-actin structures from the use of different actin variants. We hypothesized that the cellular machinery cannot use Act_N2 efficiently to assemble actin cables, and cannot use Act_Op or Act_Ca to assemble actin patches, thus leading to an overproduction of patches in N2 cells and an overproduction of cables in Op and Ca cells. It is also possible that patch or cable assembly is boosted by the use of a particular actin ortholog, although this hypothesis seems less likely, since it is generally easier to disrupt a function than make it more efficient. In strains expressing the three most divergent actin orthologs Act_Nc, Act_Yl, and Act_Hs, phenotypes were even stronger, but cells also failed to maintain a normal G/F actin ratio (Fig 3C and D, EV2B and Appendix Fig S3D and E). Fewer F-actin was assembled, suggesting that both actin assembly pathways may be affected by the use of these actin isoforms.
In wild-type cells where actin networks are in homeostasis, addition of the small molecule inhibitor CK-666 shifts efficiently actin assembly from patches to cables (Burke et al, 2014). We tested whether such property was conserved in the strains studied here. We observed that a strain over-assembling actin patches, such as N2, showed acute resistance to Arp2/3 perturbations with a persistence of actin patches on treatment with CK-666 (Fig 3I and J, and Appendix Fig S3I–J). Conversely, Op and Ca strains were more sensitive to CK-666. These results indicate that strains with increased branched network are buffered against Arp2/3 perturbations. To further understand the mechanism of resistance to CK-666, we attempted to compare the density of actin networks in individual patches of Sc and N2 cells. Actin patches from N2 cells are 1.6-fold brighter for both phalloidin-actin and Arc15-GFP labeling (Appendix Fig S3 K–M). However, the higher phalloidin labeling intensity of N2 cells (Appendix Fig S3F) for similar amount of expressed (Fig 3A and B) and assembled (Fig EV2B) actin as wild-type cells suggests a higher affinity of phalloidin for Act_N2, and therefore an overestimation of the amount of actin assembled in N2 cells. Taken together, these crude estimations suggest that individual actin patches of N2 cells are more densely branched than those of wild-type cells.
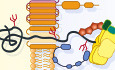
A biomimetic assay recapitulates actin ortholog preference for branched- or linear-network assemblyWe then aimed to understand the molecular principles that allow different actin ortholog to be assembled specifically to certain actin networks, and hypothesized that heterologous actin orthologs may bind defectively to certain ABPs of S. cerevisiae. Because actin assembly into patches and cables involves a large number of proteins in cells, we adopted a reductionist approach based on a reconstituted assay. We considered the subset of ABPs that are most essential for actin patch or cable assembly in vivo. Beyond formins and the Arp2/3 complex, these proteins include profilin, a small globular protein that favors formin assembly, capping protein, a heterodimer that binds to barbed ends, ADF/cofilin, a small protein that promotes the disassembly of actin filaments, and tropomyosin, a helical coiled-coil protein that binds and stabilizes linear-actin filaments nucleated by formins (Moseley & Goode, 2006; Pollard, 2016).
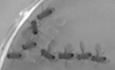
In addition to wild-type actin, we purified Act_N2 and Act_Ca from cultures of the corresponding yeast strains. We reconstituted in vitro, in a common experimental environment, branched- and linear-actin network assembly, respectively, from WASp- and formin-coated beads (Antkowiak et al, 2019). We used in these experiments a small fraction of Alexa-568-labeled rabbit muscle actin (1%), which integrates equally well to Act_N2 and Act_Ca actin filaments (Appendix Fig S4A and B). First, we assessed the capabilities of the different actin orthologs to assemble into such networks. Act_Ca assembled only into linear-actin networks (Fig 4A), providing explanation for the inability of Act_Ca cells to assemble actin patches. Act_N2 assembled both into branched- and linear-actin networks, although noticeably shorter but brighter Arp2/3 comet tails were observed for an overall similar amount of assembled actin, in striking similarity with what we have estimated for actin patches in N2 cells.

Figure 4. In vitro reconstitution of branched- and linear-actin networks assembly from purified actins
Standard conditions include Las17- (branched) and Bni1- (linear) coated beads, 8 µM F-actin assembled from different purified variants and 1% labeled with Alexa-568 rabbit muscle actin, 15 µM of profilin, 1 µM of capping protein, 500 nM of Arp2/3 complex and 600 nM of ADF/cofilin. Snapshots of representative actin networks were taken after 30 min. Scale bars: 6 µm.
(Top) Snapshots of actin networks assembled from three different actins sources: Act_Sc, Act_N2, and Act_Ca. (Bottom left) Quantification of actin fluorescence on beads. Data are presented as mean ± SD (n = 52 for Act_Sc branched, n = 70 for Act_N2 branched, n = 81 for Act_Ca branched, n = 32 for Act_Sc linear, n = 34 for Act_N2 linear and n = 47 for Act_Ca linear). **P < 0.01, ***P < 0.001 (Kruskal–Wallis test, with multiple comparisons). (Bottom right) In vitro actin network deviation indexes. (Left) Snapshots of representative actin networks assembled in the presence of 600 nM Alexa-488-labeled ADF/cofilin (replacement of unlabeled ADF/cofilin). (Right) Quantification of ADF/cofilin’s fluorescence intensity relative to actin. Data are presented as mean ± SD (n = 34 for Act_Sc branched, n = 28 for Act_N2 branched, n = 43 for Act_Ca branched, n = 24 for Act_Sc linear, n = 15 for Act_N2 linear and n = 27 for Act_Ca linear). ***P < 0.001 (Kruskal–Wallis test, with multiple comparisons). (Left) Snapshots of representative actin networks assembled in the presence 1 µM Alexa 488-tropomyosin. (Right) Quantification of tropomyosin’s fluorescence intensity relative to actin. Data are presented as mean ± SD (n = 45 for Act_Sc branched, n = 63 for Act_N2 branched, n = 57 for Act_Ca branched, n = 22 for Act_Sc linear, n = 32 for Act_N2 linear and n = 27 for Act_Ca linear). *P < 0.05, ***P < 0.001 (Brown–Forsythe and Welch ANOVA tests, with Dunnett’s T3 multiple comparisons tests).Data information: For all microscopy images, intensity levels were adapted for images of branched- and linear-actin networks separately as their brightness is different. To obtain a correct representation of the amount of ADF/cofilin and tropomyosin bound to the two networks, the intensity levels of ADF/cofilin and tropomyosin were matched similarly to those of the corresponding actin networks. Abbreviations: ns—nonsignificant, Act_Sc—purified S. cerevisiae actin, Act_N2—purified Node 2 actin, Act_Ca—purified C. albicans actin (for more details see Table EV1, Fig 1 and Appendix Fig S1B and C).
Source data are available online for this figure.
As this simplest protein system could not explain the impossibility of yeast to assemble cables from Act_N2, we hypothesized that an additional ABP, involved in the stabilization or disassembly of one of those actin networks, may bind abnormally to Act_N2. We labeled ADF/cofilin, which is known to promote branched-network disassembly by inducing Arp2/3 debranching while stabilizing linear networks (Michelot et al, 2007; Chan et al, 2009). ADF/cofilin bound to linear-actin networks with higher affinity than to the branched-actin networks (Fig 4B), as previously reported (Gressin et al, 2015). However, ADF/cofilin bound similarly to both actin variants, albeit with reduced affinity compared to wild-type actin (Fig 4B). We next labeled tropomyosin, which inhibits branched-network assembly and promotes linear-network stabilization (Appendix Fig S4C; Bernstein & Bamburg, 1982; Pruyne et al, 1998; Blanchoin et al, 2001; DesMarais et al, 2002; Antkowiak et al, 2019). Tropomyosin bound with higher efficiency to linear-actin networks, as expected (Fig 4C). Its binding to Act_Sc and Act_Ca was similar; however, tropomyosin was almost completely absent from actin networks assembled from Act_N2 (Fig 4C). This inability of tropomyosin to bind to Act_N2 provides a likely explanation for why actin patch assembly is favored in N2 cells.
Structural analysis provides plausible explanation of defective interactionsWe searched for a structural understanding of why Act_N2 and Act_Ca do not interact properly with specific ABPs of S. cerevisiae. Based on the structural information available of the interactions of actin with its binding partners, we identified actin residues that are within 5 Å at the actin–actin interface in a filament, or at the interface between G- or F-actin and the ABPs used in our biomimetic assay (Winn et al, 2011), with the exception of the Arp2/3 mother filament, which were within 10 Å since the coordinates were not released when this study was performed (Fäßler et al, 2020; Fig 5A).

Figure 5. ABPs interfaces with actin
Sequence alignment of three actins (Act_Sc, Act_N2, and Act_Ca; deep blue indicates conserved residues, light blue and white indicates nonconserved), indicating contacts between proteins used in the biomimetic assay (with Arp2/3 complex at the mother filament interface (M), with Arp2/3 complex at the daughter filaments interface (D), with tropomyosin (T), with WASP’s WH2 (W), with formin (F), with profilin (P), with ADF/cofilin (C), with capping protein (Z), at the protofilament interface (*) and laterally (^). Schematic representation of actin 3D structure (1YAG; Vorobiev et al, 2003). Color dots correspond to positions where Act_Sc has different residues compared to Act_N2 (red) and Act_Ca (blue). Purple dots correspond to positions where both Act_N2 and Act_Ca have different residues compared to Act_Sc.Data information: Abbreviations: Sc—S. cerevisiae, N2—Node 2, Ca—C. albicans (for more details, see Table EV1, Fig 1, and Appendix Fig S1B and C).
At protomer:protomer interfaces, wild-type actin differed by one residue (Val287Met) and two residues (Ala167Glu and Ser170Ala) relative to Act_Ca and Act_N2, respectively (Fig 5B). In particular, the Ala167Glu substitution has been shown to affect actin filament stiffness (Kang et al, 2012; Hocky et al, 2016; Scipion et al, 2018). Furthermore, four differences were observed in inter-strand c
留言 (0)