
記住我


Reactive oxygen species (ROS) can be toxic molecules. However, some ROS, such as H2O2 can also function as signaling molecules (Rhee, 1999; D'Autreaux & Toledano, 2007; Janssen-Heininger et al, 2008; Holmstrom & Finkel, 2014; Schieber & Chandel, 2014; Riemer et al, 2015; Milev et al, 2018; Brand, 2020; Sies & Jones, 2020; Winterbourn, 2020). Studies measuring H2O2 release from isolated mitochondria, as well as extracellular H2O2 in cell culture, have indicated that mitochondria are major sites of cellular H2O2 production (Klimova & Chandel, 2008; Murphy, 2009; Brand, 2010, 2016; Drose & Brandt, 2012; McManus et al, 2014; Diebold & Chandel, 2016; Wong et al, 2019). Unsurprisingly, elevated mitochondrial H2O2 levels have thus been reported to be important for the initiation of a wide range of physiological and pathological responses. Such responses include apoptosis, autophagy, cellular senescence, and HIF1α signaling, as well as roles in cell proliferation, migration, differentiation, and cell cycle progression (reviewed in, e.g., Chandel, 2014; Brand, 2020; Sies & Jones, 2020).
The mitochondrial respiratory chain and associated substrate dehydrogenases are the major generators of mitochondrial ROS, with respiratory chain complexes I and III the main sites (Murphy, 2009; Brand, 2010). Complex I and complex III activity is therefore presumably key for mediating the physiological and presumably pathological effects caused by mitochondrial ROS. Prominent examples linking ROS generation at these sites with physiological outcomes include hypoxia signaling, where the induction of complex III-dependent ROS generation through antimycin A treatment impacted upon cytosolic HIF1α stabilization (Klimova & Chandel, 2008), and ischemic reperfusion injury, where reverse electron flow through complex I and consequent ROS generation underlies the pathologic consequences (Chouchani et al, 2016; Martin et al, 2019). Complexes I and III release ROS to different sides of the mitochondrial inner membrane (IMM), complex I toward the matrix and complex III mainly toward the intermembrane space (IMS; Han et al, 2001; Brand, 2010). It should be noted that release of ROS from complex III to the matrix has also been reported (Muller et al, 2004). This spatial specificity of ROS generation and release has been confirmed by redox proteomics data on isolated mitochondria; when ROS production was induced by inhibitor treatment of complexes I and III, proteins that were oxidatively modified, localized mainly to matrix and IMS, respectively (Bleier et al, 2015).
The proximal ROS produced by the mitochondrial respiratory complexes are superoxide anions that are rapidly dismutated to H2O2 and oxygen either by superoxide dismutase 2 (SOD2) in the matrix or SOD1 in the IMS, depending on the site of their generation. H2O2, but not superoxide, can diffuse relatively slowly across the IMM, while porins/VDACs in the outer membrane (OMM) likely allow for an unimpeded diffusion, for example, into the cytosol. In the case of the IMM, it remains possible that transport might be facilitated by a yet unknown transporter(s) as have been found in other cellular membranes (Calamita et al, 2005; Bienert et al, 2007; Marchissio et al, 2012). Subcellular compartment-specific concentrations of H2O2 are set mainly by rates of production (activities of superoxide generator sites and SODs), removal through the activities of antioxidative enzyme systems (peroxiredoxins, catalases), diffusion of H2O2 into or out of the compartment of interest (for example, mitochondrial H2O2 release to the cytosol), or via reactions with biomolecules like proteins or lipids. Furthermore, site-specific generation of H2O2 combined with the presence of efficient scavenging systems, likely leads to the presence of steep H2O2 gradients even within specific subcellular compartments (Pak et al, 2020; Niemeyer et al, 2021). Therefore, in order to act as signaling molecule outside mitochondria, mitochondrial H2O2 would have to: (i) be produced in sufficient amounts to avoid being completely scavenged by local antioxidative systems or by side reactions with mitochondrial biomolecules; (ii) would have to navigate the complex morphology of mitochondria in order to reach the cytosol, including crossing one or two membranes; (iii) would have to react preferentially with putative cytosolic target proteins instead of being scavenged by the potent cytosolic H2O2 removal enzymes.
The dynamics of H2O2 inside mitochondria and of mitochondria H2O2 release is poorly understood in mammalian cells. Previous studies have relied on tools including matrix-targeted or untargeted small molecule chemical probes, for example Mito-SOX, or low sensitivity genetically encoded probes, for example, HyPer3 or roGFP2-Orp1. Small molecule chemical probes do not allow high resolution monitoring of extramitochondrial H2O2, are typically irreversible and thus do not permit monitoring of dynamic H2O2 changes, and can be affected by differential cellular uptake and efflux. Low sensitivity genetically encoded probes only respond to strong exogenous H2O2 treatments or are strongly influenced by redox changes in the glutathione pool, which is normally required for sensor reduction. Finally, H2O2 release has been assessed using isolated mitochondria or measurements of extracellular H2O2 (both as proxies for mitochondrial H2O2 release inside cells; Goncalves et al, 2015; Roma et al, 2018; Kalinovic et al, 2019; Liao et al, 2020; Plecita-Hlavata et al, 2020). Such measurements on isolated mitochondria necessarily ignore the role of cytosolic redox systems and thus fail to represent the cellular situation. Likewise, measurements outside cells with highly sensitive methods might detect concentrations well below the point of biological activity, but fail to directly report on mitochondrial H2O2 release and the local internal concentrations or gradients. Thus, although mitochondrial H2O2 appears to have important roles in many signaling or pathological phenotypes, in situ evidence for its release from mitochondria in intact cells and its subsequent dynamics in the cytosol remains scarce.
Recently, a highly-sensitive, pH-insensitive H2O2 sensor, HyPer7, was developed, which allows for dynamic measurement of highly localized changes in intracellular H2O2 concentration (Pak et al, 2020). Notably, experiments with HyPer7 cast doubt on the release of mitochondrial H2O2 into the cytosol (Pak et al, 2020) as no H2O2 release could be detected upon rotenone- or matrix-targeted D-amino acid oxidase-induced mitochondrial H2O2 generation. Only upon simultaneous inhibition of the cytosolic thioredoxin system, was an increase in H2O2 detected in the cytosol.
Here, we employed the HyPer7 sensor to revisit mitochondrial H2O2 release in a number of cell types. We demonstrate that in different settings, mitochondria do indeed release sufficient H2O2 to be detectable at the OMM and in the bulk cytosol. H2O2 release is strictly controlled by the metabolic state of the cell in a janus-faced manner: on the one hand, higher activity of the respiratory chain in cells grown on galactose increases H2O2 generation, on the other hand it also increases the level of cytosolic thioredoxin reductase to facilitate H2O2 removal. Intriguingly, we find that the H2O2 scavenging capacity of the cytosolic peroxiredoxins is limited and regulated by changes in thioredoxin reductase availability. Changes in thioredoxin reductase level underlie the increased cytosolic H2O2 scavenging capacity observed in galactose grown cells and can explain apparent cell-type differences in the amount of mitochondrial H2O2 detected in the cytosol. Our data thus suggest that the cytosolic peroxiredoxins, PRDX1 and PRDX2, have a “reserve capacity” and are present at a level in excess of their requirement for H2O2 scavenging. Our results point to a synchronized adaptation of cytosolic redox systems in response to changing metabolic states that influence mitochondrial H2O2 release, while still allowing direct H2O2 signaling in close proximity to mitochondria.
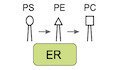
Results Antimycin A treatment induces cytosolic responses of HyPer7Little is known about the spatio-temporal organization of mitochondrial H2O2 release or removal in intact human cells. We made use of the genetically encoded fluorescent probe, HyPer7, which allows the real-time monitoring of basal H2O2 levels with unprecedented sensitivity in specific subcellular compartments (Pak et al, 2020; Fig 1A), to characterize mitochondrial H2O2 dynamics and release into the cytosol. HyPer7 comprises a circular permuted yellow fluorescent protein (cpYFP) genetically inserted into the OxyR regulatory domain (OxyR-RD) of Neisseria meningitis. The OxyR-RD moiety of the HyPer7 probe responds directly to H2O2 by forming a disulfide bond. This in turn induces a shift in the fluorescence excitation spectrum of cpYFP. While the probe is oxidized by H2O2, it is predominantly re-reduced by endogenous thioredoxins (Kritsiligkou et al, 2021). HyPer7 oxidation is therefore determined by rapid H2O2-driven oxidation and slower thioredoxin-driven reduction (Fig 1A; Pak et al, 2020). In our experimental setup, the readout of HyPer7 can be presented as ratio of fluorescence emission intensity following excitation at 469 and 390 nm. Such ratiometric measurements are automatically compensated against varying probe concentration (for data acquisition and analysis using a multi-well microscope setup, see Materials and Methods). An increase or decrease in the 469/390 ratio corresponds to an increased or decreased average probe oxidation, respectively. This was clearly visible when we monitored single cell responses of cytosolic HyPer7 in HEK293 cells to the repeated addition of exogenous H2O2 (Fig 1B). We observed that with H2O2 applied exogenously at a concentration as low as 2 µM, HyPer7 responded by becoming more oxidized, albeit with considerable cell-to-cell heterogeneity. To transparently report on this cell-to-cell heterogeneity that we observed in all our experiments with HyPer7, while still allowing for an easy assessment of the data, we present our data both as an average over many cells (Fig 1A and B, solid black line) and as single cell data (Fig 1A and B, light gray data points). Although HyPer7 is considerably more sensitive than previous H2O2 sensors, including roGFP2-Orp1 and HyPer3, it was still almost completely reduced under steady state conditions as DTT treatment did not cause a further reduction of the fluorescence excitation ratio of the sensor in the cytosol of HEK293 cells (Appendix Fig S1).

Figure 1. Antimycin A treatment induces responses of cytosolic HyPer7
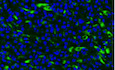
A. The H2O2 sensing mechanism of the HyPer7 probe and representation of data. B. The response of cytosolic HyPer7 in HEK293 cells to repeated bolus of exogenous H2O2 at the indicated concentrations. Solid line represents mean, light gray points are ratios measured in individual cells. C. Confirmation of sensor localization to different cellular compartments. Green, HyPer7; blue, DAPI stain. D–H. Response of HyPer7 probes targeted to indicated compartments to incubation with antimycin A (a complex III inhibitor, red curve, and data points) or ethanol as control (black line and data points). HEK293 cells were grown either with glucose or galactose as carbon source as indicated. Solid line represents mean, points colored in the lighter version of the respective color are the corresponding ratios measured in individual cells.Data information: The numbers of cells per experiment for each dataset can be found in Appendix Table S6. As most of the data were not normal distributed, instead of a t-test, a Wilcoxon/Mann–Whitney-U-test was performed and samples were compared in pairs. **P ≤ 0.01, ***P ≤ 0.001.
Source data are available online for this figure.
To obtain a better overview of subcellular H2O2 dynamics upon induction of mitochondrial H2O2 production, we also targeted HyPer7 to the mitochondrial matrix, IMS, the cytosolic side of the OMM, the plasma membrane (PM), and the nucleus (Fig 1C). We then monitored the Hyper7 responses in HEK293 cells upon treatment with antimycin A, a complex III inhibitor. Antimycin A causes release of superoxide anions (which are rapidly dismutated to H2O2) toward the IMS side of the IMM as well as likely also increasing superoxide production at complex I. We performed these experiments with cells grown in glucose or galactose (cells were adapted to galactose growth for at least one week) as the carbon source. Compared to glucose, galactose enhances oxidative metabolism and thus might be expected to generate more superoxide anions upon antimycin A treatment (Appendix Fig S2). In the IMS, we observed a small HyPer7 response that was more pronounced in cells grown on galactose than in cells grown on glucose (Fig 1D). Interestingly, matrix-targeted HyPer7 appeared to react even more strongly than its IMS counterpart, likely representing diffusion of H2O2 (or perhydroxyl radicals) over the IMM from the cristae space or partial direct release of ROS from complex III toward the matrix (Fig 1E). Similar to the IMS and matrix, we also observed a stronger response in cells grown on galactose for the OMM and cytosolic HyPer7 probes (Figs 1F and G). Notably, cytosolic HyPer7 reacted only to antimycin A treatment when cells were grown on galactose. However, no Hyper7 response was observed to antimycin A treatment in the nucleus or on the PM, in cells grown on galactose (Fig 1H). We could confirm these findings using the complex I inhibitor rotenone (Appendix Fig S3). Treatment with rotenone resulted in detectable HyPer7 responses in the cytosol if HEK293 cells were grown on galactose. In summary, antimycin A treatment resulted in detectable deflections of HyPer7 at the OMM and in the cytosol, but not in the nucleus or at the plasma membrane, a finding which supports the existence of a steep H2O2 concentration gradient emanating from the mitochondrial surface. HyPer7 responses in cells grown in galactose-containing medium were in general more pronounced, indicating that the H2O2 gradient is modulated by metabolic adaptations (e.g., differences in H2O2 generation).
Galactose-grown cells present stronger HyPer7 responses after hypoxia-reoxygenationGiven our observation of metabolic state-dependent detection of mitochondrial H2O2 in the cytosol, we asked whether we could confirm these findings in a more physiologically relevant situation, namely hypoxia-reoxygenation. To this end, we exposed cells to hypoxia for 200 min followed by reoxygenation or to continuous hypoxia. Reoxygenation should increase the generation of H2O2 particularly in mitochondria. During hypoxia, the absolute HyPer7 ratios in all compartments assessed were lower than in normoxic cells, but remained unchanged over an extended period indicating that hypoxia alone did not result in substantial H2O2 generation (Fig 2A–E, compare black line and red line before 200 min). Upon reoxygenation HyPer7 became more oxidized in all compartments assessed, particularly if cells had been grown in galactose-containing medium (Fig 2A–D). In cells maintained constantly in hypoxic conditions, HyPer7 ratios did not change (Fig 2A–E, black line).

Figure 2. Galactose-grown cells present with stronger HyPer7 responses upon reoxygenation after hypoxia
A–D. Response of HyPer7 probes targeted to indicated compartments to reoxygenation after hypoxia (red curve and data points) or to continued hypoxia (black line and data points). HEK293 cells were grown either with glucose or galactose as carbon source. Solid line represents mean, points colored in the lighter version of the respective color are the corresponding ratios measured in individual cells. E. Model. Cells grown on galactose-containing medium exhibit increased production of H2O2 and thus also increased detection of cytosolic H2O2 indicating H2O2 gradients of different steepness around mitochondria.Data information: The numbers of cells per experiment for each dataset can be found in Appendix Table S6. As most of the data were not normal distributed, instead of a t-test, a Wilcoxon/Mann–Whitney-U-test was performed and samples were compared in pairs. ***P ≤ 0.001.
Source data are available online for this figure.
Equal mitochondrial H2O2 generation results in detection of different cytosolic H2O2 amounts upon growth in the presence of different carbon sourcesThe amount of H2O2 generated by incubation of cells with antimycin A depends on the activity of the respiratory chain. We modulated electron flux through the respiratory chain by providing cells with different carbon sources. However, this also impacts many other cellular processes including the generation of NADPH, for example by modulating flux through the pentose phosphate pathway. To distinguish the effects of increased mitochondrial H2O2 production from general changes in other cellular processes in cells grown on galactose, we turned to a genetically engineered H2O2 producing system using matrix-targeted C-terminally FLAG-tagged D-amino acid oxidase (mtDAO, Fig 3A; Matlashov et al, 2014; Pak et al, 2020). Using the TRex-FlpIn system, we generated stable cell lines to ensure homogenous expression of mtDAO in all cells. Moreover, we employed a doxycycline-inducible mtDAO expression system to minimize adaptation effects that might result from a continuous expression of this enzyme. After 24 h induction of mtDAO expression and upon subsequent addition of D-alanine, but not L-alanine, mtDAO produced H2O2 in a dose-dependent manner in the mitochondrial matrix (Fig 3B).

Figure 3. Equal mitochondrial H2O2 generation results in detection of different cytosolic H2O2 amounts upon growth in the presence of different carbon sources
Mechanism of D-amino acid oxidase (DAO) in the production of H2O2. Cell lines stably and inducibly expressing a mitochondrial matrix version of DAO (mtDAO) were generated and tested by immunoblot and immunofluorescence. Titration of D-alanine (D-Ala) in mtDAO-containing cells and monitoring by matrix HyPer7 (cell generated with the Flp-In T-REX-system). Solid line represents average of multiple measure cells. For area under the curve (AUC) analyses, means of control curves were subtracted from means of D-Ala-treated cells. In the box plot, the central band is the median. The lower and upper hinges correspond to the first and third quartiles. The upper whisker extends from the hinge to the largest value no further than 1.5 times the inter-quartile range, whereas the lower whisker extends from the hinge to the smallest value no further than 1.5 times the inter-quartile range. The numbers of cells per experiment for each dataset can be found in Appendix Table S6. Response of HyPer7 probes targeted to indicated compartments to treatment of mtDAO-expressing HEK293 cells with 2 mM D-Ala (cells generated with the Flp-In T-REX-system). HEK293 cells were grown either with glucose (black curve and data points) or galactose (red curve and data points) as carbon source. Solid line represents average, points colored in the lighter version of the respective color are the corresponding ratios measured in individual cells.Data information: The numbers of cells per experiment for each dataset can be found in Appendix Table S6. As most of the data were not normally distributed, instead of a t-test, a Wilcoxon/Mann–Whitney-U-test was performed and samples were compared in pairs. ***P ≤ 0.001.
Source data are available online for this figure.
We then used this system to monitor HyPer7 responses in different compartments of cells grown on galactose- or glucose-containing medium (Fig 3C). We detected HyPer7 oxidation in all compartments upon addition of 2 mM of D-alanine demonstrating that in this controlled setting H2O2 is produced and released from mitochondria. The HyPer7 response in the matrix was similar between glucose and galactose-grown cells. Interestingly, the response of HyPer7 in the cytosol and the IMS was less pronounced in cells grown on galactose compared to growth on glucose, the opposite trend to that observed with antimycin A or re-oxygenation. Likewise, the response at the OMM was similarly independent of the growth medium, an observation that we currently cannot explain, as it also appears to differ from antimycin A and reoxygenation treatments. In the nucleus and on the PM, the HyPer7 probe only responded at 8 mM of D-alanine (Appendix Fig S4). Collectively, our data indicate that upon production of a defined quantity of H2O2 in the matrix the amount that is detected in the cytosol is reduced in cells grown on galactose compared to cells grown on glucose.
Growth in the presence of different carbon sources impacts compartmental H2O2 handlingWith our different treatment regimes, we obtained seemingly contradicting results: antimycin A treatment and reoxygenation after hypoxia induced a more prominent oxidation of cytosolic HyPer7 on galactose-grown compared to glucose-grown cells, while for mtDAO-induced H2O2 generation we observed the opposite. One explanation for these findings might be prior adaptation processes on galactose that strengthen cellular antioxidative systems and therefore H2O2 scavenging capacity. This might make biological sense as a mechanism to counteract the increased amounts of H2O2 produced as a consequence of increased flux through the respiratory chain. Antimycin A treatment would still lead to high H2O2 production that exceeds the capacity of the antioxidative systems, hence the stronger oxidation of HyPer7 with antimycin A on galactose. Conversely, the mtDAO system produces similar amounts of H2O2 on both glucose and galactose, but the more efficient antioxidative systems on galactose would attenuate the impact of its release. To further test this hypothesis, we exposed HEK293 cells to bolus treatments with exogenous H2O2. Indeed, in all compartments, the HyPer7 response was attenuated in cells grown on galactose compared to glucose (Fig 4A).

Figure 4. Growth in the presence of different carbon sources impacts compartmental H2O2 handling
Response of HyPer7 probes targeted to indicated compartments to treatment with increasing amounts of exogenous H2O2 (2, 4, and 8 µM of H2O2; 20 mM of DTT). HEK293 cells were grown either with glucose (black curve and data points) or galactose (red curve and data points) as carbon source. The numbers of cells per experiment for each dataset can be found in Appendix Table S6. As most of the data were not normal distributed, instead of a t-test, a Wilcoxon/Mann–Whitney-U-test was performed and samples were compared in pairs. ***P ≤ 0.001. Model. (Mitochondrial) H2O2 is more efficiently handled in galactose-grown cells in mitochondria and cytosol.Source data are available online for this figure.
Thus, in HEK293 cells, we demonstrate that different modes of mitochondrial H2O2 production (e.g., antimycin A, mtDAO) result in release of H2O2 from mitochondria. However, growth of cells on a carbon source that induces increased electron flux through the respiratory chain (galactose) also appears to upregulate anti-oxidant pathway(s) allowing cells to handle H2O2 more efficiently, and thus attenuates the consequences of mitochondrial H2O2 release (Fig 4B).
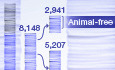
Increased activity of the cytosolic thioredoxin system reduces the impact of mitochondrial H2O2 release during increased activity of the respiratory chainWe next sought to determine the specific protein changes that are induced by cell growth on galactose relative to glucose by performing quantitative proteomics of HEK293 (Fig 5A, Dataset EV1). Expectedly, the amounts of many proteins differed between the two conditions; however, we only observed a significant difference in one protein that qualifies as an antioxidative enzyme. This was the cytosolic thioredoxin reductase 1, TXNRD1, which was increased about 2- to 2.5-fold in cells grown on galactose compared to glucose-grown cells. Notably, the levels of the cytosolic peroxiredoxins remained unchanged. We confirmed this result by immunoblotting against selected redox proteins (Fig 5B).

Figure 5. Increased activity of the cytosolic thioredoxin system limits mitochondrial H2O2 release during increased use of the respiratory chain
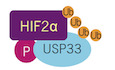
A. Protein levels in cells grown on glucose and galactose. Cell lysates were analyzed by quantitative mass spectrometry (n = 4 biological replicates, Dataset EV1). Levels of antioxidative enzymes (especially peroxiredoxins, PRDX in blue) are not changed except for cytosolic thioredoxin reductase (TXNRD1). B. Protein levels in cells grown on glucose and galactose. Cell lysates were analyzed by immunoblot (n = 2 biological replicates). Cytosolic thioredoxin reductase (TXNRD1) is increased by more than two-fold in cells grown on galactose compared to glucose-grown cells. The dotted line depicts 1, meaning no change in protein levels. C. Mechanisms of H2O2 degradation by peroxiredoxins. Auranofin inhibits thioredoxin reductase and thus the reductive half reaction in the detoxification of H2O2. Arrows indicate the “flux” of electrons. D, E. Response of HyPer7 (D) and roGFP2-scPrx1 (E) probes targeted to indicated compartments to treatment of mtDAO-expressing HEK293 cells with 2 mM of D-Ala (cells generated with the Flp-In T-REX-system). HEK293 cells were incubated either with 1 µM of auranofin (red curve and data points) or DMSO (black curve and data points). Solid line represents average, points colored in the lighter version of the respective color are the corresponding ratios measured in individual cells. The numbers of cells per experiment for each dataset can be found in Appendix Table S6. As most of the data were not normal distributed, instead of a t-test, a Wilcoxon/Mann–Whitney-U-test was performed and samples were compared in pairs. ***P ≤ 0.001. >Source data are available online for this figure.
We then tested the involvement of the thioredoxin system in regulating H2O2 dynamics. To this end, we inhibited thioredoxin reductase using auranofin (Fig 5C). Auranofin treatment strongly increased oxidation of the cytosolic HyPer7 sensor during mtDAO-induced H2O2 generation (Fig 5D). The thioredoxin system can affect measurements in two ways: first, by attenuating H2O2 levels in the cytosol, for example, by reduction of peroxiredoxin, and second, by accelerating the reducing half reaction of the HyPer7 sensor (Figs 1A and Fig 5D; (Pak et al, 2020)). To disentangle these contributions, we employed a different H2O2 sensor, roGFP2-ScPrx1, that we recently developed. Importantly, roGFP2-ScPrx1 is not reduced by the thioredoxin system but by the glutathione system instead (Calabrese et al, 2019; Kritsiligkou et al, 2021). It comprises a redox-sensitive green fluorescent protein (roGFP2; Dooley et al, 2004) genetically fused with the monothiol Prx1 from Saccharomyces cerevisiae (ScPrx1). The ScPrx1 moiety serves to efficiently transfer oxidative equivalents from H2O2 to roGFP2. This probe is predominantly reduced by endogenous GSH/glutaredoxins, which directly reduce the roGFP2 moiety and also ScPrx1 itself. RoGFP2-ScPrx1 oxidation is therefore determined by rapid H2O2-driven oxidation and slower GSH/glutaredoxin-driven reduction. Oxidation of this probe was also more pronounced upon auranofin treatment (Fig 5E) indicating that an increase in thioredoxin reductase 1 levels exerts its effect via lowering cytosolic H2O2 levels and to a lesser extent via changes in the efficiency of HyPer7 reduction.
Increased levels of cytosolic thioredoxin reductase in HeLa cells decrease mitochondrial H2O2 release to the cytosolOur data are in apparent contradiction to a recent study with HyPer7 that did not detect mitochondrial H2O2 release to the cytosol upon rotenone treatment and mtDAO-induced H2O2 generation (Mishina et al, 2019; Pak et al, 2020). Based on our data, we hypothesized that this is a consequence of constitutively higher levels of thioredoxin reductase in Hela cells compared to HEK293 cells. We confirmed that HeLa cells harbor higher levels of thioredoxin reductase compared to HEK293 cells (Fig 6A; Geiger et al, 2012), and also confirmed that there was no detectable H2O2 release in Hela cells, despite the fact that matrix HyPer7 becomes oxidized (Fig 6B). Likewise, H2O2 generation by mtDAO provoked cytosolic oxidation of HyPer7 only in HEK293, but not HeLa cells (Fig 6C). We additionally confirmed cell type-specific differences in antimycin A-induced H2O2 release by monitoring HyPer7 responses in COS-7 and 143B cells (Appendix Fig S5). We thereby found that COS-7 cells behaved similarly to HEK293 cells, and in 143B cells like in HeLa cells, we did not detect HyPer7 deflection in the cytosol upon antimycin A treatment.

Figure 6. Increased levels of cytosolic thioredoxin reductase in HeLa cells prevent mitochondrial H2O2 release to the cytosol
TXNRD1 levels in HeLa and HEK293 cells. Data are from Geiger et al (2012). Response of HyPer7 probes targeted to indicated compartments to incubation with antimycin A (AntA, red curve, and data points) or ethanol as control (black curve and data points). HeLa cells were grown with galactose as carbon source. Solid line represents average, points colored in the lighter version of the respective color are the corresponding ratios measured in individual cells. Response of HyPer7 probes targeted to indicated compartments to treatment of mtDAO-expressing HEK293 (black curve and data points; cell generated with the piggyBAC system) or HeLa (red curve and data points; cell generated with the piggyBAC system) cells with 8 mM of D-Ala. The cells were grown with glucose as carbon source. Solid line represents average, points colored in the lighter version of the respective color are the corresponding ratios measured in individual cells. Model. Cells- and metabolism-specific empowerment of the thioredoxin reductase system controlling H2O2 concentrations following mitochondrial release.Data information: The numbers of cells per experiment for each dataset can be found in Appendix Table S6. As most of the data were not normal distributed, instead of a t-test, a Wilcoxon/Mann–Whitney-U-test was performed and samples were compared in pairs. ***P ≤ 0.001.
Source data are available online for this figure.
Collectively, our data suggest that cytosolic thioredoxin reductase levels determine whether or not mitochondrial H2O2 can be detected by genetically encoded sensors measuring average H2O2 levels in the bulk cytosol. Furthermore, our data show that thioredoxin reductase levels can change dependent upon metabolic status and cell type and correlate with the level of mitochondrial H2O2 detectable in the cytosol (Fig 6D). However, additionally, as adaptation can also take place on a time scale of minutes, which is insufficient time for significant changes in thioredoxin reductase level we also expect that changes in the flux through different metabolic pathways plays an additional role (Appendix Fig S6).
Cytosolic peroxiredoxins cooperate in controlling mitochondrial hydrogen peroxide releaseUpon growth on galactose, HEK293 cells adapted by increasing the levels of cytosolic thioredoxin reductase. Since, the thioredoxin system drives reduction of peroxiredoxins after they reduced H2O2, this indicates that the reducing half-reaction during H2O2 detoxification by peroxiredoxins may limit H2O2 handling, rather than the levels of peroxiredoxins. Thus, we next assessed the importance of the cytosolic peroxiredoxins for modulating mitochondrial H2O2 release. To this end, we generated single knockouts of the cytosolic dithiol peroxiredoxins, PRDX1, and PRDX2 using CRISPR-Cas technology (Fig 7A and B). In these cells, when grown on glucose, levels of other antioxidant proteins remained unchanged, in particular the concentrations of the other cytosolic peroxiredoxin (Fig 7A and B). Steady state HyPer7 ratios were also essentially unchanged in both single knockout cell lines (Fig 7C). Mitochondrial production of H2O2 by antimycin A treatment or in cells stably and inducibly expressing mtDAO (in these cells, stable and inducible expression of mtDAO used the piggyBAC system) revealed almost no difference between either peroxiredoxin knockout line as compared to the wild type (Fig 7D and Appendix Fig S7). Only during bolus application of exogenous H2O2, did HyPer7 in the PRDX1 and PRDX2 knockout cells exhibit an increased oxidation compared to wild-type cells, especially in the matrix and cytosol (Fig 7E). Notably, stable and inducible expression of mtDAO with the piggyBAC system appeared to influence the HyPer7 steady state even in the absence of D-alanine (compare steady state = first 5 min between Fig 7D (mtDAO) and Fig 7E (no mtDAO). We did not observe this influence in HEK293 cells stably and inducibly expressing mtDAO using the Flp-In T-Rex system (compare to Fig 3C), and hypothesize that leaky expression in the piggyBAC system contributes to the increased HyPer7 steady state ratio.

Figure 7. Cytosolic peroxiredoxins cooperate in controlling mitochondrial H2O2 release
A, B. Peroxiredoxin levels in peroxiredoxin 1 (PRDX1 KO) and peroxiredoxin 2 (PRDX2 KO) knockout cells. The upper subpanel depicts the guides used to generated the KO cell lines. Lysates of the indicated cell lines grown in glucose-containing medium were analyzed by immunoblot (A) and quantitative proteomics (n = 4, technical replicates) (B). The right subpanel of B lists the identified proteins belonging to cellular antioxidative systems which are not altered for PRDX1 KO or PRDX2 KO, respectively. In both quantitative proteomics experiments, 4,403 proteins were detected in total. C. HyPer7 steady state ratios of the indicated cell lines. HyPer7 probes were targeted to the indicated compartments of the respective cell lines. The cells were grown in glucose-containing medium. The numbers of cells per experiment for each dataset can be found in Appendix Table S6. In the boxplot, the central band is the median. The lower and upper hinges correspond to the first and third quartiles. The upper whisker extends from the hinge to the largest value no further than 1.5 times the inter-quartile range, whereas the lower whisker extends from the hinge to the smallest value no further than 1.5 times the inter-quartile range. D. Response of HyPer7 probes targeted to indicated compartments to treatment of mtDAO-expressing cell lines with 4 mM of D-Ala (black, wild type; red, PRDX1 KO; blue, PRDX2 KO; cell generated with the piggyBAC system). The cells were grown in glucose-containing medium. Solid line represents average, points colored in the lighter version of the respective color are the corresponding ratios measured in individual cells. E. Response of HyPer7 probes targeted to indicated compartments to treatment with 25 µM of exogenous H2O2. Indicated cell lines (black, wild type; red, PRDX1 KO; blue, PRDX2 KO) were grown in glucose-containing medium. Solid line represents average, points colored in the lighter version of the respective color are the corresponding ratios measured in individual cells.Data information: The numbers of cells per experiment for each dataset can be found in Appendix Table S6. As most of the data were not normal distributed, instead of a t-test, a Wilcoxon/Mann–Whitney-U-test was performed and samples were compared in pairs. *P ≤ 0.05, **P ≤ 0.01, ***P ≤ 0.001.
Source data are available online for this figure.
Since HyPer7 steady state values were essentially unchanged between compartments and also the reactions to H2O2 were comparably small in the single knockout lines, we wondered whether PRDX1 and PRDX2 complemented for each other in the respective single knockouts. We thus generated a double knockout cell line lacking PRDX1 and PRDX2 (Figs 8A and B). Interestingly, even in this cell line the level of many other antioxidative redox enzymes remained unchanged. Conversely, the HyPer7 steady state ratio differed strongly from the wild type in all compartments assessed including the mitochondrial matrix (Fig 8C, Appendix Fig S1). When we exposed these cells to an external bolus of H2O2, we observed a strong deflection of HyPer7 in all compartments that appears to be limited by the dynamic range of the HyPer7 sensor (Fig 8D). HyPer7 in double knockout cells containing mtDAO was already at a highly oxidized steady state (without D-alanine addition) especially in the matrix and cytosol. Addition of D-alanine then led only to a minimal deflection because also here the sensor appeared to be limited by its dynamic range (Fig 8E).

Figure 8. Peroxiredoxin 1 and 2 double knockout cells are strongly impaired in handling of mitochondrial H2O2 releas
留言 (0)