
記住我


Of the 9746 registered clients, 46 with missing values were excluded, leaving 9700 (Supplemental Table 3 in Additional file 1). The overall median age was 32 [21–45] years; 880 (9.1%) and 549 (5.7%) clients were aged 0–15 and ≥ 65 years, respectively (Table 1). The duration of travel was known in 9190 (94.7%) clients, and the most common duration was > 181 days (35.8%), with the most common reason for travel overall being business (3930, 40.5%). By country, the US (1118 [11.5%]) was the most common destination, followed by Brazil (1001 [10.3%]), while Asia was the most common continent with 4008 (41.3%) clients.
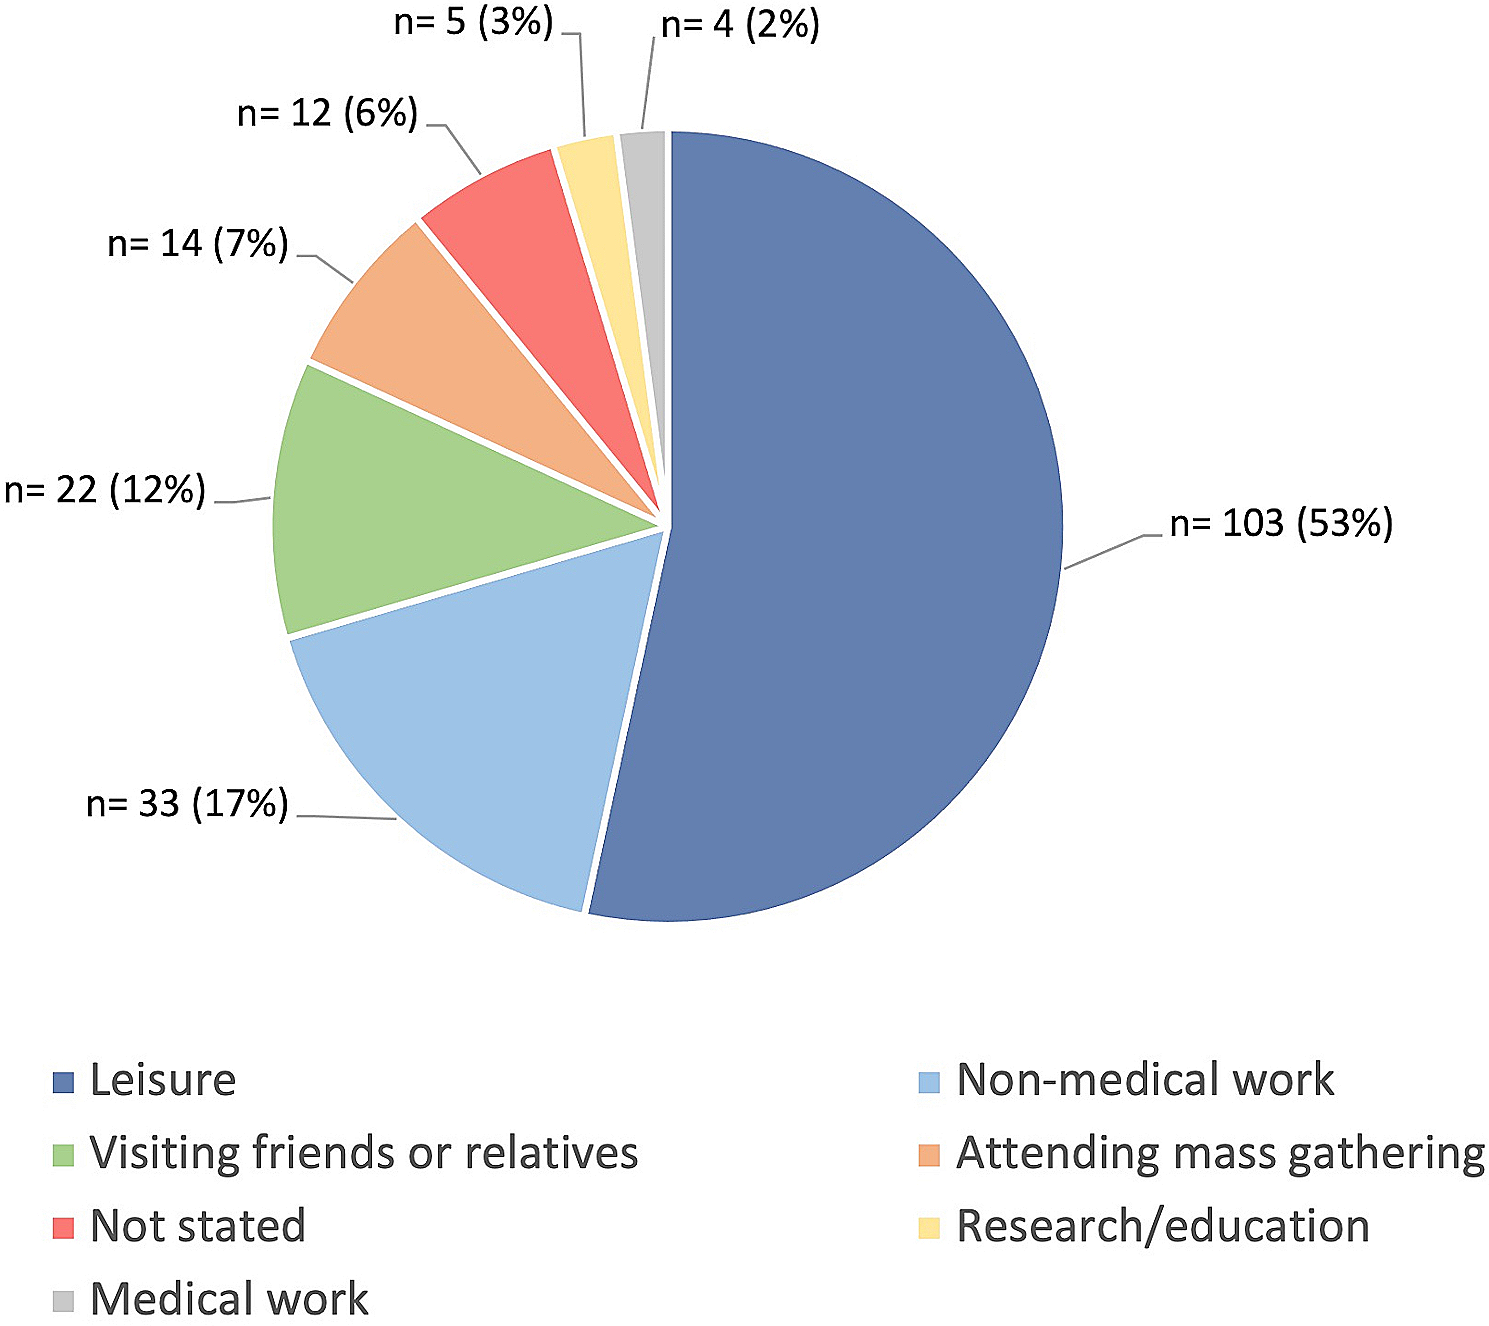
Table 1 Characteristics of the participants by age groupThe younger the age, the more likely they were to travel for longer than 181 days, with 74.9% of those aged 15 or younger traveling for longer periods. For those aged 15 and under, the most common reason for travel was to accompany family members (66.8%), followed by study abroad and school events (14.4%). However, more than half of the elderly (65 years old and over) traveled for two weeks or less, with the purpose of their trip being mainly sightseeing (65.6%), and more of them traveling in groups on package tours (36.6%) than those in any other age group.
Except for the YFV, the most common vaccines requested were against hepatitis A, rabies, tetanus, and hepatitis B (Table 2). Vaccines were required in 7793 clients (80.3%). Those traveling outside Asia, Africa, and Latin America, made more requests for vaccines against measles, rubella, meningococcal, and Tdap than those planning to travel to these regions. YFV was requested by 3014 clients. The proportion of YFV requests in those aged ≥65 years was higher (52.3%) than in those aged < 16 years (14.4%) and 16–64 years (31.4%). Altitude sickness and malaria prophylaxes were the most requested by travelers to Latin America (77.2%) and Africa (72.4%) (Table 2).
Table 2 Differences between the interventions that the participants wanted to use and the interventions that they actually used after the travel consultationsInterventionsFollowing the PTC, the median number of and most common vaccines planned were three (IQR, 1–4) per person. Several travelers to Asia were vaccinated against hepatitis A, hepatitis B, rabies, and typhoid (Supplementary Table 4 in Additional file 1). Of the 29,082 planned vaccines, 24.5% were unapproved in Japan. Of the unapproved vaccines, the most frequently used vaccines were the adjuvant-containing hepatitis A, typhoid fever, and rabies vaccines.
Overall, the number of planned vaccines after PTC increased compared to the required vaccines before PTC (P < 0.05), especially the vaccines containing measles and rubella, and diphtheria, tetanus, and pertussis (Table 2 and Supplementary Table 4 in Additional file 1). The number of planned meningococcal vaccine recipients was small; however, this showed a marked increase after consultation (Table 2). The numbers of rabies, hepatitis B, yellow fever, and Japanese encephalitis vaccines were generally similar between the planned and requested numbers. The YFV number of consultations was higher among the ≥65-year-olds than among the < 65-year-olds (60.1% vs. 35.3%, P < 0.001). The percentage of prescriptions for altitude sickness prophylaxis did not change significantly after the consultation. For malaria prophylaxis, there was a slight increase in those planning travels to Africa, and conversely, a decrease in those traveling to other regions.
Malaria prophylaxis or emergency standby treatment was recommended in 22.5% (2180/9700) of clients and in 34.8% (1821/5226) of those traveling for < 56 days; and especially in those who planned to travel to the African region (68.8%, 1429/2078). Among those traveling for < 56 days, two clients each had unknown prescription status and planned emergency standby treatment. Besides these, only 60.8% of those recommended for malaria prophylaxis received the prescriptions. The most common destination countries for which malaria prophylaxis was prescribed were Kenya, Tanzania, Uganda, and Ghana. However, even in countries with A high malaria risk (over 10 confirmed cases per 1000 populations), the prescription rate for those who received prophylaxis recommendations varied from 42.1 to 84.2% (Supplementary Table 5 in Additional file 1).
The most common advice that was given was for the use of rabies post-exposure prophylaxis (PEP), mosquito repellent use, and dietary precautions, all of which were common among travelers to Asia and Africa (Table 3).
Table 3 Advice given during consultations by region of travelQuality indicatorsThe GNI category, percentage of hepatitis a vaccination (HAV) planning, and dietary advice to prevent foodborne diseases (Fig. 1)These vaccines and advice were correlated weakly with each of the GNI categories respectively (ρ = 0.37, P < 0.01; ρ = 0.41, P < 0.01). These vaccines and advice tended to be considered when people were traveling to low or upper-middle-income countries. The width of interquartile range for hepatitis A vaccine coverage was 35.8, 32.0, 17.7, and 50.2, in the high, upper-middle, lower-middle, and low GNI categories, respectively, while food advice was 44.8, 50.6, 55.1, and 50.0, respectively. Compared to the advice on HAV, there was a greater difference in advice about eating and drinking among the facilities. The subgroup analysis according to the purpose of travel showed that overall, the median vaccination rates for upper-middle and lower-middle GNI categories were 86.9 and 88.6%, respectively, for travel for business, which were higher than those for tourism (66.9 and 72.7%, respectively). Although the low GNI category, on the contrary, had a low median vaccination rate of 37.5%, there were only four facilities in this category, and the range was highly variable, ranging from 0 to 87.5% (Supplementary Fig. 1 in Additional file 2).
Fig. 1
Country classification by income level and interventions implemented during pre-travel consultations by each collaborating hospital. The numbers in the legend correspond to the “Hospital number.”. A: The percentage of hepatitis A vaccine planning in clients without immunization histories of hepatitis A vaccines categorized by the gross national income (GNI). The risk categories, in order, from 1 to 4, are “high GNI: $12,536 or more”; “upper-middle GNI: $4,046 and $12,535”; “lower-middle GNI: $1,036 and $4,045”; and “low GNI: $1,035 or less.” Cases in which hepatitis A vaccine had been administered, with vaccination histories, were excluded. Of the 8204 patients included in the validation, data from 10 patients (one facility) were excluded because they could not be classified into a risk category. B: The advisory rate of dietary habits to avoid foodborne diseases categorized by the GNI. The risk categories, in order, from one to four, are “high GNI: $12,536 or more”; “upper-middle GNI: $4046 and $12,535”; “lower-middle GNI: $1036 and $4045”; and “low GNI: $1035 or less.” Of the 9658 patients included in the validation, data from 11 patients (one facility) were excluded because they could not be classified into a risk category. * Refer to the supplementary materials for the country names (ISO 3166-1 codes, Alpha-3 code) included
The risk category of rabies, the percentage of pre-exposure prophylaxis (PrEP) planning, and explaining post-exposure prophylaxis (PEP) (Fig. 2)As the rabies incidence rate increased, the percentage of explaining PEP increased for those that planned to travel to high-risk rabies countries (ρ = 0.30, P < 0.01). However, the percentage of explaining PEP was quite low in some facilities, as with the other advice. Furthermore, the rate of PrEP planning was not related to the incidence rate (P > 0.05). There was a tendency for the implementation rate to decrease in most facilities in countries with a slightly high risk of human rabies (0.6–1.5 deaths per 100,000 population), including African countries (such as Kenya and Tanzania), which had relatively large numbers of visitors from Japan. When analyzing the PrEP implementation in long-term travel, ≥181 days, the clients planning long-term travel had an overall higher median vaccination coverage ranging from 37.6–92.1% across all categories, compared to only 11.8–43.1% for travel < 181 days (Supplementary Fig. 2 in Additional file 2).
Fig. 2
Risk classification of rabies and interventions implemented during pre-travel consultations by each collaborated hospital. The numbers in the legend correspond to the “Hospital number.”. A: Percentage of rabies pre-exposure prophylaxis (PrEP) planning in clients without history of completed PrEP categorized by the risk of rabies. The risk categories, in order, from one to seven, are death rates due to human rabies per capita (per 100,000 persons): “less than 0.0024”; “0.0024 to less than 0.038”; “0.038 to less than 0.19”; 0.19 to less than 0.6″; “0.6 to less than 1.5”; “1.5 to less than 3.0”; and “3.0 or more.” Cases in which rabies PrEP had been administered, with a vaccination history, were excluded. Of the 8803 patients included in the validation, data from 136 patients (five facilities) were excluded because they could not be classified into a risk category. B: The rate of explaining post-exposure prophylaxis categorized by the risk of rabies. Risk categories were defined in the same way as in (C). Of the 9618 patients included in the validation, data from 145 patients (five facilities) were excluded because they could not be classified into a risk category. * Refer to the supplementary materials for the country names (ISO 3166-1 codes, Alpha-3 code) included
The risk category of typhoid fever and the percentage of typhoid fever vaccination planningBoth the percentage of typhoid fever vaccine planning and advice tended to increase in proportion to the incidence of typhoid fever (Ρ = 0.41, p < 0.01). Since the typhoid vaccine is unapproved in Japan, the vaccine planning rate was lower in facilities that did not handle unapproved vaccines. The analysis by the purpose of travel showed no difference in trends. However, in risk category 4, the median vaccination rates were 40.0 and 31.3% for travel for business and purposes other than for business and tourism, respectively, while the rate for travel for tourism was lower at 16.5% (Fig. 3 and Supplementary Fig. 3 in Additional file 2).
Fig. 3
Risk classification of typhoid fever and vaccinations administered during pre-travel consultations by each collaborated hospital. The numbers in the legend correspond to the “Hospital number.” Percentage of typhoid fever vaccination planning in clients without immunization history of typhoid fever vaccine within three years, categorized by the risk of typhoid fever. The risk categories, in order, from one to four, are the incidence of typhoid fever per 100,000 persons: “less than 20”; “20 to less than 50”; “50 to less than 100”; and “100 or more.” Cases in which typhoid fever vaccine within three years had been administered, with vaccination histories, were excluded. Of the 9333 patients included in the validation, data from 26 patients (two facilities) were excluded because they could not be classified into a risk category. * Refer to the supplementary materials for the country names (ISO 3166-1 codes, Alpha-3 code) included
Recommendations for prevention of mosquito-borne diseases and implementation of mosquito control adviceFor P. falciparum malaria, the higher the incidence in the destination country, the higher the rate of preventive medication prescription plans (Ρ = 0.66, p < 0.001). The percentage of advice on mosquito repellant use was not significantly higher for those traveling to high-risk countries according to the dengue fever risk category (P > 0.05). In the analysis by the purpose of travel, although the prescription rate was lower in the highest risk category 8, tourism purposes, there were no noticeable differences between travel purposes. Moreover, in this subgroup analysis, the number of facilities with a certain number (n ≥ 5) of travelers to high-risk category areas, was low (Fig. 4 and Supplementary Fig. 4 in Additional file 2).
Fig. 4
Risk classification of mosquito-borne diseases and interventions implemented during pre-travel consultations by each collaborated hospital. The numbers in the legend correspond to the “Hospital number.”. A: The prescription rate of malaria prophylaxis in clients traveling for < 56 days is categorized by the risk of falciparum malaria. The risk categories, in order, from one to eight, are the incidence of falciparum malaria per 1000 persons: “no risk”; “less than 0.1”; “0.1 to less than 1.0”; “1.0 to less than 10”; “10 to less than 50”; “50 to less than 100”; “100 to less than 250”; and “250 or more.” Of the 5124 patients included in the validation, data from 403 patients (eight facilities) were excluded because they could not be classified into a risk category. B: Implementation of mosquito control advice about mosquito repellant, categorized by the risk of dengue fever: The risk categories, in order, from zero to three, are classified according to the reference 12 dengue risk categories: “no or unknown risk”; “risk varies based on region”; “sporadic/uncertain”; and “frequent/continuous.”. * Refer to the supplementary materials for the country names (ISO 3166-1 codes, Alpha-3 code) included
The catch-up vaccination rate of measles-containing vaccines to the clients (with and without vaccination records) by ageFor those without immunization records, many facilities tended to immunize more clients in their 30s and 40s, with less natural immunity and who were likely to have been immunized once (Fig. 5A and B). For those with records, the catch-up immunization rate was relatively high among those in their teens compared to those in their 50s. However, regardless of vaccination histories, there were strong inter-institutional variations in the measles-containing vaccine coverage (Fig. 5C).
Fig. 5
Catch-up immunization rate of measles-containing vaccines by age group in each facility. The numbers in the legend correspond to the “Hospital number.” Data with no more than five applicable cases in each category were excluded from the figure without calculating the percentage. A: Catch-up immunization rates of measles-containing vaccines by age group among participants without vaccination records (4643 patients were included in the validation). B: Catch-up immunization rates of measles-containing vaccines by age group among participants with vaccination records who have received none or one measles-containing vaccine (2551 patients included in the validation). C: Association between catch-up immunization rates among participants without vaccination records and subjects with vaccination records that require catch-up measles-containing vaccines
留言 (0)