
記住我


The view that the lysosome is merely a degradation machinery has been challenged by recent studies demonstrating other critical roles for this organelle. Thus, lysosomes provide platforms for and coordinate energy sensing and regulation of various cell signaling pathways, for example, signaling via the mechanistic target of rapamycin complex 1 (mTORC1) (Nada et al, 2009; Sancak et al, 2010; Zhang et al, 2014). Emerging evidence also indicates that the late endosomal-lysosomal system (referred to as lysosomes for simplicity hereafter) serves as an important intracellular Ca2+ store with multiple channels/transporters, which regulate Ca2+ release and refilling (Morgan et al, 2011; Xu & Ren, 2015). Lysosomal Ca2+ release is required for diverse physiological functions, including lysosomal motility (Li et al, 2016) and exocytosis (Medina et al, 2011; Samie et al, 2013; Park et al, 2016), phagocytosis (Davis et al, 2020), and autophagy (Medina et al, 2015). It has recently been shown that neuronal activity recruits lysosomes into dendritic spines (Goo et al, 2017), and triggers lysosomal Ca2+ release, which contributes to spine plasticity in hippocampal pyramidal neurons (Padamsey et al, 2017). However, research on lysosomal Ca2+ release-mediated signaling in neurons is still in its infancy and its regulation is largely unknown.
The transient receptor potential mucolipin 1 (TRPML1) channel mediates lysosomal Ca2+ release, and mutations of this channel lead to the lysosomal storage disorder, mucolipidosis type IV (MLIV), which is characterized by severe intellectual disability, motor and speech deficits, and progressive visual impairment (Misko et al, 2021). TRPML1 activity is regulated by pH (Raychowdhury et al, 2004), and its response to its endogenous agonist, PI(3,5)P2, differs in lysosomes localized in perinuclear vs. peripheral areas of the cell (Dong et al, 2010; Zhang et al, 2012). In non-neuronal cells, PI(3,5)P2-induced TRPML1 activation promotes Ca2+-dependent centripetal lysosomal trafficking in an ALG-2-dynein-dependent manner (Li et al, 2016). In hippocampal neurons, dynein drives cargo transport from soma into proximal dendrites, bidirectionally steered by mixed polarized microtubules (Kapitein et al, 2010). These findings have suggested that the TRPML1-dynein machinery could play an important role in dendritic lysosomal trafficking.
The lysosome-localized Ragulator complex interacts with the BLOC-1-related complex (BORC), thereby regulating lysosome trafficking in nonneuronal cells (Filipek et al, 2017; Pu et al, 2017). The Ragulator complex consists of LAMTOR1 (aka p18), LAMTOR2 (p14), LAMTOR3 (MP1), LAMTOR4 (C7orf59), and LAMTOR5 (HBXIP), and plays a critical role in lysosomal recruiting and activation of mTORC1 (Nada et al, 2009; Sancak et al, 2010; Bar-Peled et al, 2012). BORC promotes kinesin-dependent lysosome centrifugal trafficking, which is inhibited by the Ragulator, independently of mTOR. In neurons, the BORC-kinesin mechanism specifically drives lysosome transport into axons but not dendrites (Farias et al, 2017). Very little is known regarding the roles of the Ragulator in lysosome trafficking in dendrites. The present study investigated the mechanisms underlying Ragulator-mediated regulation of lysosomal trafficking in dendrites of hippocampal neurons and their functional implications. The results indicate that LAMTOR1 regulates lysosomal trafficking and GluA1 dephosphorylation and degradation by tonically inhibiting lysosomal Ca2+ release through direct TRPML1 interaction and independently of mTORC1. Moreover, this mechanism plays a critical role in synaptic plasticity and learning and memory.
Results LAMTOR1 regulates lysosomal trafficking in dendrites of hippocampal neuronsTo examine lysosomal trafficking in neurons, cultured hippocampal neurons were incubated with LysoTracker, which preferentially labels lysosomal compartments (Chazotte, 2011). LysoTracker-labeled puncta were distributed throughout dendritic arbors and in some dendritic spines (Figs 1A and EV1A). LysoTracker fluorescence was mostly abolished by incubation with glycyl-L-phenylalanine 2-naphthylamide (GPN; 40 µM, 5–10 min), a compound widely used to produce osmotic lysis of lysosomal compartments (Padamsey et al, 2017) (Fig 1A).

Figure 1. LAMTOR1 regulates lysosomal trafficking in dendrites of hippocampal neurons
A. Disruption of lysosomes with GPN abolished LysoTracker staining (red) in GFP-expressing hippocampal neurons. Scale bar, 20 µm. B. Upper panels: Kymographs of LysoTracker-labeled lysosomes in the proximal dendrites of neurons infected with scrambled shRNA (shSc), LAMTOR1 shRNA (shLAMTOR1), or LAMTOR1 shRNA and RNAi-resistant LAMTOR1 (rLAMTOR1). Stationary, anterograde, and retrograde traces generated using the KymoGraphClear plugin for ImageJ were coded blue, red, and green, respectively. Lower panels: Tracks of mobile lysosomes. Scale bar, 5 µm. C. Quantitative analysis of lysosomal movement from kymographs. Results were expressed as percent of total lysosomes (N = 44, 49, and 16 neurons for shSc, shLAMTOR1, and shLAMTOR+rLAMTOR1 respectively from 3 to 10 independent experiments). D, E. Quantification of track speed (D) and displacement length (E) of lysosomes with low (0–1,000 arbitrary unit) and high (> 1,000) intensity of LysoTracker (dashed line, median; thin dashed line, quartiles; same length dendrites for each group from 3 independent experiments were analyzed). F, G. FRAP analysis of dendritic lysosome movement. (F) Representative images of neurons at 0 and 4 min after photobleaching. Photobleached regions are indicated by the cyan and red lines, and lysosomes traveling anterogradely (crossing cyan line first) or retrogradely (crossing red line first) are labeled cyan and red, respectively. (G) Quantitative analysis for (F) (N = 7, 7, and 9 neurons for shSc, shLAMTOR1, and shLAMTOR+rLAMTOR1, respectively, from 3 independent experiments). H. Left: Kymographs of Magic Red cathepsin B substrate-labeled degradative lysosomes in the proximal dendrites of neurons infected with shSc and shLAMTOR1. Scale bar, 5 µm. Right: Quantitative analysis of vesicular movement from kymographs (N = 16 neurons from 3 independent experiments).Data information: Data with error bars are represented as means ± SEM. Statistical significance was assessed by two-way ANOVA with Tukey’s (C), Dunnett’s post-test (D, E, G), or Mann–Whitney U test (H). *P < 0.05, **P < 0.01, ***P < 0.001, as compared to shSc; #P < 0.05, ###P < 0.001, as compared to shLAMTOR1 (C-E, G); n.s., not significant. See also Fig EV1 and Appendix Fig S1.
Source data are available online for this figure.
Click here to expand this figure.
Figure EV1. shRNA-resistant LAMTOR1 reversed the effects of LAMTOR1 KD on lysosome trafficking in hippocampal neurons. Related to Fig
A. LysoTracker (red) live imaging in GFP-positive hippocampal neurons. Insets: enlarged dendrites. Arrowheads indicate LysoTracker-labeled puncta in spines. Scale bar: left, 20 µm; inset, 10 µm. B. Western blot analysis using anti-LAMTOR1 and GAPDH antibodies of lysates from MEFs transfected with scrambled shRNA (shSc) or LAMTOR1 shRNA (shLAMTOR1) with or without shRNA-resistant LAMTOR1 (rLAMTOR1). C. Images of cultured hippocampal neurons immunostained for LAMTOR1 (red). Neurons were infected with shRNA AAV directed against LAMTOR1 with GFP co-expression or scrambled shRNA control with or without shRNA-resistant LAMTOR1 before processing for immunofluorescence assay and imaging. Scale bar, 20 µm. D, E. Shown is the scatter plot of the track speed (D) and track displacement length (E) of individual mobile lysosomes versus its mean fluorescent intensity of LysoTracker. F. Cumulative number of LysoTracker-labeled mobile vesicles exhibiting the binned intensity values for different experimental groups (note that the stationary vesicles are not included). G. Effects of LAMTOR1 KD on the movement of LAMP1-YFP-positive vesicles. Left: Images of LAMP1-YFP in dendrites (upper) and their kymographs (lower) from neurons transfected with either control siRNA (siControl) or LAMTOR1 siRNA (siLAMTOR1). Scale bar, 5 µm. Right: Quantitative analysis of vesicular movement from kymographs (N = 16 neurons from 3 independent experiments).Data information: Data with error bars are represented as means ± SEM. Statistical significance was assessed by Kolmogorov-Smirnov test (F) and Mann-Whitney U test (G). *P < 0.05 as compared to siControl, **P < 0.01 as compared to shSc, #P < 0.05, as compared to shLAMTOR1.
Source data are available online for this figure.
To investigate whether the Ragulator, and in particular LAMTOR1, could regulate lysosomal trafficking in dendrites, we used AAV-mediated shRNA knock-down (KD) of LAMTOR1. Hippocampal neurons were transduced at day 7 in vitro (DIV7) with LAMTOR1 shRNA or scrambled shRNA and were tested 14 days later (the same protocol was used for the following experiments unless otherwise indicated). Live-cell imaging of lysosomes loaded with LysoTracker (Movies EV1–EV3) in scrambled shRNA-infected neurons showed that the percentage of mobile lysosomes (assessed by kymographs, Fig 1B, top panels and Appendix Fig S1A and B) in dendritic shafts was 42.4 ± 2.3% with 17.5 ± 1.3% and 24.9 ± 1.8% moving in anterograde and retrograde directions, respectively (Fig 1C). LAMTOR1 KD significantly increased the overall percentage of mobile lysosomes to 75.4 ± 1.4%, with increased trafficking in both directions (Fig 1C), even though the total number of lysosomes was also increased (Appendix Fig S1C). Co-expressing shRNA-resistant LAMTOR1 in neurons (Fig EV1B and C) prevented LAMTOR1 shRNA-induced increase in lysosomal trafficking, confirming that the effect was due to LAMTOR1 KD (Fig 1B and C). Further analysis of velocities and traveled distances of mobile lysosomes based on their moving tracks (Fig 1B, bottom panels) showed that LAMTOR1 KD significantly and selectively increased the speed and travel distance of those with higher fluorescent intensity (Fig 1D and E), which correlates with higher acidity (Chakraborty et al, 2017; Hata et al, 2018). These effects were reversed by co-expression with shRNA-resistant LAMTOR1 (Figs 1D and E and EV1D–F).
We next analyzed the directional movement of lysosomes using fluorescence recovery after photobleaching (FRAP). In scrambled shRNA-infected neurons, equal numbers of lysosomes traveled retrogradely or anterogradely (Fig 1F and G). LAMTOR1 KD resulted in a significant increase in both anterograde and retrograde transport of lysosomes, and this increase was reversed by co-expression of shRNA-resistant LAMTOR1 (Fig 1F and G).
To analyze lysosome-mediated degradation, we incubated neurons with Magic Red cathepsin B fluorogenic substrates, which become fluorescent upon cathepsin B-mediated cleavage (Farfel-Becker et al, 2019). Live imaging revealed the presence of lysosomes containing active cathepsin B along dendrites (Movies EV4–EV5). In the dendritic shafts of scrambled shRNA-infected neurons, the majority of degradative lysosomes were stationary with only 10.9 ± 1.8% and 14.8 ± 2.5% moving in anterograde and retrograde directions, respectively (Fig 1H). LAMTOR1 KD significantly increased the overall percentage of mobile degradative lysosomes from 25.7 ± 2.6% to 53.2 ± 3.3%, with increased trafficking in both directions (Fig 1H).
To confirm the effect of LAMTOR1 KD on lysosome motility, we used LAMP1-YFP (transfected at DIV7) to label lysosomes in cultured hippocampal neurons transfected with Accell control or LAMTOR1 siRNA (at DIV4), and lysosomal trafficking was recorded at DIV8. Trafficking of LAMP1-YFP-labeled lysosomes was also significantly enhanced by LAMTOR1 KD (Fig EV1G).
LAMTOR1 regulation of dendritic lysosomal trafficking depends on the integrity of the Ragulator but not on mTORC1We next determined whether knocking down other Ragulator members could also change lysosomal trafficking in cultured hippocampal neurons. LAMTOR2 KD also increased lysosomal mobility, similarly to LAMTOR1 KD (Fig 2A and B). As previously reported (Scheffler et al, 2014), LAMTOR2 KD resulted in down-regulation of other members of the Ragulator, that is, LAMTOR4 and LAMTOR1 (Appendix Fig S2A and D). We then tested whether the ability of the Ragulator to control lysosomal trafficking depended on mTORC1. AAV-mediated shRNA KD of Raptor, an essential component of mTORC1, reduced lysosomal mTOR localization (Appendix Fig S2B and C), as previously reported in Hela cells (Pu et al, 2017). However, Raptor KD did not alter dendritic lysosomal mobility in neurons (Fig 2A and B), although both LAMTOR1 KD and Raptor KD reduced the phosphorylation of S6K1 and S6, which are downstream mTORC1 signaling proteins (Hay & Sonenberg, 2004). LAMTOR2 KD increased mTORC1 signaling (Appendix Fig S2D), an effect similar to that reported in LAMTOR2-deficient dendritic cells (Scheffler et al, 2014). FRAP results further confirmed that Raptor KD had no effect on either anterograde or retrograde transport of lysosomes (Fig 2C and D). Furthermore, treatment with an inhibitor of mTOR, Torin 1 (250 nM), for 2.5 h had no effect on dendritic lysosomal trafficking (Appendix Fig S2E and F). These results indicate that lysosomal trafficking in dendrites of hippocampal neurons is regulated by the Ragulator but not by mTORC1.

Figure 2. LAMTOR1 regulates dendritic lysosome trafficking independently of mTORC1
A. Representative kymographs of LysoTracker-labeled lysosomes in proximal dendrites of hippocampal neurons infected with scrambled shRNA (shSc), LAMTOR2 shRNA (shLAMTOR2), or Raptor shRNA (shRaptor). Scale bar, 5 µm. B. Quantitative analysis of lysosomal movement from kymographs (N = 44, 24, and 19 neurons for shSc, shLAMTOR2, and shRaptor, respectively, from 3 to 10 independent experiments). C, D. FRAP analysis of dendritic lysosomal movement in Raptor KD neurons. (C) Representative images of a neuron at 0 and 4 min after photobleaching. (D) Quantification of the lysosomes in (C) undergoing retrograde (red) or anterograde (cyan) transport (N = 7 and 8 neurons for shSc and shRaptor, respectively, from 3 independent experiments). E. LAMTOR1 KD did not affect trafficking of vesicles labeled with Alexa 594-conjugated transferrin (red, Tf 594) in dendrites. Shown are dendritic segments (upper) and kymographs (lower). Scale bar, 5 µm. F. Quantitative analysis of vesicular movement from kymographs (N = 10 neurons from 3 independent experiments).Data information: Data with error bars are represented as means ± SEM. Statistical significance was assessed by two-way ANOVA with Sidak’s post-test (B) and Mann–Whitney U test (D, F). ***P < 0.001 as compared to shSc; n.s., not significant. See also Appendix Fig S2.
Source data are available online for this figure.
To investigate whether LAMTOR1 KD could affect other endocytic organelle trafficking in dendrites, we incubated cultured hippocampal neurons with Alexa 594-conjugated transferrin, which labels early and recycling endosomes (Mayle et al, 2012). Live-cell imaging showed that the movement of transferrin-labeled endosomes was comparable in scrambled and LAMTOR1 shRNA-infected neurons (Fig 2E and F), supporting a specific effect of LAMTOR KD on lysosomal trafficking.
LAMTOR1 KD-induced changes in lysosomal trafficking require TRMPL1-mediated Ca2+ release and dynein activationWe next determined the potential mechanism underlying LAMTOR1 KD-induced increase in lysosomal mobility. In cultured rat hippocampal neurons, BORC has been shown to play an important role in regulating lysosomal trafficking; it specifically drives lysosomes into axons but not dendrites (Farias et al, 2017). We examined the effect of Accell siRNA-mediated KD of lyspersin, which has been shown to be the linker between BORC and Ragulator (Filipek et al, 2017; Pu et al, 2017), on dendritic lysosomal trafficking in control and LAMTOR1 KD neurons. The results showed that lyspersin KD had no obvious effects on lysosome trafficking in dendrites of either control or LAMTOR1 KD neurons (Fig 3A and Appendix Fig S3), suggesting that the BORC complex is unlikely to play a major role in LAMTOR1-mediated regulation of lysosomal motility in neuronal dendrites.

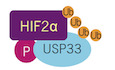
Figure 3. LAMTOR1 KD-induced changes in lysosomal trafficking require TRMPL1-mediated Ca2+ release and dynein activation
A. Quantification of the percent of lysosomes moving in the anterograde or retrograde direction in neurons infected with AAV expressing either LAMTOR1 shRNA (shLAMTOR1) or scrambled shRNA (shSc) and Accell lyspersin siRNA or control siRNA. Neurons were imaged with LysoTracker to visualize lysosomal trafficking in dendrites. N = 17–31 neurons from 3 to 6 independent experiments. B. Targets of pharmacological reagents and genetic manipulation used in this study. Blue text box, TRPML1 inhibition including TRPML1 inhibitor ML-SI1, TRPML1 siRNA, and dynein inhibitor ciliobrevin D (CilioD); red text box, TRPML1 activation induced by TRPML1 activator ML-SA1. Dash line separates the lysosome into lysosomes under control and LAMTOR1 (LT1) KD conditions. C–F. Quantification of the percent of lysosomes moving in the anterograde or retrograde direction. (C, E, F) Cultured hippocampal neurons were infected with AAV expressing either shLAMTOR1 or shSc; they were treated with vehicle control or ML-SI1 (20 µM, C, n = 16–49 neurons from 3 to 10 independent experiments), or ML-SA1 (20 µM, E, n = 13–49 neurons from 3 to 10 independent experiments), or CilioD (20 µM, F, n = 12–49 neurons from 3 to 10 independent experiments), and imaged with LysoTracker to visualize lysosomal trafficking in dendrites. Note that the data of shSc and shLAMTOR1 in (C, E, and F) are the same as shown in Fig 1C. (D) Neurons were infected with shLAMTOR1 or shSc AAV and Accell TRPML1 siRNA or control siRNA; they were imaged as described above. N = 7–31 neurons from 3 to 6 independent experiments. Note that the data of shSc/Accell siControl and shLAMTOR1/Accell siControl in (D) are the same as shown in (A).Data information: Data with error bars are represented as means ± SEM. ***P < 0.001 compared with shSc or shSc/Accell siControl; ##P < 0.01, ###P < 0.001 compared with shLAMTOR1 or shLAMTOR1/Accell siControl; &&P < 0.01, &&&P < 0.001 compared with shSc/Accell siLyspersin; n.s., not significant; two-way ANOVA with Tukey’s post-test. See also Appendix Fig S3.
Source data are available online for this figure.
TRPML-1-mediated Ca2+ release has been shown to regulate retrograde lysosomal transport through ALG-2 and the recruiting of the motor protein dynein (Li et al, 2016). To determine whether TRPML-1-mediated Ca2+ release could contribute to LAMTOR1 KD-induced changes in lysosomal trafficking, we used both pharmacological and genetic strategies (Fig 3B). Treatment with an inhibitor of TRPML1, ML-SI1 (20 µM), for 2 h blocked LAMTOR1 KD-induced changes in lysosomal trafficking (Fig 3C and Appendix Fig S3). Similarly, Accell siRNA-mediated TRPML1 KD reversed LAMTOR1 KD-induced changes (Fig 3D and Appendix Fig S3). On the other hand, direct activation of TRPML1 with ML-SA1 (20 µM, 1.5 h) in scrambled shRNA-treated neurons increased both anterograde and retrograde lysosome trafficking (Fig 3E and Appendix Fig S3). ML-SA1 treatment did not further increase lysosomal trafficking in LAMTOR1 KD neurons (Fig 3E and Appendix Fig S3).
To determine whether dynein was involved, we treated neurons with the dynein inhibitor ciliobrevin D (20 μM, 1.5 h); the low concentration of ciliobrevin D (Firestone et al, 2012) was chosen to selectively disrupt dynein-dependent cargo trafficking without affecting microtubule organization in dendrites as previously reported (Ayloo et al, 2017). Inhibition of dynein in LAMTOR1 KD neurons reduced both the retrograde and anterograde movement of lysosomes (Fig 3F and Appendix Fig S3), suggesting that dynein participates in bidirectional lysosomal trafficking in dendrites. This conclusion is consistent with the observation that the percentage of inward and outward oriented microtubules in dendritic shafts is similar (Baas et al, 1988; Tas et al, 2017). Ciliobrevin D treatment had no significant effect in scrambled shRNA-transfected neurons (Fig 3F and Appendix Fig S3). These data support our proposed model (Fig 3B) in which TRPML1-mediated Ca2+ release plays an important role in dynein-mediated lysosomal trafficking in dendrites and the activity of TRPML1 is tonically and negatively regulated by LAMTOR1.
LAMTOR1 directly interacts with TRPML1 and regulates its functionTo understand how LAMTOR1 could regulate the activity of TRPML1, we analyzed interactions between LAMTOR1 and TRPML1 by first performing co-immunoprecipitation (co-IP) experiments in Hela cells transfected with TRPML1-YFP and LAMTOR1-Flag. Structural studies of the Ragulator have revealed that, while the central region of LAMTOR1 wraps around two roadblock heterodimers, LAMTOR2-LAMTOR3 and LAMTOR4-LAMTOR5, its N- and C-terminal regions are disordered and more flexible (de Araujo et al, 2017; Yonehara et al, 2017). We therefore targeted these two regions for potential interaction sites with TRPML1, and prepared constructs with deletions of either the N- (residues 20 to 60) or C-terminal (residues 144 to 161) domains of LAMTOR1 (Fig 4A). Prominent Flag-immunopositive bands were clearly present in anti-GFP (which recognizes YFP) pull-down products (Fig 4B; see Appendix Fig S4A for negative control). Similarly, GFP-immunopositive proteins were clearly pulled down by an anti-Flag antibody (Fig 4C; see Appendix Fig S4B for negative control). Co-IP results also showed that deletion of the N- but not the C-terminal domain significantly reduced LAMTOR1–TRPML1 interactions (Fig 4B and C and F). We next prepared two constructs with smaller deletions of the N-terminal (residues 20–31 or 42–60) domain (Fig 4A). Deletion of residues 20–31 but not residues 42–60 significantly decreased LAMTOR1–TRPML1 interactions (Fig 4D and F). We also engineered LAMTOR1 proteins with K20 and K31 to arginine substitution (K20R and K31R, Fig 4A), two potential ubiquitination sites (Wagner et al, 2011), and protein ubiquitination has been reported to be involved in endosomal trafficking (Jongsma et al, 2016). Co-IP results indicated that both K20R and K31R mutations significantly reduced LAMTOR1–TRPML1 interactions, with K31R having the largest effect (Fig 4E and F). Immunostaining analysis confirmed that these mutations did not affect LAMTOR1 lysosomal localization or colocalization with TRPML1 (Fig EV2A–D). In addition, we performed co-IP of TRPML1 and LAMTOR1 in starved Hela cells. The result showed that starvation did not affect the LAMTOR1–TRPML1 interaction (Fig 4E and F). Using the Wes capillary electrophoresis protein detection system, we verified the interaction between endogenous LAMTOR1 and TRPML1 in mouse hippocampal tissues by co-IP (Fig 5A; validation of the TRPML1 antibody is shown in Appendix Fig S5A and B). Since residues 20–31 of LAMTOR1 are important for its interaction with TRPML1, we designed a peptide containing this sequence with the TAT peptide added to its N-terminal end (TAT-2031) to allow for its efficient delivery across cell membranes or the blood-brain barrier. We first tested whether this peptide could disrupt the interaction between LAMTOR1 and TRPML1 in vivo. Mice were injected with either control TAT or TAT-2031 (i.p., 50 mg/kg), and hippocampi were collected 2 h later. Co-IP experiments showed that LAMTOR1–TRPML1 interaction was significantly reduced in TAT-2031-treated mice, as compared to TAT-treated mice (Fig 5A and B). Furthermore, intact-cell cross-linking of fresh brain tissues using the chemical cross-linker dithiobis-(succinimidyl propionate) (DSP, see methods in Appendix for details) combined with co-IP experiments confirmed the results (Appendix Fig S5C and D). We also performed a proximity ligation assay (PLA), which is an unbiased method to detect protein–protein interactions in hippocampal slices. A clear interaction between LAMTOR1 and TRPML1 was observed (Fig 5C), but not when the primary antibody was omitted (negative controls, Appendix Fig S5E). Of note, there was no interaction detected between LAMTOR4 and TRPML1 (Appendix Fig S5E). Consistent with the co-IP results, TAT-2031 treatment significantly reduced the interaction between LAMTOR1 and TRPML1 (Fig 5C and D). However, TAT-2031 did not affect the interaction between LAMTOR1 and other members of the Ragulator, nor did it affect mTOR activation, as assessed by phosphorylation of S6K1 and S6 (Fig EV2E and F). Finally, treatment with TAT-2031 (10 µM, 2 h) increased lysosomal mobility in neurons transfected with scrambled shRNA but not with LAMTOR1 shRNA (Fig 5E and Appendix Fig S3). Collectively, these results show that LAMTOR1 through its N-terminal (20–31) directly interacts with and inhibits TRPML1, thereby regulating lysosomal trafficking in dendrites.

Figure 4. Characterization of the interaction between LAMTOR1 and TRPML1
A. Schematic structure of LAMTOR1 mutants. GCC are lipidation sites. Blue cans indicate α-helices. Dashed lines indicate the locations of amino acid deletions. Arrowheads indicate the locations of amino acid substitutions. WT, wild-type; ∆N, N-terminal deletion; ∆C, C-terminal deletion; ∆K1, K20R; ∆K2, K31R. B–E. Lysates from Hela cells cotransfected with LAMTOR1-Flag or its mutants (∆N and ∆C in B, ∆N1, and ∆N2 in D, ∆K1, and ∆K2 in E) and TRPML1-YFP were immunoprecipitated with anti-GFP or control IgG antibodies and probed with the indicated antibodies. Left, input proteins; right, immunoprecipitated (IP) proteins. Note one group (Starved) of Hela cells transfected with LAMTOR1-Flag and TRPML1-YFP in (E) were incubated in medium without amino acids and serum for 2 h. (C) Lysates from Hela cells transfected as described in (B) were immunoprecipitated with anti-Flag or control IgG antibodies and probed with Flag and GFP antibodies. See Appendix Fig S4 for negative controls. F. Quantification of co-IP results. N = 3 independent experiments.Data information: Data with error bars are represented as means ± SEM. Statistical significance was assessed by one-way ANOVA with Dunnett’s post-test (F). *P < 0.05, ***P < 0.001. See also Fig EV2 and Appendix Fig S4.
Source data are available online for this figure.
Click here to expand this figure.
Figure EV2. Colocalization of LAMTOR1-Flag or its mutants with LAMP2 or TRPML1-YFP in Hela cells, and effects of TAT-2031 on Ragulator integrity and mTORC1 activation. Related to Figs and
A, B. Colocalization of LAMTOR1-Flag with LAMP2 in Hela cells. Hela cells were transfected with LAMTOR1-Flag or its mutants before being processed for LAMP2 (red) and Flag (green) immunofluorescence assay and imaging. Scale bar, 10 µm. (B) Quantification of LAMTOR1-Flag and LAMP2 colocalization shown in (A). N = 8–17 cells from 3 independent experiments. C, D. Co-localization of LAMTOR1-Flag with TRPML1-YFP in Hela cells. Hela cells were transfected with LAMTOR1-Flag or its mutants and TRPML1-YFP (green) before processing for Flag (red) immunofluorescence assay and imaging. Scale bar, 10 µm. (D) Quantification of LAMTOR1-Flag and LAMP2 colocalization shown in (C). N = 8–20 cells from 3 independent experiments. E, F. Effects of TAT-2031 on the interaction between LAMTOR1 and other members of the Ragulator (E) and mTORC1 signaling (F) in mouse hippocampus. E Lysates from fresh hippocampal tissue were immunoprecipitated with anti-LAMTOR1 antibodies or negative control anti-HA antibodies and probed with the indicated antibodies. Top, representative Western blot images; bottom, quantification of the relative abundance of LAMTOR2-5 pulled down by LAMTOR1 in naïve, TAT or TAT-2031-treated mice. F Protein lysates of hippocampal tissue from TAT or TAT-2031-treated mice were prepared for Western blot analysis. Top, representative Western blot images; bottom, quantitative analysis. N = 3 mice.Data information: Data with error bars are represented as means ± SEM. Statistical significance was assessed by one-way ANOVA with Dunnett’s post-test (B, D) and Student’s t-test (E, F). n.s., not significant.
Source data are available online for this figure.

Figure 5. Effects of TAT-2031 on the interaction between LAMTOR1 and TRPML1 in vivo and lysosomal trafficking in dendrites of hippocampal neurons
A. Interactions between LAMTOR1 and TRPML1 in mouse hippocampus. Binding of LAMTOR1 to TRPML1 in vivo was disrupted by systemic administration of the TAT-2031 peptide. Wes protein analysis with anti-LAMTOR1 and -TRPML1 antibodies of immunoprecipitation performed with anti-LAMTOR1 antibodies or negative control anti-HA antibodies using whole hippocampal homogenates from naïve, TAT or TAT-2031-treated mice. B. Quantification of the relative abundance of TPRML1 pulled down by LAMTOR1 in naïve, TAT or TAT-2031-treated mice. N = 3 mice for each group. C. Representative images from proximity ligation assay (PLA) performed on brain slices from naïve, TAT or TAT-2031-treated mice. Evidence of proximity between LAMTOR1 and TRPML1 is indicated by the appearance of red puncta. Nuclei are counterstained with DAPI (blue). Scale bar, 10 μm. See Appendix Fig S5E for negative controls. D. Quantification of the number of PLA signals in CA1 from naïve, TAT or TAT-2031-treated mice. N = 6 mice for each group. E. TAT-2031 treatment increased lysosomal mobility. Neurons were infected with shLAMTOR1 or shSc AAV; they were treated with TAT or TAT-2031 (10 µM) and imaged with LysoTracker to visualize lysosomal trafficking in dendrites. N = 17–22 neurons from 3 independent experiments.Data information: Data with error bars are represented as means ± SEM. Statistical significance was assessed by one-way ANOVA with Dunnett's post-test (B, D), or two-way ANOVA with Tukey’s post-test (E). **P < 0.01, ***P < 0.001. See also Fig EV2 and Appendix Figs S3 and S5.
Source data are available online for this figure.
To better assess the regulation of LAMTOR1 on TRPML1-mediated Ca2+ release, we genetically engineered a single-wavelength Ca2+ indicator (Chen et al, 2013), by attaching GCaMP6m to the cytoplasmic carboxyl-terminus of TRPML1 (Fig 6A). When transfected into Hela cells, TRPML1-GCaMP6m was mainly localized in LysoTracker-positive compartments (Fig 6B). To ensure that Ca2+ increase was exclusively from intracellular sources, all responses were measured in a “zero”-Ca2+ recording solution (Garrity et al, 2016), unless otherwise noted. TRPML1-GCaMP6m fluorescence responded preferentially and reliably to Ca2+ release from lysosomes induced by GPN (50 µM, Fig EV3A) or ML-SA1 (20 µM, Fig EV3B), but not to cytosolic Ca2+ increase triggered by an inhibitor of the sarco/endoplasmic reticulum Ca2+ ATPase (SERCA), thapsigargin (2 µM, Fig EV3C and D), which is consistent with previously reported results in COS-1 cells (Shen et al, 2012). Together, these results show that TRPML1-GCaMP6m readily and preferentially detects lysosomal Ca2+ release.

Figure 6. Detection of TRPML1-mediated lysosomal Ca2+ release and its regulation by LAMTOR1
Structure of the TRPML1-GCaMP6m-based Ca2+ sensor. Colocalization of TRPML1-GCaMP6m (green) with LysoTracker (red) in Hela cells. Scale bar, 5 µm. ML-SA1 (20 µM)-induced peak GCaMP6m responses (ΔF/F0) were increased in CRISPR-Cas9-mediated LAMTOR1 KD cells. N = 9–10 cells from 4 independent experiments. TAT-2031 treatment (10 µM) increased ML-SA1-induced TRPML1 Ca2+ release in both control and LAMTOR1 KD cells. Quantification of peak responses as shown in (D). N = 11–19 cells from 5 independent experiments. Colocalization of TRPML1-GCaMP6m (green) with LysoTracker (red) in hippocampal neurons. Scale bar, 10 µm. Treatment with GPN (200 µM), BAPTA-AM (20 µM), or ML-SI1 (20 µM) blocked ML-SA1-induced TRPML1-GCaMP6m responses in neurons. Quantification of responses in (G). N = 5–8 cells from 3 independent experiments. Both LAMTOR1 KD and TAT-2031 treatment (10 µM) increased ML-SA1-induced TRPML1-GCaMP6m responses in neurons. Quantification of peak responses as shown in I. N = 6–13 cells from 3 independent experiments. LAMTOR1 KD increased PI(3,5)P2 (0.5 µM)-induced TRPML1-GCaMP6m responses and the blocking effect of ML-SI1 treatment (20 µM). Quantification of peak TRPML1-GCaMP6m responses as shown in (K). N = 6–16 cells from 3 independent experiments.Data information: Data with error bars are represented as means ± SEM. Statistical significance was assessed by Student’s t-test (C), two-way ANOVA with Tukey’s post-hoc analysis (E, J, L), and one-way ANOVA with Dunnett’s post-test (H). *P < 0.05, **P < 0.01, ***P < 0.001, ###P < 0.001, n.s., not significant. Note that the traces in D, G, I, and K represent the mean values of each group. See also Fig EV3.
Source data are available online for this figure.
Click here to expand this figure.
Figure EV3. Characterization of a lysosome-targeted genetically encoded Ca2+ indicator TRPML1-GCaMP6m in Hela cells and cultured neurons. Related to Fig
A, B. GPN (50 µM, A) and ML-SA1 (20 µM, B)-induced lysosomal Ca2+ release in TRPML1-GCaMP6m-transfected Hela cells. C. Increased cytosolic calcium triggered by thapsigargin (2 μM) was not detected by TRPML1-GCaMP6m, but by BioTracker 609 Red Ca2+ AM Dye in Hela cells.
留言 (0)