
記住我

Cyclin-dependent kinases 4 and 6 (CDK4/6) phosphorylate the retinoblastoma protein (Rb) to relieve repression of E2F-dependent genes and allow progression from G1- into S-phase. Three structurally distinct CDK4/6 inhibitors have recently been licenced for breast cancer treatment: palbociclib, ribociclib and abemaciclib (Knudsen & Witkiewicz, 2017; Alvarez-Fernandez & Malumbres, 2020). Unlike other cell cycle inhibitors, these agents are generally well-tolerated and have demonstrated remarkable efficacy in treating hormone receptor-positive/human epidermal growth factor 2-negative (HR+/HER2-) metastatic breast cancer (Dickler et al, 2017; Turner et al, 2018; Im et al, 2019; Johnston et al, 2019). Comparisons with standard-of-care chemotherapy have given weight to the notion that CDK4/6 inhibitors may be able to replace conventional chemotherapy in this cancer subtype, which represents the majority of metastatic breast cancers (Giuliano et al, 2019; Nasrazadani & Brufsky, 2019; Tolaney et al, 2020).
There is also a wealth of preclinical evidence that CDK4/6 inhibitors display broad activity against a wide range of other tumour types (for reviews see (Asghar et al, 2015; O'Leary et al, 2016; Du et al, 2020)). This is supported by preliminary clinical data suggesting that these inhibitors may be beneficial for treating non-small cell lung cancer, melanoma, head and neck squamous cell carcinoma, mantle cell lymphoma, triple-negative breast cancer and acute myeloid leukaemia (Patnaik et al, 2016; Asghar et al, 2017; Adkins et al, 2019; Tan et al, 2019; Du et al, 2020; Morschhauser et al, 2020). Currently, there are at least 18 different CDK4/6 inhibitors being tested in over 100 clinical trials against various tumour types (for reviews see (Asghar et al, 2015; O'Leary et al, 2016; Klein et al, 2018; Alvarez-Fernandez & Malumbres, 2020; Yuan et al, 2021)). The hope is that these targeted cell cycle inhibitors may be widely applicable for cancer treatment, perhaps offering an alternative to the non-targeted, and considerably more toxic, DNA damaging agents or microtubule poisons that are currently in widespread clinical use.
To facilitate these efforts, there is an urgent need to identify biomarkers and combination treatments that can predict and improve patient outcomes. This requires the characterization of sensitizing events that can either: (i) enhance the ability of CDK4/6 inhibitors to arrest the cell cycle in G1, or (ii) improve long-term outcomes following this G1 arrest. Although various genetic backgrounds and drug treatments are known to sensitize the CyclinD-CDK4/6-Rb pathway and promote an efficient G1 arrest (Gong et al, 2017; Knudsen & Witkiewicz, 2017; Vijayaraghavan et al, 2017; Goel et al, 2018; Xue et al, 2019a, 2019b; Alvarez-Fernandez & Malumbres, 2020), relatively little is known about sensitizing events that could improve long-term growth suppression following this arrest. The problem is that there is no clear consensus for why a G1 arrest, which is essentially cytostatic, can produce durable effects in patients. There are many different potential explanations, including that CDK4/6 inhibition can induce senescence, apoptosis, metabolic reprogramming and/or anti-tumour immunity (for reviews see (Goel et al, 2018; Klein et al, 2018)), but whether a common event underlies these different outcomes is unclear. There is good evidence that some of the long-term outcomes are linked, in particular, senescent cells can secrete a variety of factors that engage the immune system (Xue et al, 2007; Krizhanovsky et al, 2008; Kang et al, 2011; Acosta et al, 2013), and this senescence phenotype contributes to the ability of CDK4/6 inhibition to sensitize tumours to immune checkpoint blockade (Jerby-Arnon et al, 2018; Ruscetti et al, 2018, 2020). It is therefore critical to determine how and why G1-arrested cells eventually become senescent because this may help to inform ongoing clinical trials assessing CDK4/6 inhibition alongside immunotherapy (currently 14 trials in eight different cancer types (Wagner & Gil, 2020)).
Senescence is a state of irreversible cell cycle exit induced by stress, typically DNA damage or oxidative stress (Mijit et al, 2020). A crucial question therefore concerns the nature of the stress that leads to senescence following CDK4/6 inhibition. Unfortunately, although senescence has been demonstrated in a variety of different studies (for recent review see (Wagner & Gil, 2020)), only two of these studies report a source for the stress. In both cases, senescence is believed to be induced by ROS generated during a G1 arrest (Vijayaraghavan et al, 2017), perhaps as a result of FOXM1 destabilization (Anders et al, 2011). There have been more attempts to characterize the mediator(s) of the subsequent senescent response, but the answers here have been varied, including a dependence on ATRX (Kovatcheva et al, 2015, 2017), proteasome activation (Miettinen et al, 2018), mTOR activation (Leontieva & Blagosklonny, 2013) or mTOR inhibition (Yoshida et al, 2016). This variability may reflect inherent differences between genomically diverse cancer lines. Alternatively, it may be due to inconsistent treatment protocols (drug type, dose, duration of exposure and length of washout) or the reliance on fixed endpoints that can only indirectly measure senescence (Sharpless & Sherr, 2015).
To overcome these problems, we initially elected to use a non-transformed near-diploid telomerase-immortalized hTert-RPE1 cell line expressing a FUCCI cell cycle reporter to track the fate of single cells over time following CDK4/6 inhibition. We compared all currently licenced CDK4/6 inhibitors over a range of treatment protocols to address one key unexplained question: why do these inhibitors cause long-term cell cycle exit? Our results demonstrate that a prolonged G1 arrest is associated with the downregulation of replisome components, including the MCM complex, which causes reduced origin licencing, replication stress, p53-p21 activation and long-term cell cycle withdrawal. Similar effects are observed in a range of cancer lines, which demonstrates that the induction of genotoxic stress is a common outcome of targeted CDK4/6 inhibition. These findings have considerable implications for the identification of sensitive/resistant tumour types, for the design of effective combination treatments and drug dosing schedules, and for the efforts to use CDK4/6 inhibitors to sensitize tumours to immune checkpoint blockade.
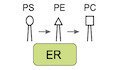
ResultsWe first quantified the fraction of G1-arrested RPE1-FUCCI cells (Krenning et al, 2014) following 24 h treatment with four structurally distinct CDK4/6 inhibitors: palbociclib (PD-0332991), ribociclib (LEE-011), abemaciclib (LY-2835219), which are licensed for breast cancer treatment, and trilaciclib (G1T28), which was recently approved to reduce chemotherapy-induced myelosuppression in small-cell lung cancer (Dhillon, 2021). The dose–response curves for all inhibitors demonstrate a penetrant arrest at the clinically relevant peak plasma concentrations (Cmax) observed in patients (He et al, 2017; Klein et al, 2018) (Fig 1A). Note, RPE1 cells are exquisitely sensitive to these compounds since the IC50s for palbociclib and abemaciclib (150 and 65 nM, respectively) were comparable to the IC50 values reported in the most sensitive cell type from a panel of 560 tumour lines: 130 nM palbociclib in MDA-MB-175-VII (breast cancer) and 60 nM abemaciclib in JeKo-1 (mantle cell lymphoma) (Gong et al, 2017). At approximate Cmax concentrations or lower, the G1 arrest was fully reversible within 24 h of drug washout, although at higher concentrations this reversibility is compromised for all drugs (Fig 1A). Note that we used an extensive washout protocol to ensure that persistent arrest is due to effects on the cell cycle and not incomplete drug washout (Fig EV1A and B; this protocol was used in all subsequent washout experiments) and cells were always plated at a low density to prevent G1 arrest due to contact inhibition (Mendonsa et al, 2018) (see Materials and Methods). The irreversible effects at higher drug concentrations are likely to represent off-target effects, as reported previously for palbociclib at ≥ 5 μM concentrations (Vijayaraghavan et al, 2017). In general, abemaciclib displayed the narrowest concentration range in which to achieve an efficient arrest that remained reversible, as noted recently by others (Trotter & Hagan, 2020). The fact that abemaciclib is uniquely able to induce irreversible effects at approximate Cmax concentrations may help to explain the unique toxicity profile associated with this drug (Marra & Curigliano, 2019).

Figure 1. A prolonged G1 arrest following CDK4/6 inhibition in RPE1 cells causes defects in the next cell cycle
Top panel displays structure of each CDK4/6 inhibitor tested. Bottom panel shows dose–response curves with these inhibitors displaying percentage of G1-arrested RPE1-FUCCI cells. To obtain dose–response curves, the number of mKO-Cdt1-positive (G1-arrested) cells was calculated following 24 h drug addition (dark blue solid lines) or 24 h after subsequent drug washout (light blue dotted lines). Cmax values observed in patients (taken from (He et al, 2017; Klein et al, 2018)) are represented on each graph with red dotted lines. Graphs display mean data ± SEM from three experiments, with at least 500 cells counted per condition per experiment. Percentage of G1-arrested RPE1-FUCCI cells, calculated as in panel (A), but using a fixed concentration of CDK4/6 inhibitor for different durations of time, as indicated. Note, this is a fixed assay that quantifies the percentage of G1-arrested cells prior to, or 24 h following, CDK4/6 inhibitor washout. Each bar displays mean data + SEM from three experiments, with at least 500 cells counted per condition per experiment. Cell cycle profile of individual RPE1-FUCCI cells (each bar represents one cell) after washout from 1 (top panel), 4 (middle panel) or 7 (bottom panel) days of treatment with CDK4/6 inhibitor, at the indicated doses (same concentration used in panel (B)). STLC (10 μM) was added to prevent progression past the first mitosis. Fifty cells were analysed at random for each repeat and three experimental repeats are displayed (150 cells total). Underneath the single-cell profiles are quantifications of the observed cell cycle defects and G1 durations. Note, G1 length is estimated by mKO-Cdt1 expression, and G1 lengths of less than 6 h could not be quantified since movies were only started after the 6 h drug washout period. These are indicated on the graphs as ≤ 6 h. Bar graphs show mean + SD. In the violin plots, horizontal lines display the median, and error bars show 95% confidence intervals. Representative images and quantification of colony forming assays of RPE1 cells treated with CDK4/6 inhibitor for 1, 4 or 7 days and then grown at low density without inhibitor for 10 days. Bar displays mean data + SEM from three experiments. Click here to expand this figure.
Figure EV1. Effect of drug washout protocol or inhibiting CDK4/6 for 48 h on the reversibility of the G1 arrest in RPE1 cells
Schematic showing different washout protocols tested to ensure washout of high-dose (10 μM) palbociclib. RPE1-FUCCI cells were treated for 1 h with 10 μM palbociclib and subsequently washed out 1–6 times, with 1 h equilibration periods interspersed between washes. STLC (10 μM) was then added to arrest cells in mitosis before quantifying the amount of mKO-Cdt1-positive, G1-arrested cells 24 h later. Quantification of the G1-arrested cells following the washout protocol described in (A). Graphs display the mean data ± SD from at least 500 cells counted per condition per experiments for two experimental repeats. Note, the points represent five different positions that were imaged per condition per experiment and the different coloured dots represent the two separate experiments. Percentage of G1-arrested RPE1-FUCCI cells after treatment for 48 h with different CDK4/6 inhibitors (dark green solid lines) or 24 h after subsequent drug washout (light green dotted lines). The data are overlaid with 24 h arrest data from Fig 1A (blue lines) to allow comparison. Vertical red dotted lines indicate Cmax values observed in patients (taken from (He et al, 2017; Klein et al, 2018)). Graphs display mean data ± SEM from three experiments, with at least 500 cells counted per condition per experiment.Increasing the duration of drug exposure to 48 h produced almost identical dose–response curves, indicating that after 2 days of treatment all drugs induced a similarly reversible G1 arrest (Fig EV1C). We next used the minimal dose of each drug required to produce a fully penetrant G1 arrest for 24 h and assessed the ability of this dose to induce a prolonged arrest for up to 14 days. Figure 1B demonstrates that all drugs can hold a full G1 arrest for up to 2 weeks. However, upon release from a prolonged arrest (> 3 days), we observed an increase in the fraction of cells remaining in G1. Therefore, CDK4/6 inhibition can induce a penetrant and reversible cell cycle arrest in RPE1 cells, but this reversibility is compromised when drug treatment persists for longer than 3 days.
This analysis only provides the cell cycle status at a single time point (24 h) following drug washout. Therefore, to examine this phenotype more closely, we performed live single-cell fate analysis using RPE1-FUCCI cells during the first cell cycle after washout from different durations of CDK4/6 inhibitor treatment (Fig 1C) (Sakaue-Sawano et al, 2008). Using this approach, we observed two striking phenotypes that appeared specifically following release from prolonged drug exposure. Firstly, the length of time individual cells took to exit G1 and enter S-phase following drug washout increased: most cells took many hours to exit G1 and a small fraction of cells failed to exit G1 at all within the 3-day imaging period. This is suggestive of a deep G1 arrest, which may become irreversible in a subset of cells. Secondly, following washout from 4- and 7-day treatments, many cells that entered S-phase failed to reach mitosis and instead reverted back into a G1-like state: green bars turning red (G1) instead of white (mitosis) in Fig 1C. This was not due to depletion of nutrients in the media since it was unaffected by replenishing the media daily (Appendix Fig S1). Therefore, prolonged arrest with CDK4/6 inhibitors induces a deep G1 arrest, and many cells that exit from this arrest fail to complete the next cell cycle. Colony forming assays demonstrated that these effects are associated with long-term inhibition of cell proliferation (Fig 1D).
The reversion of cells from S-phase/G2 back into G1 has previously been associated with a p53-dependent senescent response (Johmura et al, 2014; Krenning et al, 2014; Gire & Dulic, 2015). To explore the role of p53 in these phenotypes, we performed similar cell fate analysis in p53-WT and p53-KO RPE1-FUCCI cells, generated by CRISPR/Cas9-mediated gene editing (Appendix Fig S2). Figure 2A demonstrates that 24 h palbociclib treatment induced a dose-dependent reversible G1 arrest that was indistinguishable between p53-WT and KO cells. Although knockout of p53 did not affect the efficiency of a palbociclib-induced arrest, it did produce a striking effect on the phenotypes observed following washout from prolonged exposure to 1.25 μM palbociclib (Fig 2B). Firstly, the delay in S-phase entry following drug washout was less pronounced and fewer cells remained arrested in G1 for the duration of the movie. Secondly, the conversions from S-phase/G2 into G1 were completely abrogated.

Figure 2. p53 loss restores cell cycle progression and enhances long-term proliferation following prolonged CDK4/6 inhibition in RPE1 cells
Dose–response curves displaying the percentage of G1-arrested p53-WT (blue) or KO (green) RPE1-FUCCI cells following 24 h incubation with palbociclib (dark solid lines) or 24 h after subsequent washout (light dotted lines). Graphs display mean data ± SEM from three experiments, with at least 500 cells counted per condition per experiment. Cell cycle profile of individual p53-WT or KO RPE1-FUCCI cells (each bar represents one cell) after washout from 1, 4 or 7 days of treatment with palbociclib (1.25 μM). STLC (10 μM) was added to prevent progression past the first mitosis. Fifty cells were analysed at random for each repeat and three experimental repeats are displayed (150 cells total). The right-side panels show quantifications of cell cycle defects and G1 lengths from the displayed single-cell profile plots. Note, G1 length is estimated by mKO-Cdt1 expression, and G1 lengths of less than 6 h could not be quantified since movies were only stated after the 6 h drug washout period. These are indicated on the graphs as < 6 h. Bar graphs show mean + SD. In the violin plots, horizontal lines display the median, and error bars show 95% confidence intervals. Representative images and quantifications of colony forming assays in p53-WT or KO RPE1 cells treated with palbociclib (1.25 μM) for 1, 4 or 7 days and then grown at low density without inhibitor for 10 days. Each bar displays mean data + SEM from three experiments. Cell cycle profile of individual p53-WT or KO RPE1-FUCCI cells to analyse multiple rounds of division following washout from 1, 4 or 7 days of treatment with palbociclib (1.25 μM). FUCCI profiles show 50 cells analysed at random from one experiment, which is representative of three experimental repeats. The right-side panels show quantifications of cell cycle defects and G1 lengths from the three experimental repeats. Note, G1 length is estimated by mKO-Cdt1 expression, and G1 lengths of less than 6 h could not be quantified since movies were only stated after the 6 h drug washout period. These are indicated on the graphs as < 6 h. Bar graphs show mean + SD. In the violin plots, horizontal lines display the median, and error bars show 95% confidence intervals. Quantification of cell cycle profiles from cells treated as in (D). Graph shows the mean percentage of cells + SD that divide at each round of division, with 150 cells analysed in total from three experimental repeats.To determine whether these cell cycle defects were associated with a reduction in long-term proliferation, we performed colony forming assays under identical conditions. Figure 2C shows that 4 days of palbociclib treatment is sufficient to dramatically reduce colony forming potential in p53-WT cells, whereas 7 days of palbociclib is required to cause a similar reduction in p53-KO cells. We were struck by two major differences between the long-term proliferation data and the cell cycle analysis (Fig 2B and C). Firstly, 4 days of palbociclib treatment induced relatively few cell cycle withdrawals in p53-WT cells (16% S/G2 to G1 conversions) but this was associated with a strong reduction in long-term proliferation. Secondly, although removal of p53 allowed all cells to progress into mitosis following 4- or 7-day palbociclib treatment (Fig 2B, lower panels), p53 loss could only restore long-term proliferation in the 4-day treatment group (Fig 2C). Our FUCCI analysis only allowed quantification of the first cell cycle following drug release because cells were released from palbociclib in the presence of the Eg5 inhibitor S-trityl-l-cysteine (STLC) to block cells in mitosis (DeBonis et al, 2004). To analyse additional cell cycles after release, we performed FUCCI analysis without STLC and analysed the first 3 days of proliferation following palbociclib release. This demonstrated that although most p53-WT and KO cells were able to complete the first cell cycle following washout from 4-day palbociclib treatment, only the p53-KO cells were able to continue proliferating at a normal rate during subsequent cell cycles (Fig 2D and E), consistent with the difference in colony forming potential observed in the 4-day treatment groups (Fig 2C). The proliferative ability of p53-KO cells was compromised after 7 days of palbociclib treatment, however, since considerably fewer mitotic events were apparent during the first 3 days following drug washout. This pattern also correlated with the reduction in long-term proliferation in this condition (Fig 2C). In general, cell cycle behaviour over the first 3 days was predictive of long-term proliferative potential, with only the normally dividing cells (i.e. approx. 24 h cell cycles) able to form visible colonies (Fig 2C and D). Therefore, CDK4/6 inhibition for longer than 3 days causes defects in subsequent cell cycles which restricts long-term proliferative potential. This effect can be partially rescued by knockout of p53 which allows cells to tolerate an extended window of palbociclib treatment before they begin to exit the cell cycle. This may help to explain why p53 loss is associated with resistance to CDK4/6 inhibition in patients (Patnaik et al, 2016; Wander et al, 2020).
We next investigated the reason for cell cycle withdrawal following CDK4/6 inhibition. The ability of p53 to induce cell cycle exit from G2 has previously been linked to p21 induction (Johmura et al, 2014; Krenning et al, 2014), therefore we analysed p21 levels following CDK4/6 inhibition. In p53-WT cells, we observed that prolonged CDK4/6 inhibition is associated with a strong induction of p21 both during and following the G1 arrest (Fig 3A and B, and Appendix Fig S3). p21 induction was absent in p53-KO cells, as expected, which is consistent with the inability of these cells to exit the cell cycle from G2. The lack of p53-induced p21 had dramatic consequences because instead of withdrawing from the cell cycle, p53-KO cells underwent a catastrophic mitosis that produced excessive DNA damage, as judged by nuclear morphology and γH2AX staining (Fig 3C–E). This also caused the appearance of symmetrical 53BP1 nuclear bodies after mitosis, a phenotype that results from the segregation of incompletely replicated chromosomes (Fig 3F) (Harrigan et al, 2011; Lukas et al, 2011). Live cell imaging of GFP-53BP1/H2B-RFP p53-KO RPE1 cells confirmed that DNA damage specifically appeared after an abnormal mitosis, and this was frequently associated with the segregation of unaligned or lagging chromosomes (Fig 3G–I). Examples of the abnormal divisions can be seen in Movie EV1 (7 days palbociclib washout) in comparison to Movie EV2 (1-day palbociclib washout). Cells have intrinsic mechanisms to either replicate or resolve incompletely replicated DNA during mitosis, but these systems can be overwhelmed under conditions of replication stress to cause DNA strand breaks during mitosis (Minocherhomji et al, 2015; Nielsen et al, 2015; Pedersen et al, 2015; Moreno et al, 2016; Gemble et al, 2020). To examine whether DNA replication was indeed ongoing during mitosis, we performed mitotic DNA replication assays by examining EdU incorporation in mitotic cells 15 min after washout from the CDK1 inhibitor RO-3306 (Vassilev et al, 2006). Aphidicolin treatment, a well-known inducer of replication stress, was sufficient to elevate the levels of mitotic DNA replication in p53-KO cells, as expected (Minocherhomji et al, 2015) (Fig 3J and K). This increase in mitotic DNA replication was also observed after release from a prolonged palbociclib arrest (Fig 3J and K), consistent with the notion that DNA replication is also perturbed in these cells. Note, very few p53-WT cells enter mitosis after prolonged palbociclib release, which we hypothesize is due to a combination of p53-dependent cell cycle withdrawal (Fig 2B) and an intact ATR-dependent checkpoint that prevents mitotic entry until DNA replication is complete (Saldivar et al, 2018). In support of the latter, inhibition of ATR directly with VE-821 (Reaper et al, 2011) decreased S/G2 length and increased the number of p53-WT cells that enter mitosis following release from prolonged CDK4/6 inhibition, and this was also associated with an increase in fragmented nuclei, which are typically produced by chromosome segregation errors (Fig EV2).

Figure 3. Prolonged CDK4/6 inhibition in RPE1 cells induces replication stress and p53-dependent cell cycle withdrawal
A. Representative immunofluorescence images of p21 levels in p53-WT or KO RPE1 cells, 48 h after release from 1, 4 or 7 days palbociclib (1.25 μM) treatment. Zoom inserts are 3× magnification of the indicated regions. Scale bars = 250 μM. B. Quantification of p21 intensities in cells treated as in panel (A). At least 100 cells were analysed per experiment and graph shows data from three experimental repeats. Violin plots display the variation in intensities between individual cells. Horizontal lines display the median, and error bars show 95% confidence intervals. C. Immunofluorescence images of DAPI and γH2AX staining in p53-WT or KO RPE1 cells either before or 48 h after release from a 7-day treatment with palbociclib (1.25 μM). Scale bar = 250 μM, zoom inserts = 3× magnification of highlighted regions. D, E. Quantification of nuclear morphologies (D) and γH2AX-positive DNA damage foci (E) following palbociclib (1.25 μM) treatment in p53-WT and KO RPE1 cells. Cells were treated for 1, 4 or 7 days and then analysed before or after drug washout for 48 h. A total of 100 cells (nuclear morphology) or 50 cells (γH2AX foci) were scored per condition per experiment, and bar graphs represent mean data + SEM from six experiments. F. Immunofluorescence images showing symmetrical 53BP1 staining following mitotic exit in p53-KO cells after release from 7 days of palbociclib arrest. Three separate examples are displayed. Scale bar = 25 μM. G–I. Analysis of chromosome segregation errors and DNA damage during the first mitosis in GFP-53BP1/H2B-RFP RPE1 cells after release of from a 1- or 7-day palbociclib (1.25 μM) arrest. Quantified from the same movies are nuclear morphology after mitosis (G), chromosome segregation defects during mitosis (H) and appearance of 53BP1 foci after mitosis (I). A total of 54 cells (1 day) or 80 cells (7 days) were analysed in total from two experiments. Errors bars display SD. J, K. Representative immunofluorescence images (J) and quantifications (K) of mitotic DNA replication assays (MiDAS) in p53-KO RPE1 cells released from 7 days of palbociclib (1.25 μM) treatment or following 0.4uM aphidicolin treatment for 40 h. EdU foci were quantified in nocodazole-arrested cells. Scale bar = 5 μM, zoom inserts = 3× magnification of highlighted areas. Ten cells were analysed per experiment and the bar chart shows the mean + SEM from three experimental repeats. Click here to expand this figure.
Figure EV2. Effect of ATR inhibition on the response of RPE1 cells to CDK4/6 inhibition
A. Single-cell cycle profiles quantified immediately following washout from 7 days 1.25 µM Palbociclib treatment. After washout, cells were cultured in the absence or presence of the ATR inhibitor, VE-821 (5 µM). STLC was also added at drug washout to allow analysis of just the first cell cycle. Each bar represents an individual cell, and graphs show the data from three experimental repeats (150 cells analysed in total). B, C. Quantifications of the cell cycle defects (B) and G1 or S/G2 durations (C) from the single-cell profiles shown in (A). Note, G1 length is estimated by the duration of mKO-Cdt1 expression, and S/G2 by the time from AG-Geminin expression until mitotic entry. Only cells that re-enter the cell cycle were included in this quantification (G1-arrested cells excluded). Bars graphs in (B) display mean + SD from three experimental repeats, violin plots in (C) display the variation in G1 and S/G2 length between individual cells, with horizontal lines indicating the median, and error bars representing 95% confidence intervals. D. Quantification of the nuclear morphologies following palbociclib (1.25 μM) treatment in p53-WT and KO RPE1 cells. Cells were treated for 0, 1 or 7 days and before washout for 48 h (± ATR inhibition with 5 µM VE-821). Nuclear morphologies of 100 cells were counted per condition and per experiment, and bar graphs represent mean data + SEM from three experiments.In summary, a prolonged palbociclib arrest causes replication stress following release from that arrest. This inhibits long-term viability by either inducing a p53-dependent withdrawal from the cell cycle or, in the absence of p53, by causing cells to undergo a catastrophic mitosis resulting in DNA damage as under-replicated chromosomes are segregated. If this damage is too excessive, then long-term proliferation is still affected, as observed following release from a 7-day palbociclib arrest (Figs 2C and D and 3C–E). If the replication stress is milder, for example, following 4-day palbociclib arrest, then cells can progress through mitosis but frequently arrest in a p53-dependent manner in the subsequent G1 (Fig 2B–D). This is consistent with the previous observations that mild replication stress causes a p21-dependent arrest in the subsequent G1 (Arora et al, 2017; Barr et al, 2017).
Defects in the cell cycle begin to appear if CDK4/6 inhibitors are applied for longer than 2 days (Figs 1 and EV1C). Therefore, to screen for potential causes of replication stress, we performed a proteomic comparison of cells arrested in palbociclib for 2 or 7 days (Dataset EV1). Of the top 15 most significantly changing proteins, five were members of the MCM2-7 complex, which licences DNA replication origins and then forms the catalytic core of the CMG (Cdc45, MCM2-7, GINS) helicase that is responsible for unwinding DNA to allow replication fork progression (Fig 4A and B) (Pellegrini & Costa, 2016). In addition to MCMs, many other components of the core replisome were downregulated by prolonged palbociclib treatment, including the DNA clamp (PCNA), the clamp-loading complex (RFC1–5) and many accessory factors that bind PCNA (FEN1, DNMT1 and FAM111A). In addition, we observed downregulation of a variety of DNA polymerases along with their accessory subunits (Fig 4C). Western blotting confirmed that the levels of replisome components progressively decreased during a palbociclib arrest and, importantly, remained low after palbociclib washout for 8 or 24 h (Fig 4D and E); time points chosen to capture the majority of cells as they replicate DNA in S-phase (Fig 1C). In addition to decreasing total MCM protein, palbociclib treatment also reduced the extent of origin licencing after release from the inhibitor, as assessed by the level of chromatin-bound MCM during early S-phase (Fig 4F and Appendix Fig S4). Therefore, a palbociclib-induced G1 arrest both compromises origin licencing during G1 and reduces the concentration of proteins required to assemble functional replication forks during S-phase. This combination of impairments likely explains why if the G1 arrest is too long, there is a failure in DNA replication after release from that arrest, resulting in either cell cycle exit (p53 proficient) or a catastrophic mitosis with under-replicated DNA (p53 deficient). Note that the decrease in replisome components and origin licencing was similar in p53-KO cells (Figs 4D–F and EV3), implying that p53 status primarily defines the response to DNA replication defects.

Figure 4. Prolonged G1 arrest following palbociclib treatment in RPE1 cells downregulates replisome components and impairs origin licencing
Volcano plot of proteins up or downregulated following prolonged palbociclib (1.25 μM) treatment in RPE1 cells. The top 10 significantly upregulated and downregulated proteins are shown in blue and red respectively. The top up- or downregulated Gene Ontology (GO) terms following 7-day palbociclib (1.25 μM) treatment relative to 2 days of treatment. Quantification of relative change in protein levels of selected replisome components between 2-day (blue bars) and 7-day (orange bars) palbociclib (1.25 μM) treatment. Graphs display mean + SD from 2–3 experimental repeats. Representative western blots of whole-cell lysates from RPE1-WT cells treated with palbociclib (1.25 μM) for 1, 4 or 7 days, or treated identically, and then washed out for the indicated times to reflect when the majority of cells are in S-phase (see Fig 1C). Analysis of adjusted relative density from three independent western blot experiments. Bars display mean values ± SD. Significance determined by unpaired Student's t-test comparing treated target protein to asynchronous target control (*< 0.01, ** < 0.001, *** < 0.0001). Quantification of loaded MCM in p53-WT and KO RPE1 cells treated with palbociclib (1.25uM) for 1 or 7 days followed by drug washout for 8 h after 1 day of arrest or 24 h after 7 days of arrest to capture cells in early S-phase. To quantify loaded MCM, soluble MCM was pre-extracted from cells and the amount of the remaining DNA-loaded MCM was analysed by flow cytometry (see Appendix Fig S4 for representative FACS profiles). DNA content was measured with DAPI, and DNA synthesis was measured using a 30-min EdU pulse. The amount of DNA-loaded MCM in early S-phase cells was compared to untreated control cells. The measured fluorescent intensity of each sample was divided by the background intensity of an identically treated but unstained control. The resulting ratios were normalized to WT control cells. Graphs display mean data ± SD from three experimental repeats. Significance determined by one-way ANOVA followed by Tukey's multiple comparisons test (**P = 0.001, ****P < 0.0001). Click here to expand this figure.
Figure EV3. Western blots to characterize the level of replisome proteins in p53-KO RPE1 cells treated with palbociclib
Representative western blots of whole-cell lysates from p53-KO RPE1 cells treated with palbociclib (1.25 μM) for 1, 4 or 7 days, or treated identically, and then washed out for the indicated times to reflect when the majority of cells are in S-phase (see Fig 1C). Analysis of adjusted relative density from three independent western blot experiments. Bars display mean values ± SD. Significance determined by unpaired Student's t-test comparing treated target protein to asynchronous target control (*< 0.01, **< 0.001, ***< 0.0001).The ability of CDK4/6 inhibitors to induce genotoxic damage as a result of replication stress has important implications for cancer treatment. Firstly, it suggests that tumour cells with ongoing replication stress may be more sensitive to the long-term effects of CDK4/6 inhibition. Secondly, it implies that chemotherapeutics that enhance replication stress may sensitize cells to CDK4/6 inhibition. We sought to address these points in a controlled manner using RPE1 cells.
We therefore used a low dose of aphidicolin to partially inhibit DNA polymerases and induce replication stress directly. Figure 5A and B shows that while this did not have a strong effect on cell cycle progression when given alone, it was able to enhance the number of cell cycle withdrawals when given to cells immediately following release from CDK4/6 inhibition. A number of genotoxic anti-cancer drugs also induce replication stress; therefore, we analysed the effect of three such compounds that impede DNA replication differently: camptothecin (TopoI inhibitor), doxorubicin (TopoII inhibitor) or olaparib (PARP inhibitor). We chose a dose of each drug previously shown to be sublethal in RPE1 cells (Olivieri et al, 2020), and demonstrated that this produced only mild effects on cell cycle timing and progression in control cells (Fig 5C–E). However, when given following a palbociclib arrest, these drugs caused the majority of cells to fail to complete the first cell cycle. In particular, there was a large increase in cells that commenced DNA replication but then withdrew into G1 before entering mitosis. Colony forming assays demonstrated an increased sensitivity to the drug combinations compared with the monotherapies, with doxorubicin and olaparib causing a strong reduction in proliferation after only 1 day of palbociclib treatment (Fig 5F and G). These data suggest that consecutive treatment with CDK4/6 inhibitors and existing genotoxic drugs may be a promising therapeutic strategy, as also demonstrated recently by others, but for different reasons (Roberts et al, 2020) (see Discussion).

Figure 5. CDK4/6 inhibition sensitizes RPE1 cells to genotoxic chemotherapeutics
A. Cell cycle profile of individual RPE1-FUCCI cells (each bar represents one cell) after release from 4d treatment with palbociclib (1.25 μM) or DMSO. B–E. Cell cycle profile of individual RPE1-FUCCI cells treated as in panel (A), but additionally treated after drug washout with aphidicolin (B), olaparib (C), doxorubicin (D) or camptothecin (E), at indicated concentrations.
留言 (0)