
記住我


Antibodies against immunocheckpoint (ICP) prevent interaction between ICPs and their ligands and thereby restore the activity of cytotoxic T cells (CTLs) to lyse target cells expressing ICP ligands. Impressive clinical benefit was seen in oncological clinic with ICP inhibitors, typified by antibodies against PD-1 or CTLA-4 (Robert, 2020). Unfortunately, a significant portion of patients failed to respond to this type of treatment. EGFR mutation-positive lung cancer patients, for example, were found to not only be unresponsive to PD-1/PD-L1 inhibition (Calles et al, 2020) but even to hyper-progress after immunotherapy (Kato et al, 2017). Hence, there remains an urgent need to develop effective drugs to expand the clinical application of ICP inhibitors.
Most tissue macrophages, with a few exceptions, arise from yolk sac progenitors (Kierdorf et al, 2015; Munro & Hughes, 2017; Wu & Hirschi, 2020). Instead, pathogen-fighting macrophages are likely derived from circulating bone marrow (BM) monocytes (Ginhoux & Jung, 2014). Studies have revealed the presence of both resident yolk sac-derived and recruited BM-derived macrophages (BMDM) in the tumor microenvironment. They execute distinct function in tumor immunology and respond differently to anti-macrophage therapies like inhibitors against growth factor colony stimulating factor-1 (CSF1; Kielbassa et al, 2019).
Macrophages derived from monocyte precursors undergo specific differentiation depending on the local tissue environment (Orecchioni et al, 2019). LPS, IFNγ, and granulocyte-macrophage colony-stimulating factor (GM-CSF) polarize macrophages toward the M1 phenotype, which secrete cytokines such as IL-1β, IL-6, tumor necrosis factor (TNF), IL-12, IL-18, and IL-23. M1 macrophages produce reactive nitrogen and oxygen intermediates and promote Th1 responses and strong microbicidal activity. Phenotypically, M1 macrophages express high levels of major histocompatibility complex class II (MHC II), CD68, and co-stimulatory molecules, CD80 and CD86. In contrast, M2 macrophage activation is induced by IL-4, IL-13, IL-10, and TGF-β. These M2 cells, thereby, secrete high amounts of IL-10 and low levels of IL-12 (Orecchioni et al, 2019). Subsequent studies revealed that M2 macrophages can be further categorized into M2a, M2b, M2c, and M2d (Mantovani et al, 2004).
Immune system surveys organism for tumor development. Early phase of the surveillance features engagement of innate immunocytes like macrophages and acquired immune system like CD8+ T cells. Despite accumulating data suggesting better prognosis for patients with tumors infiltrated with CD8+ T cell, established tumors tolerate the attacks from immune system, suggesting that tumor microenvironment (TME) is immunosuppressive. Large amounts of macrophages are frequently detected in tumor foci (Pathria et al, 2019). It is now clear that rather than being tumoricidal, Tumor-associated macrophages (TAMs) adopt a protumoral phenotype in vivo (Redente et al, 2010).
Tumor-educated macrophages promote angiogenesis, cancer cell invasion, and intravasation in the primary site, as well as extravasation and persistent growth in the secondary site (Qian & Pollard, 2010; Kitamura et al, 2015). Tumor-associated macrophages protect cancer cells through eliminating the anti-tumor T cells by overexpressing PD-L1, PD-L2, CD80, and Siglec-15 (Noy & Pollard, 2014; Mantovani et al, 2017; Wang et al, 2019). Tumor-associated macrophages can also directly suppress T-cell responses by either secreting cytokines or transforming tumor microenvironment metabolically (Curiel et al, 2004; Denning et al, 2007). Therefore, eliminating TAMs has been an attractive field. Antibodies and kinase inhibitors against CSF1R have been developed for this purpose (Ries et al, 2014). Unfortunately, clinical success of these efforts has so far been limited. Another strategy is to transform TAM into M1 macrophages. Targeting PI3Kγ and class IIa HDAC has been shown to transform TAM into M1 (Kaneda et al, 2016; Guerriero et al, 2017). A systemic identification of small molecules capable of transforming TAMs into M1 macrophages would lead to identification of not only compounds but also protein targets suitable for potential drug development.
Carfilzomib, a tetrapeptide epoxyketone, irreversibly inhibits the proteasome in its ChT-L site and thus disrupts the cellular protein homeostasis (Kuhn et al, 2007). Myeloma cells, featuring production and secretion of large amounts of proteins, are especially sensitive to Carfilzomib (Muchtar et al, 2016). American food and drug administration (FDA) approved Carfilzomib for treating patients with relapsed/refractory multiple myeloma in 2012.
In this study, we conducted a high-throughput screening of chemicals, aiming to repurpose FDA-approved drugs for reprograming M2 macrophages into M1-like population. We found that Carfilzomib, and other proteasome inhibitors to a lesser degree, were capable of effectively inducing M1-like properties from M2 macrophages. These Carfilzomib-induced M1-like macrophages (Ci-M1) secreted IL-1β, upregulated CD80 and CD86, and exhibited enhanced ability to present antigens to T cells. Mechanistically, Carfilzomib treatment elicited ER stress (or unfolded protein response UPR), activated IRE1a to recruit TRAF2, and activated NF-κB pathway for transcribing genes encoding M1 cytokines. Carfilzomib treatment increased infiltration of anti-tumor inflammatory macrophages and CD8+ T cells in tumor loci and partially shrank mutant EGFR-driven lung cancers. More importantly, Carfilzomib synergizes with PD-1 antibody to treat this type of lung cancer, resulting in nearly complete tumor regression. Our work revealed a novel mechanism underlying anti-tumor effect of Carfilzomib and may expand the usage of ICP inhibitors in cancer clinic.
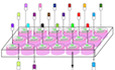
Results High-throughput Screening of FDA drugs capable of inducing IL-1β expression in M2 macrophagesTo repurpose FDA-approved drugs for reprogramming M2 macrophages into M1 cells, we performed a high-throughput screening to identify drugs capable of activating Il-1β expression in IL-4-activated BMDMs derived from transgenic mice, in which the luciferase reporter gene was placed under the control of Il-1β promoter (Il-1β-luc) (Li et al, 2008) (Figs 1A and EV1A and B). These efforts led to identification of Carfilzomib, Bortezomib, and MLN9708, which effectively activated the Il-1β promoter activity in M2 macrophages (Fig 1B). Further experiments showed that these drugs activated Il-1β promoter activity in IL4-induced M2 macrophages in dose- and time-dependent manners (Figs 1C and EV1C). We also found that pretreatment with these drugs endowed M0 macrophages the ability to resist M2 induction by IL-4 and kept M1 characteristics as indicated by strong Il-1β promoter activity (Fig 1D). Interestingly, these drugs, by their own, activated expression of Il-1β on M0 macrophages as judged by luciferase activity (Fig 1E).

Figure 1. High-throughput Screening of FDA drugs capable of inducing IL-1β expression in M2 macrophages
A. Schematic diagram of high-throughput screening. B. Carfilzomib, Bortezomib, and MLN9708 activate luciferase activity in M2 macrophages derived from Il-1β-luciferase transgenic mice. BMDMs from IL-1β-luciferase transgenic mice were treated by IL-4 (20 ng/ml) for 24 h to differentiate into mature M2 macrophages, and then used for screening of FDA compounds (5 μM). The X-axis stands for the code of the drug. C. Carfilzomib, Bortezomib, and MLN9708 activate Il-1β-luciferase in M2 macrophages in a dose-dependent manner. BMDMs from Il-1β-luciferase transgenic mice were treated by IL-4 (20 ng/ml) for 24 h, then treated by DMSO, Carfilzomib, Bortezomib, or MLN9708 at indicated concentrations. Luciferase activity was monitored 12 h later. Data from the three experiments are presented as the mean ± SD. D. Carfilzomib, Bortezomib, and MLN9708 activate Il-1β-luciferase in a dose-dependent manner as well as inhibit the transformation of M2 macrophages. BMDMs from Il-1β-luciferase transgenic mice were pretreated with DMSO, Carfilzomib, Bortezomib, or MLN970 at indicated concentrations for 1 h, followed by treatment with IL-4 (20 ng/ml). Luciferase activity was monitored 12 h later. Data from three experiments are presented as the mean ± SD. E. Carfilzomib, Bortezomib, and MLN9708 activate Il-1β-luciferase in M0 macrophages in a dose-dependent manner. BMDMs from Il-1β-luciferase transgenic mice were stimulated by DMSO, Carfilzomib, Bortezomib, or MLN970 at indicated concentrations. Luciferase activity was monitored 12 h later. Data from three experiments are presented as the mean ± SD. F, G. Carfilzomib, Bortezomib, and MLN9708 promote the mRNA expression of Il-1β in M2 macrophages. BMDMs (F) or Raw264.7 cells (G) were pretreated by IL-4 (20 ng/ml) for 24 h, then treated by DMSO, Carfilzomib (1 μM), Bortezomib (1 μM), or MLN9708 (2 μM). RNA was extracted from BMDMs or Raw264.7 cells 6 h after stimulation and the expression of Il-1β was quantified through RT-qPCR. Data from three experiments are presented as the mean ± SD. T-test was used for statistical analysis of differences between groups. ***P < 0.001 (Student’s t-test). H, I. Carfilzomib, Bortezomib, and MLN9708 promote the secretion of inflammatory cytokine IL-1β in M2 macrophages. BMDMs (H) or Raw264.7 cells (I) were pretreated by IL-4 (20 ng/ml) for 24 h, then stimulated by DMSO, Carfilzomib (500 nM), Bortezomib (500 nM), or MLN9708 (500 nM). Secretion of IL-1β was measured through ELISA 24 h later. Data from three experiments are presented as the mean ± SD. T-test was used for statistical analysis of differences between groups. **P < 0.01, ***P < 0.001 (Student’s t-test). Click here to expand this figure.
Figure EV1. High-throughput Screening of FDA drugs capable of inducing IL-1β expression in M2 macrophages
LPS but not IL-4 significantly activates luciferase activity in M0 Il-1β-luciferase transgenic macrophages. BMDMs from Il-1β-luciferase transgenic mice were induced by LPS (100 ng/ml) or IL-4 (20 ng/ml). Luciferase assays were performed 6 or 12 h after stimulation. Data are means ± SD of three independent experiments. **P < 0.01, ***P < 0.001 (Student’s t-test). M1 or M2 markers induced in macrophages by LPS or IL-4. BMDMs were induced by LPS (100 ng/ml) or IL-4 (20 ng/ml) for indicated time. RT-qPCR was then performed to quantify the expression of M1/M2 markers. Data are means ± SD of three independent experiments. ***P < 0.001 (Student’s t-test). Carfilzomib, Bortezomib, and MLN9708 promote the expression of Il-1β. BMDMs were pretreated by IL-4 (20 ng/ml) for 24 h, followed by stimulation with DMSO, Carfilzomib (1 μM), Bortezomib (1 μM), or MLN9708 (2 μM) for indicated time. RNA was extracted from cells for quantification of Il-1β expression through RT-qPCR. Data are means ± SD of three independent experiments. ***P < 0.001 (Student’s t-test).To confirm that IL-1β is indeed produced as suggested by its promoter activity, we quantified mRNA and protein levels of IL-1β. Consistently, we found that these drugs strongly activated transcription of Il-1β gene in IL4-activated BMDMs and Raw264.7 cells (Fig 1F and G). Likewise, ELISA (enzyme-linked immunosorbent assay) revealed high level of protein secreted by both cell lines treated by these drugs (Fig 1H and I).
In all cases, Carfilzomib consistently elicited the strongest IL-1β expression in macrophages. Therefore, we focused our further experimental efforts on Carfilzomib unless stated. We named macrophages initially activated with IL-4, followed by Carfilzomib treatment that have transformed from M2 to M1-like macrophages as Ci-M1 (for Carfilzomib-induced M1-like cells).
Carfilzomib reprogrammed M2 macrophages into M1-like populationWe went on to test whether Ci-M1 behaved like typical M1 macrophages. Classically activated M1 macrophages have been reported to express large amounts of inflammatory cytokines while expressing low or no level of anti-inflammatory cytokine (Fig EV1B). We found that Ci-M1, reprogrammed from both IL-4-activated BMDMs and Raw264.7, expressed high level of M1 biomarkers and inhibited M2 biomarkers at mRNA level (Figs 2A and EV2A and B). ELISA confirmed that Ci-M1 cells secreted inflammatory cytokines like IL-6 and TNFα (Figs 2B and EV2C and D). Consistent with results shown in Fig 1E, Carfilzomib activated M0 macrophages to express high amounts of proinflammatory cytokines (Il-1β, Il-6, and Inos) at mRNA level (Fig EV2E). We also found that Ci-M1 expressed elevated levels of CD86, CD80, and MHC-II (M1 surface marker) and reduced levels of CD206 (M2 surface marker) in comparison to IL-4-activated M2 macrophages (Figs 2C and D, and EV2F–J). Of note, Ci-M1 reprogrammed from RAW264.7 expressed limited level of TNFα protein, suggestive of difference between RAW264.7 and BMDM (Fig EV2C and D). We also found that Carfilzomib did not significantly alter the expression of MHC-I in M2 macrophages (Appendix Fig S1A and B).

Figure 2. Carfilzomib reprogrammed M2 macrophages into M1-like population
A. The most effective one among the candidate compounds, Carfilzomib, significantly promotes the expression of M1 macrophage markers, as well as reduces the expression of M2 macrophage markers. BMDMs were pretreated by IL-4 (20 ng/ml) for 24 h, then stimulated by DMSO or Carfilzomib (1 μM). RNA was extracted from cells 6 h after stimulation and the expression of M1 (Il-6/Inos) or M2 (Cd206/Arg1) macrophage markers was quantified through RT-qPCR. Data from three experiments are presented as the mean ± SD. T-test was used for statistical analysis of differences between groups. ***P < 0.001 (Student’s t-test). B. Carfilzomib significantly promotes the secretion of IL-6 and TNFα in M2 macrophages. BMDMs were pretreated by IL-4 (20 ng/ml) for 24 h, then stimulated by DMSO or Carfilzomib (500 nM). The secretion of IL-6 and TNFα was detected through ELISA 24 h after stimulation. Data from three experiments are presented as the mean ± SD. T-test was used for statistical analysis of differences between groups. **P < 0.01, ***P < 0.001 (Student’s t-test). C. Carfilzomib significantly promotes the expression of membrane protein CD86, CD80, and MHC-II and reduces the expression of CD206. BMDMs were pretreated by IL-4 (20 ng/ml) for 24 h, then stimulated by DMSO or Carfilzomib (500 nM). The representative histogram of CD86, CD80, MHC-II, and CD206 expression was analyzed through flow cytometry 12 h after stimulation. The gating of CD86+, CD80+, CD206+, and MHC-II+ population was determined against those of isotype-matched staining control. D. Statistics for proportion of CD86-, CD80-, MHC-II-, or CD206-positive cells in BMDMs. Data are means ± SD of three independent experiments. *P < 0.05, **P < 0.01 (Student’s t-test). E. Carfilzomib promotes the phagocytosis of macrophages. BMDMs were pretreated by IL-4 (20 ng/ml) for 24 h, then stimulated by DMSO or Carfilzomib (500 nM) for 12 h. After starving for 2 h and stained with Red membrane dye, BMDMs (red) were incubated with L1210-GFP cells (green) in serum-free medium for another 2 h. Phagocytosis effect was observed and photographed under fluorescence microscope. Scale bars: 50 μm (up) and 20 μm (down). The yellow arrows indicated L1210 that is phagocytosed by macrophages. F. Statistics represent the number of phagocytosis L1210 in 100 macrophages. Data are means ± SD of three independent experiments. **P < 0.01 (Student’s t-test). G, H. Phagocytosis is measured by flow cytometry. After co-incubation, BMDMs were stained with fluorochrome-conjugated anti-CD11B antibody and analyzed through flow cytometry. Phagocytosing efficiency was determined as the percentage of CD11B and GFP double-positive population. Statistics represents the percentage of phagocytosing against total macrophage population. Statistics represents the percentage of phagocytosing against total macrophage population and data are means ± SD of three independent experiments. **P < 0.01 (Student’s t-test). I–L. Ci-M1 drives proliferation of CD8+ or CD4+ T cells. BMDMs treated as indicated were transfected with 10 μg/ml of OVA257-264 peptide or OVA323-339 peptide for 1 h. BMDMs were then washed and co-incubated with CFSE-labeled OT-I or OT-II cells, respectively. After 72 h, OT-I (I) or OT-II (K) cells were stained with anti-CD8a or anti-CD4 fluorochrome-conjugated antibodies and CFSE was detected through flow cytometry to evaluate the dilution of CFSE in T cells. Statistics represents the percentage of divided T cells. (J, L) are statistical analysis of Fig 2I and K. The data are means ± SD of three independent experiments. *P < 0.05 (Student’s t-test). M. Carfilzomib promotes the M1 polarization of tumor-associated macrophages in vitro. BMDMs were cultured with tumor culture supernatant (TSN) produced by L1210 cells, followed by activation with DMSO or Carfilzomib (1 μM). RNA was extracted from cells and the expression of Il-1β, Il-6, and Inos was quantified through RT-qPCR 6 h after stimulation. The data are means ± SD of three independent experiments. **P < 0.01, ***P < 0.001 (Student’s t-test). Click here to expand this figure.
Figure EV2. Carfilzomib, Bortezomib and MLN9708 reprogram M2 macrophages into M1-like population
A, B. Carfilzomib, Bortezomib, and MLN9708 promote the expression of M1 macrophage markers and reduce the expression of M2 macrophage markers in macrophages. BMDMs (A) and Raw264.7 cells (B) were treated as Fig 1F and G. RNA was extracted from cells and the expression of M1 (Il-6/Inos) or M2 (Cd206/Arg1) macrophage markers was quantified through RT-qPCR 6 h after stimulation. Data are means ± SD of three independent experiments. *P < 0.05, **P < 0.01, ***P < 0.001 (Student’s t-test). C, D. Carfilzomib, Bortezomib, and MLN9708 promote the secretion of IL-6 and TNFα in M2 macrophages. BMDMs (C) and Raw264.7 cells (D) were pretreated by IL-4 (20 ng/ml) for 24 h, then stimulated by DMSO, Carfilzomib (500 nM), Bortezomib (500 nM), or MLN9708 (500 nM). Secretion of IL-6 and TNFα in culture media was detected through ELISA 24 h after stimulation. Data are means ± SD of three independent experiments. *P < 0.05, ***P < 0.001 (Student’s t-test). E. Carfilzomib alone promotes the expression of proinflammatory cytokines. BMDMs and Raw264.7 cells were treated by DMSO or Carfilzomib (1 μM) for 6 h, then RNA was extracted from cells, and the expression of Il-1β/Il-6/Inos were quantified through RT-qPCR. Data are means ± SD of three independent experiments. ***P < 0.001 (Student’s t-test). F. Gating strategy for analyzing M1/M2 macrophage surface markers in macrophages. CD86- or CD206-positive cells were gated on CD11B+ cells. G–J. Carfilzomib, Bortezomib, and MLN9708 promote the expression of membrane protein CD86 and reduce CD206. BMDMs (G) and Raw264.7 cells (I) were treated as described in Fig S2C and D. The representative histogram of CD86 and CD206 expression was shown for flow cytometry 12 h after stimulation. (H, J) Statistics represent the proportion of CD86- or CD206-positive cells in BMDMs (H) or Raw264.7 cells (J) under different treatment conditions. Data are means ± SD of three independent experiments. *P < 0.05, **P < 0.01, ***P < 0.001 (Student’s t-test).M1 macrophages exhibit enhanced phagocytosis and ability to present antigen to T cells. We then went on to test these activities. For this purpose, macrophages were stained with CellMask™ Deep Red and co-cultured with GFP expressing L1210, a lymphocytic leukemia cell line (designated L1210-GFP), such that phagocytosing macrophages can be captured under fluorescence microscopy as red cells containing green vacuoles. We found that Ci-M1 exhibited enhanced phagocytosis as compared to M2 macrophages (Fig 2E and F, and Appendix Fig S1C and D). This was further confirmed through FACS analysis (Fig 2G and H).
Our FACS analysis with 25-D1.16, an antibody reacting with the ovalbumin-derived peptide SIINFEKL bound to H-2Kb (MHC-I), revealed that Ci-M1 cells exhibited enhanced ability to present antigens (Appendix Fig S1E and F). Significantly, we found that Ci-M1 loaded with respective peptides drove more robust proliferation of OT-I and OT-II cells than peptide-loaded M2 macrophages (Fig 2I–L). Notably, we excluded the possibility that Carfilzomib per se promoted proliferation of CD4+ and CD8+ T cells (Appendix Fig S1G and H). Collectively, our results argued that Ci-M1 cells exhibited stronger antigen-presenting ability.
As an in vitro model for inducing TAM, tumor cell culture supernatants (TSN) are able to educate monocytes to become immunosuppressive macrophage (Kuang et al, 2007; Zhou et al, 2009). To confirm Carfilzomib could promote TAM polarization to Ci-M1, BMDM and Raw264.7 were first exposed to TSN for TAM differentiation, following protocols reported earlier (Kuang et al, 2007). The resultant TAMs were then treated with Carfilzomib. Our results showed that Carfilzomib potently transformed TAM to Ci-M1 (Fig 2M and Appendix Fig S1I–K). Of note, Carfilzomib treatment increased CD206 expression in TAMs, suggesting the microenvironment-dependent effects (Appendix Fig S1I–K).
Collectively, Carfilzomib potently transforms M2 and TAMs into M1-like macrophages. Notably, Bortezomib and MLN9708 had similar capacity, although they were less potent (Fig EV2A–D and G–J, and Appendix Fig S1C–F).
Proteasome inhibitors reprogrammed M2 macrophages toward M1-like macrophages by inducing ER stress signalingInterestingly, Carfilzomib, Bortezomib, and MLN9708 are all proteasome inhibitors (PIs), which are the only three PIs in our library. Likewise, MG132, a tool compound for proteasomal inhibition, was also able to activate Il-1β promoter activity in IL-4-activated M2 macrophages (Fig 3A and B), suggesting that proteasomal inhibition transformed M2 to M1-like macrophages. Q-PCR analysis indicated that MG132 was able to activate M2 macrophages to express Il-1β, Il-6, and Inos, and inhibit the expression of M2 macrophage markers, such as Cd206 and Arg1 (Fig 3C). To further show whether proteasomal inhibition per se is the driving force for reprogramming M2 into M1-like macrophages, we went on to genetically disable proteasomal subunit. Interestingly, Psmb5 knockdown upregulated expression of Il-1β and Il-6 in IL-4 activated Raw264.7 cells (Fig 3D), consistent with an earlier observation in THP-1 cells (Wang et al, 2017). Of note, Cd206 and Arg-1 expression remained upregulated, suggestive of difference between chemical inhibition and genetic inhibition of proteasomal activity (Appendix Fig S2A). Taken together, these data indicated that PIs were able to reprogram M2 macrophages toward M1-like macrophages through inhibition of proteasomal activity.

Figure 3. Proteasome inhibitors reprogram M2 macrophages toward M1-like macrophages by inducing ER stress signaling
A, B. Carfilzomib and proteasome inhibitor MG132 activate Il-1β luciferase in macrophages. (A) BMDMs were treated with IL-4 (20 ng/ml) for 24 h and then stimulated by DMSO, Carfilzomib (1 μM), or MG132 (5 μM). (B) BMDMs were stimulated by DMSO, Carfilzomib (1 μM), or MG132 (5 μM)) for 1 h, then induced with IL-4 (20 ng/ml). Luciferase assays were monitored 12 h after stimulation. The data are means ± SD of three independent experiments. ***P < 0.001 (Student’s t-test). C. MG132 promotes the expression of M1 macrophage markers and inhibits the expression of M2 macrophage markers. BMDMs were pretreated with IL-4 (20 ng/ml) for 24 h and then stimulated by DMSO or MG132 (5 μM). RNA was extracted from BMDMs 6 h after stimulation and the expression of M1 (Il-1β/Il-6/Inos) or M2 (Cd206/Arg1) macrophage markers was quantified through RT-qPCR. The data are means ± SD of three independent experiments. *P < 0.05, ***P < 0.001 (Student’s t-test). D. Knockdown of β5 subunit of proteasome in macrophages promotes the expression of proinflammatory factors. RNA was extracted from Raw264.7 (shGFP or shPsmb5) and the expression of Il-1β and Il-6 was quantified through RT-qPCR. The data are means ± SD of three independent experiments. *P < 0.05, ***P < 0.001 (Student’s t-test). E. Carfilzomib, Bortezomib, MLN9708, and MG132 induce ER stress response. BMDMs were pretreated with IL-4 (20 ng/ml) for 24 h and then stimulated by DMSO or Carfilzomib (1 μM), Bortezomib (1 μM), MLN9708 (2 μM), and MG132 (5 μM). RNA was extracted from cells 3 or 6 h after stimulation and the expression of ER stress-related genes (Bip, Chop) was detected through RT-qPCR. The data are means ± SD of three independent experiments. *P < 0.05, **P < 0.01, ***P < 0.001 (Student’s t-test). F. ER stress agonists, TUN and TG, promote the expression of M1 macrophage markers, as well as reduce the expression of M2 macrophage markers. BMDMs were pretreated with IL-4 (20 ng/ml) for 24 h and then stimulated by DMSO, TUN (500 nM), or TG (500 nM). RNA was extracted from cells 6 h after stimulation and indicated genes were quantified through RT-qPCR. The data are means ± SD of three independent experiments. *P < 0.05, **P < 0.01, ***P < 0.001 (Student’s t-test). G. Inhibition of ER stress impairs the ability of Carfilzomib, Bortezomib, MLN9708, and MG132 to reprogram M2 toward M1-like macrophages. BMDMs were induced by IL-4 (20 ng/ml) for 24 h, then pretreated with 4-PBA (5 mM) for 1 h and stimulated by Carfilzomib (1 μM), Bortezomib (1 μM), MLN9708 (2 μM), and MG132 (5 μM). RNA was extracted from cells 6 h after stimulation and the expression of Il-1β, Il-6, and Inos was detected through RT-qPCR. The data are means ± SD of three independent experiments. *P < 0.05, **P < 0.01, ***P < 0.001 (Student’s t-test).Previous studies indicated that PIs caused the accumulation of misfolded proteins, leading to endoplasmic reticulum (ER) stress and thereby eliciting the unfolded protein response (UPR) (Obeng et al, 2006). Q-PCR analysis revealed that besides Il-1β, PIs were able to induce expression of typical UPR biomarkers, Bip and Chop, in IL-4-activated M2 macrophage (Fig3E and Appendix Fig S2B). These data indicated that PIs might mediate macrophage polarization through ER stress. We were able to further confirm this point, since classic ER stress inducers, tunicamycin (TUN) and thapsigargin (TG), induced expression of M1 markers, including Il-1β, Il-6 alongside ER stress markers in IL-4-activated M2 macrophage (Fig 3F and Appendix Fig S2C). Meanwhile, the expression of M2 markers, Cd206 and Arg1, was significantly inhibited (Fig 3F). Sodium 4-phenylbutyrate (4-PBA) has been reported to effectively alleviate ER stress (Rubenstein & Zeitlin, 2000). Consistently, we found that 4-PBA treatment inhibited upregulation of M1 markers elicited by PIs in M2 macrophages derived from BMDM (Fig 3G). Taken together, these results suggested that PIs reprogrammed M2 macrophages into M1-like macrophages by inducing ER stress signaling.
IRE1α-TRAF2-NF-κB axis is essential for polarizing M2 to M1-like macrophagesIn mammals, three sensors (IRE1α, PERK, and ATF6) detect unfolded protein accumulation in endoplasmic reticulum (ER) and activate UPR to reduce unfolded protein load to maintain cell viability and function (Hetz, 2012). To identify which sensor is responsible for reprogramming M2 macrophages by PIs, we knockdown expression of ATF6 and PERK with shRNA (Fig EV3A) and knockout IRE1α through sgRNA-mediated targeting (Fig EV3B and C). Q-PCR assays indicated that expression of Il-1β and Il-6 was markedly impaired in Ci-M1 cells derived from IRE1α-deficient Raw264.7 cells (Fig 4A) while no significant impacts were detected in shPERK- or shATF6-treated RAW264.7 cells (Fig EV3F and G). To further confirm this point, we crossed LyzM-cre mice with ERN1 (encoding IRE1α)fl/fl for generating IRE1α-deficient (Ern1−/−) macrophages. Indeed, Ern1−/− BMDMs were largely unresponsive to Carfilzomib treatment in terms of upregulating M1 biomarkers (Fig 4B), as well as to Bortezomib and MLN9708 (Fig EV3D and E).
Click here to expand this figure.
Figure EV3. IRE1α-TRAF2-NF-κB axis is essential for polarizing M2 to M1-like macrophages
A. Knockdown efficiency of shAtf6 or shPerk. RNA was extracted from Raw264.7-shGFP, Raw264.7-shAtf6, and Raw264.7-shPerk cells, and the expression of Atf6 and Perk was quantified through RT-qPCR. Data are means ± SD of three independent experiments. **P < 0.01 (Student’s t-test). B. Details of sgRNA-mediated knockout of IRE1α in Raw264.7. C. IRE1α knockout efficiency of sgRNA. Raw264.7-sg IRE1α monoclonal cells were picked out and the WCLs were analyzed by immunoblots with the indicated antibodies. D, E. Deficiency of Ern1 represses the expression of inflammatory-related genes activated by Bortezomib, MLN9708. Wild-type and Ern1−/− BMDMs (D) or Raw264.7 cells (E) were pretreated by IL-4 (20 ng/ml) for 24 h, and then stimulated with DMSO, Bortezomib (1 μM), or MLN9708 (2 μM) for 6 h. Expression of Il-1β and Il-6 was quantified through RT-qPCR. Data are means ± SD of three independent experiments. *P < 0.05, **P < 0.01, ***P < 0.001 (Student’s t-test). F, G. Knockdown of Atf6 (F) or Perk (G) does not significantly change the ability of Carfilzomib to promote M1-like macrophages polarization. Engineered cell lines, including Raw264.7-shGFP, Raw264.7-shAtf6, or Raw264.7-shPerk, were pretreated by IL-4 (20 ng/ml) for 24 h, then stimulated by DMSO or Carfilzomib (1 μM). RNA was extracted from cells and the expression of Il-1β and Il-6 was quantified through RT-qPCR 6 h after stimulation. Data are means ± SD of three independent experiments. H. IRE1α kinase activity plays a role in mediating expression of M1 markers induced by Carfilzomib in M2 macrophages. BMDMs were activated by IL-4 (20 ng/ml) for 24 h, followed by treatment with IRE1α inhibitors including Kira6, 4μ8c for 1 h, and then stimulated by Carfilzomib (1 μM) for 6 h. Expression of Il-1β and Il-6 was quantified through RT-qPCR. Data are means ± SD of three independent experiments. **P < 0.01, ***P < 0.001 (Student’s t-test). I. Impact of inhibition of IRE1α kinase activity on the expression of M1 marker genes and ER stress-related genes in Raw264.7 activated by Carfilzomib. Raw264.7 cells were activated with IL-4 (20 ng/ml) for 24 h, followed by treatment with Kira6 for 1 h, and then stimulated by Carfilzomib (1 μM) for 6 h. The mRNA expression of Bip, Chop, Il-1β, and Il-6 was quantified through RT-qPCR. Data are means ± SD of three independent experiments. *P < 0.05, **P < 0.01 (Student’s t-test).Source data are available online for this figure.

Figure 4. IRE1α-TRAF2-NF-κB axis is essential for polarizing M2 to M1-like macrophage
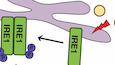
A, B. Deficiency of Ern1 reduces the expression of inflammatory-related genes. Wild-type and Ern1−/− Raw264.7 cells (A) or BMDMs (B) were pretreated by IL-4 (20 ng/ml) for 24 h, then stimulated by DMSO or Carfilzomib (1 μM). The mRNA of Il-1β and Il-6 was quantified through RT-qPCR 6 h after stimulation. The data are means ± SD of three independent experiments. **P < 0.01, ***P < 0.001 (Student’s t-test). C. Inhibition of IRE1α kinase activity represses luciferase of Carfilzomib-treated M2 macrophages derived from Il-1β-luciferase transgenic mice. BMDMs derived from Il-1β-luciferase transgenic mice were differentiated into M2 macrophages by IL-4 (20 ng/ml). M2 macrophages were treated by different inhibitors of IRE1α, including Kira6 (inhibitor of IRE1α kinase activity, 100 nM) and 4μ8c (inhibitor of IRE1α RNase activity, 100 nM) for 1 h, followed by stimulation with Carfilzomib (1 μM) for 12 h. Luciferase activity was then monitored. The data are means ± SD of three independent experiments. **P < 0.01 (Student’s t-test). D. Kira6 inhibits Carfilzomib-induced Il-1β-luciferase in M2 macrophages in a dose-dependent manner. Il-1β-luciferase BMDMs were differentiated into M2 macrophages by IL-4 (20 ng/ml), treated by Kira6 at indicated concentrations (0, 50, 100, 200, 400, 800, and 1,600 nM) for 1 h, and then stimulated by Carfilzomib (1 μM) for 12 h. Luciferase activity was measured. The data are means ± SD of three independent experiments. E. Kira6 inhibits the expression of ER stress-related genes and inflammatory-related genes. BMDMs were treated by IL-4 (20 ng/ml) for 24 h, treated with Kira6 (100 nM) for 1 h, and then stimulated by Carfilzomib (1 μM) for 6 h. RNA was extracted from cells and the expression of Bip, Chop, Il-1β, and Il-6 was quantified through RT-qPCR. The data are means ± SD of three independent experiments. *P < 0.05, **P < 0.01 (Student’s t-test). F, G. Carfilzomib has no effect on splicing of XBP1 in M2 macrophages. BMDMs (F) or Raw264.7 cells (G) were pretreated by IL-4 (20 ng/ml) for 24 h, then stimulated with DMSO, Carfilzomib (1 μM), or TUN (500 nM). The mRNA expression of sXBP1 and unXBP1 was detected through RT-qPCR 6 h after stimulation. The data are means ± SD of three independent experiments. *P < 0.05, **P < 0.01, ***P < 0.001 (Student’s t-test). H. Carfilzomib increases the expression of total IRE1α as well as promotes the phosphorylation of IRE1α. BMDMs were pretreated by IL-4 (20 ng/ml) for 24 h, then stimulated by DMSO or Carfilzomib (1 μM) for indicated time. Whole cell lysates (WCL) were analyzed by immunoblots (IB) with the indicated antibodies. I. Carfilzomib promotes the oligomerization of IRE1α in macrophages. Raw264.7 cells were pretreated by IL-4 (20 ng/ml) for 24 h, then stimulated by DMSO or Carfilzomib (1 μM) for 2 h. The cells were fixed and stained with anti-IRE1α antibody and fluorochrome-conjugated secondary antibody, and then subjected to confocal microscopy. Representative images show the aggregation of IRE1α (green). Scale bar: 10 μm. J. Carfilzomib promotes the association between IRE1α and TRAF2 in M2 macrophages. Raw264.7 cells were pretreated by IL-4 (20 ng/ml) for 24 h, then stimulated by Carfilzomib (1 μM) for 2 or 4 h. Co-immunoprecipitation (Co-IP) and IB were performed with indicated antibodies. K. Carfilzomib activates NF-κB promoter in Raw264.7 cells. Raw264.7 cells were pretreated with or without IL-4 (20 ng/ml) for 24 h, NF-κB reporter and TK were co-transfected for overnight, then stimulated by DMSO or Carfilzomib (1 μM) for 12 h before luciferase assay performed. The data are means ± SD of three independent experiments. **P < 0.01 (Student’s t-test). L. Carfilzomib activates NF-κB signaling pathway through IRE1α in M2 macrophages. Wild-type and Ern1−/− Raw264.7 cells were pretreated by IL-4 (20 ng/ml) for 24 h, then stimulated by Carfilzomib (1 μM) for indicated time points. WCL were analyzed by IB with indicated antibodies.IRE1α can be activated to exert RNase activity and kinase activity, which could be inhibited by chemical inhibitors. Interestingly, Kira6 (inhibiting IRE1 kinase activities), but not 4μ8C (inhibiting IRE1 RNase activities), dose dependently inhibited luciferase activities in Ci-M1 derived from Il-1β-luciferase transgenic mice (Figs 4C and D, and EV3H). Q-PCR assay further confirmed critical role of kinase activity of IRE1α in mediating PI’s induction of M1 biomarkers. Consistently, besides Bip and Chop, Kira6 inhibited the transcription of Il-1β and Il-6 by Ci-M1 derived from both BMDM and Raw264.7 (Figs 4E and EV3I). Of note, we found that Carfilzomib did not activate XBP1 splicing in M2 macrophages, which was in drastic contrast to classic ER stress inducers like tunicamycin (Fig 4F and G). Taken together, these results indicated that kinase activity of IRE1α played an important role in reprogramming M2 into M1 macrophages by Carfilzomib.
Unfolded proteins in ER bind to luminal domain of IRE1α, resulting in oligomerization, autophosphorylation of IRE1a, and activation of its RNase activity (Adams et al, 2019). IRE1α recruits TRAF2 and activates the downstream IKK-NF-κB pathway to induce inflammation cytokines production (Kaneko et al, 2003; Hu et al, 2006). We found that expression and phosphorylation of IRE1α were significantly increased in Ci-M1 (Fig 4H). Confocal analysis revealed that Carfilzomib induced robust aggregation of IRE1α in IL-4-activated M2 macrophages (Fig 4I). We further found that Carfilzomib enhanced recruitment of TRAF2 by IRE1α (Fig 4J).
Furthermore, we found that Carfilzomib treatment induced robust NF-κB transcriptional activity in a reporter assay (Fig 4K). Moreover, Carfilzomib-induced phosphorylation of IκBα and p65, hallmarks of activation of NF-κB pathways, was drastically impaired in Ern1−/− M2 macrophages (Fig 4L).
Taken together, these results suggest that IRE1α-TRAF2-NF-κB axis is essential for Carfilzomib to reprogram M2 into M1-like macrophages.
Carfilzomib shrank tumor in vivo through promoting M2 macrophages polarization into M1-like macrophagesCarfilzomib has been approved for treatment of relapsed and/or refractory multiple myeloma (MM) in the Europe and United States. Given our obse
留言 (0)