
記住我

Tree litterfall is one of the main pathways for transferring carbon and nutrients from aboveground vegetation to soils and represents an essential link in the organic production–decomposition cycle, which makes nutrients bound in aboveground biomass available to plants (Attiwill & Adams, 1993; Meentemeyer et al., 1982; Vitousek & Sanford, 1986). However, a fraction of this litterfall (0 to >50% of the total above the ground production) gets trapped in the canopy and does not immediately come in contact with terrestrial soil (Álvarez-Sánchez & Guevara, 1999; Dearden & Wardle, 2008; Nadkarni & Matelson, 1991). This phenomenon is particularly relevant in the tropics because of the presence of numerous litter-trapping plants, including terrestrial and epiphytic species with special features such as modified leaves and upward-growing roots that effectively capture and co-opt plant litter as it moves between trees and soil (Álvarez-Sánchez & Guevara, 1999; Weissenhofer et al., 2008; Zona & Christenhusz, 2015).
In Neotropical forest canopies bromeliads are by far the most abundant litter-trapping plants (Benzing, 2000; Hietz & Hietz-Seifert, 1995; Zotz, 2016), with densities ranging from a few dozen to more than 70,000 individuals ha−1 (Richardson et al., 2000; Sugden & Robins, 1979). By intercepting litter, epiphytic bromeliads obtain nutrients before they reach the pedosphere and retain them in the canopy in three different compartments, that is, (1) bromeliad tissues (Benzing & Renfrow, 1971; Benzing & Seemann, 1978; Richardson et al., 2000); (2) tank litter (TL), which is trapped in the overlapping leaf bases of tank bromeliads (Castaño-Meneses, 2016; Paoletti et al., 1991; Richardson, 1999); and (3) external litter (not part of this study), accumulated in organic mats outside bromeliads (Ortega-Solís et al., 2017; Victoriano-Romero et al., 2019).
Carbon and nutrient pools and fluxes in the first and second compartments have only been quantified in very few forests and bromeliad species, and the limited data base suggests that neither of them is particularly large (Benzing & Renfrow, 1974; Benzing & Seemann, 1978; de Souza et al., 2016; Díaz et al., 2010; Paoletti et al., 1991; Richardson et al., 2000). Bromeliad productivity does not exceed 15% of the net primary productivity of forests (Oliveira, 2004; Richardson et al., 2000), and nutrients in TL make up less than the pool in litter in the top 10 cm of forest soil (Richardson et al., 2000). However, TL is an important part of the canopy dead organic matter, which can comprise half or more of the total epiphytic matter (Díaz et al., 2010; Gómez-González et al., 2017; Nadkarni, 1984), and its decomposition contributes to greenhouse gas emissions (Martinson et al., 2010). Moreover, TL provides most of the nutrients to tank bromeliads, which absorb them directly from their tanks via foliar trichomes (Benzing, 1970), and is the main source of energy, over a broad geographic range, for bromeliad associated heterotrophic food webs (Farjalla et al., 2016), which are characterized by a high diversity of organisms such as bacteria, protozoans, fungi, invertebrates, and vertebrates (Aguilar-Cruz, Arenas-Cruz, et al., 2021; Durán-Ramirez et al., 2019; Frank & Lounibos, 2009; Goffredi et al., 2011; Grippa et al., 2007; Richardson, 1999).
Although the ecological importance of tank bromeliads is acknowledged, and they have served as model ecosystems for studying trophic interactions and food webs (Srivastava et al., 2020), quantitative models of litter capture and storage in these plants are surprisingly rare. The few published studies generally focus on phytotelm fauna (Carrias et al., 2001; Castaño-Meneses, 2016; Paoletti et al., 1991; Richardson, 1999), and measurements of bromeliad litter capture (BLC) are only indirect (Ospina-Bautista & Estévez Varón, 2016). Moreover, there is a knowledge gap regarding the composition and seasonal variation of litter capture by bromeliads, and carbon and nutrient pools in these plants at the ecosystem level are generally based on their density while variation in size and species identity is ignored (Paoletti et al., 1991; Richardson et al., 2000). These shortcomings, which do not allow a quantitative assessment of the role of bromeliads in ecosystem processes in Neotropical forests, motivated the present study, in which we (a) analyzed the composition and seasonal variation of forest litterfall, and litter trapped by tank bromeliads over a one-year period in five forest types along an elevation gradient; (b) modelled BLC as a function of plant size, month and site, considering the interspecific variation; (c) modelled TL as a function of bromeliad size and species; and lastly, (d) estimated carbon and nutrient pools and fluxes in tank bromeliads in two contrasting forests.
2 METHODS 2.1 Study areaThis study was performed in the eastern part of the Trans-Mexican Volcanic Belt in central Veracruz, Mexico, where elevation varies from sea level at the Gulf of Mexico to 4,250 m at the top of the Cofre de Perote Volcano (Figure 1). Temperature decreases linearly with elevation, and moist Trade Winds of the Gulf of Mexico flow from an easterly direction, passing through the coastal plains until being lifted by the mountain ranges, resulting in higher precipitation at mid-elevations (1,500–2,000 m) (CONABIO, 2011). Along this elevational gradient, we selected five sites from ca. 0–2,200 m a.s.l. (Figure 1, Table S1). The study sites included a mangrove forest (MF, 5 m a.s.l.), which grows on low, flat, lacustrine–marshy plains and is exclusively comprised of mangrove species (Lara-Domínguez et al., 2009); a semi-deciduous tropical forest (SDTF, 650 m a.s.l.) dominated by Neotropical tree species and oaks; a tropical oak forest (TOF, 1,005 m a.s.l.) composed mainly by tropical deciduous oaks, and two cloud forests (CF-C, 1,650 and CF-Z, 2,210 m a.s.l.) that present a mixture of tropical and temperate floristic elements and are located in the rainiest portions of the gradient, where light rain and fog events are frequent throughout the year (Carvajal-Hernández et al., 2020; CONABIO, 2011; Monge-González et al., 2020; Williams-Linera, 2012).

Location of the five study sites along an elevational gradient in Veracruz, Mexico. 1. Mangrove forest (Mandinga), 2. Semi-deciduous tropical forest (Palmarejo), 3. Tropical oak forest (Tres Pasos), 4. Cloud forest (Capulines), and 5. Cloud forest (Zapotal)
2.2 Vegetation sampling and forest litterfallAt each of the five study sites, three plots of 15 m × 15 m were established at least 10 m from one another. All trees (including palms and tree ferns) in the plots with a diameter at breast height (DBH) ≥5 cm were measured (height and DBH) and labelled. Specimens were identified in the Herbario XAL (INECOL, A.C., Xalapa), except for Quercus, which were identified and deposited at the Herbario Nacional de México (MEXU), Instituto de Biología, UNAM, Mexico City.
Five conical litter collectors (mosquito net, 0.25 m2, 56.5 cm diameter) were placed ca. 1 m above the ground in each plot (n = 75). Litter was collected monthly from January to December 2018, dried at 70°C for 72 h, and weighed. Litterfall of each forest was calculated by extrapolating from 3.75 m2, litter collectors’ area per forest, to 1 ha and reported as Mg ha−1 yr−1. Additionally, litter samples were sorted into the following categories: epiphytes (non-bromeliads or bromeliads), non-vascular epiphytes, leaves (sorted by species), flowers, seeds/fruits, twigs/bark (<2 cm in diameter), and detritus (fragmented or decomposed material that could not be sorted in any former category). Litter from each category and forest type were weighed, and subsamples of ca. 3 g (5 g in the case of leaves) of each category (except non-vascular epiphytes) and forest were analyzed for nutrients for every other month starting in January 2018, when <3 g were available the total sample was used.
2.3 Bromeliad litter captureTo determine the bromeliad litter capture, 15 individual tank bromeliads were collected at each site in the surroundings of the plots (n = 75). We selected medium-to-large-sized (maximum leaf length >30 cm) plants that were abundant at the study sites, without inflorescence nor foliar damage. The selected tank bromeliads (Aechmea bracteata, A. nudicaulis, Tillandsia fasciculata, T. heterophylla, T. imperialis, T. aff. limbata, T. limbata, and T. macropetala, Table S1) differed in morphology (Figure S1) and covered the variation present at each site and along the elevation gradient. The collected plants were labelled, all materials inside their tanks were removed, and the projected plant area (PA) was obtained through perpendicular top view photographs taken from ca. 4 m above the ground with a digital camera (Samsung DV150F; Samsung Electronics Co., ROK). To take the photographs, bromeliads were placed on a white tripod, above a white plastic foil and protected from direct sunlight. For each photograph, a scale (black rigid cardboard of 10 cm × 10 cm) was fixed at the maximum height of the plant with horizontal orientation (Figure S1). The plant PA was then estimated using the ImageJ software (Rasband, 2018).
Afterward, bromeliads were relocated in their original locality over randomly assigned large trees (DAP >20 cm, n = 75) at 1.5 m above the ground maintaining the bromeliads in an upright position (Figure S2, for more details, see Aguilar-Cruz, Arenas-Cruz, et al., 2021). Once per month during 2018, the litter trapped by bromeliads (BLC) was collected and then processed and sorted in the same way as the litter obtained from the litter collectors. During the census, nine bromeliads died and were replaced by similar conspecifics. After one year, PA was obtained again.
2.4 Bromeliad and tank litter samplingBromeliads and TL were sampled from December 2018 to January 2019 in the MF and the SDTF. To this end, we selected nine trees with DBHs ranging from 7 to 76 cm at each site, which (a) were common (Table S1), (b) at least one tank bromeliad was growing on them, and (c) almost all their canopy could be accessed using ladders or single rope technique (Moffett and Lowman, 1995). Following these criteria, Avicennia germinans, Laguncularia racemosa, and Rhizophora mangle were chosen in the MF, and Exothea paniculata, Quercus polymorpha, Protium copal, and Zanthoxylum fagara in the SDTF. Then, all tank bromeliads with a foliar length >30 cm were selected. After recording the distance from each bromeliad to the ground using a laser measuring tool (Model GLM 80 professional, Bosch; Stuttgart, Germany), bromeliads were labelled and placed in plastic bags to avoid TL losses; then, they were lowered to the ground. Plants that grew in colonies and could not be separated in the field were placed in a single bag. When direct manual harvesting was impossible, branches were cut and lowered to the ground using pulleys and ropes. Bromeliads that lost TL during this process were discarded from TL models but were considered for the forest carbon and nutrient estimations using average values.
In the laboratory, TL was extracted using tweezers, brushes, and spatulas, and also by vigorous shaking of plants turned upside down over a plastic tarp. When the litter was deep inside leaf axils, high-pressure water was also used. Bromeliad colonies were separated, and large ramets (foliar length >30 cm) were counted as individuals. Litter between plants but not inside a tank was discarded [in the SDTF ca. 1/3 of all the collected bromeliads were growing in colonies, and in general the amount of litter between plants was equivalent to the TL (personal observation)]. The nutrients stored in the living foliage of the bromeliads were assessed by sampling disks (1.3 cm diameter) from the base, center, and tip of three to four leaves from different positions of the rosette for a good representation of nutrients of entire plants. The extracted TL and the discs of each plant were dried at 70°C for 72 h and weighed, and 98 samples of 2 g of each component were taken for chemical analysis.
After TL extraction, plants were weighed using hanging scales [precision: 1 g for small plants (<1 kg, Model SR-1KG; American Weigh Scales; Georgia, USA), and 10 g for large plants (>1 kg, model HDB 10K10N, Kern & Sohon; Balingen, Germany)]. Then, 36 plants of different species were dried at 70°C until constant weight. The obtained relationship of wet vs. dry mass (Figure S3) allowed an estimate of the biomass of all collected plants. Additionally, to study the effect of plant size and species on TL, the PA of 85 bromeliads belonging to three abundant species (A. bracteata, T. fasciculata, and T. limbata) was estimated following the method described above using a digital camera (Nikon D3300, Tokyo, Japan).
2.5 Chemical analysisSamples (trapped litterfall, TL, and bromeliad sampling disks) were transferred to Oldenburg University for carbon and nutrient analysis. They were fine-milled, and carbon and nitrogen concentrations were determined using a CN analyzer (Flash EA 1112; Thermo Fisher Scientific, Milano, Italy) according to the manufacturer's recommendations and using copper and tungsten oxide as catalyst. For phosphorus analysis, ca. 5 mg of organic material was digested in 200 μl conc. HNO3 and 30 μl 30% H2O2 (Huang & Schulte, 1985). After digestion, 770 μl distilled water was added to the samples and the phosphorus concentration was determined at 710 nm using a UV–VIS spectrophotometer (Specord 50; Analytik Jena, Jena, Germany). Sodium, potassium, magnesium, and calcium were analyzed using a flame atomic absorption spectrometer (AA240; Agilent Technologies, Mulgrave, Australia) according to the manufacturer's recommendations.
2.6 Statistical analysis 2.6.1 Bromeliad litter capture and tank litter A linear mixed-effects model (LME) was fitted to model the log-transformed BLC using PA, site, month, and their double interactions as fixed effects. Since BLC was measured in the same plants over time and in different bromeliad species, we set bromeliad ID (individuals), and species as random effects. The significance of the fixed effects was evaluated with the Wald chi-square test, and simplification to the minimal adequate model was done based on deletion log-likelihood tests (Crawley, 2007). For this model, only the non-replaced bromeliads were used, and the PA in any given month was estimated by assuming a linear change over time (Equation 1). (1)
(1)
 where PAij is the PA of plant i at the month j, □i is the monthly change in PA for plant i, Areat0 is the PA at the beginning of the experiment, Areat1 the PA at the end of the experiment, and j is the month beginning from January, j = .
Tank litter was modelled as a function of PA, species, and their interaction using a Gamma general linear mixed-effect model (GLME). We used a log link function and tree set as a random effect to incorporate the dependency among observations of the same tree. Simplification to the minimal adequate model was done following the method described above. Four influential points were removed to improve the fit of the model (the model fitted with the complete data is presented in Figure S4). Additionally, we tested a possible effect of the distance between bromeliads and the ground (DG) on TL. To this end, we removed one outlier, log-transformed TL and fitted an LME with DG and the log-transformed plant mass set as fixed covariates and tree as a random effect. Statistical analyses were performed using R version 3.6.3 (R Core Team, 2020); LME and GLME models were fitted with the lme4 package (Bates et al., 2015) and evaluated (marginal and conditional R2, and residual plots) using the sjPlot package (Lüdecke, 2021). Marginal effects were obtained using the ggefects package (Lüdecke, 2018).
2.6.2 Forest estimationsIn the MF and SDTF, for which data were available, the number of bromeliads, bromeliad biomass, and TL was modelled as a function of tree size (DBH) and site using linear models. Through these models, we predicted the mean and the 95% CIs for every tree with tank bromeliads in the plots in each site. Afterward, we estimated bromeliad abundance, biomass, and TL in the plots and then extrapolated to 1 ha. Moreover, we estimated the annual litter captured by tank bromeliads in these two forests. To do this, we first modelled PA as a function of plant mass (Figure S5) and then estimated the PA of the collected bromeliads. Later, we modelled bromeliad PA as a function of tree size and site (Figure S6). Using this model, we obtained the bromeliad PA for every tree with tank bromeliads in the plots. Subsequently, we estimated the total bromeliad PA area in the plots and extrapolated it to 1 ha. Finally, we extrapolated the amount of litter captured in 1 m2 of PA of bromeliads (non-replaced plants in the MF and SDTF) to the total PA per hectare for each forest. For all the linear models, independent and response numeric variables were log-transformed.
Residence times were calculated assuming that the systems (bromeliads) were in a steady-state (inputs and outputs are equal) using the following equation (Frissel, 1981): (2)
3 RESULTS
3.1 Forest litterfall
(2)
3 RESULTS
3.1 Forest litterfall
Annual litterfall was by far the highest in the MF (13 Mg ha−1 yr−1) followed by CF–C (8.6 Mg ha−1 yr−1), TOF (8.5 Mg ha−1 yr−1), SDTF (7.1 Mg ha−1 yr−1), and CF–Z (6.0 Mg ha−1 yr−1). In all forests, litterfall showed a strong seasonality characterized by one or two distinct peaks (percentage of the highest monthly litterfall, Figure 2a). In the SDTF and TOF, the litter peaks occurred during the warm dry season, in both CFs in the cold dry season, and in the MF, one occurred during the dry season in April and another one during the northerly winds season in November (Figure 2a).

Seasonality (line charts) and leaf litter composition by species (bar charts) of forest litterfall (a) and litter trapped by tank bromeliads (b) in five different forests. Mangrove forest (MF), semi-deciduous tropical forest (SDTF), tropical oak forest (TOF), and cloud forest (CF). The numbers between brackets represent the elevation (m) of each forest
Leaves accounted for most of the litter, contributing 60–79% (Figure S7a), and in the five forests, 67 to almost 100% of leaf litter stemmed from few dominant tree species (Figure 2a). Typically, Quercus leaves dominated, except in the mangrove (Figure 2a). Twigs and bark contributed 7–17% to the litterfall, and all other categories contributed 13–29%. Among the category “others,” detritus was the main component followed by fruits and seeds, and somewhat minor contributions of flowers, epiphytes, and non-vascular epiphytes (Figure S7a).
3.2 Bromeliad litter captureMost of the litter was captured by bromeliads in the dry season (cold and warm, 57–67%) during the period of highest litterfall (January–May), except in the MF, where they captured litter more evenly throughout the year (Figure 2b). The composition of the litterfall trapped by bromeliads was similar to the forest as a whole, leaves contributed 63–79%, twigs and bark 7–22%, and other categories 10–24% (Figure S7b). Quercus trees were the main leaf litter source for bromeliads (ca. 60% of bromeliads were relocated on Quercus), except in the mangrove, where mangrove leaves represented approximately three-quarters of all the trapped litterfall (Figure 2b).
According to the minimum adequate LME, PA had a significant, positive effect on BLC (χ2 = 80.4, df = 1, p < .001, Figure 3a) and the interaction between month and site was also significant (χ2 = 440, df = 44, p < .001, Figure 3b). The fixed effects of our model explained 46% of the BLC variance, and both fixed and random effects explained 75% (Table S2).

Marginal effects of projected plant area (a) and the interaction between month and site (b) on bromeliad litter capture. Estimates were obtained from the reduced linear mixed-effects model fitted with PA, site, month, and their double interactions as fixed effects and bromeliad species and ID as random effects, 95% CIs are represented with a band (a) and dashed lines (b). Mangrove forest (MF), semi-deciduous tropical forest (SDTF), tropical oak forest (TOF), and cloud forest (CF). The numbers between brackets represent the elevation (m) of each forest
3.3 Tank litterOur Gamma GLME showed a significant effect of PA (χ2 = 94.9, df = 1, p < .001) and bromeliad species identity (χ2 = 41.6, df = 2, p < .001) on tank litter (TL). According to this model, TL increased exponentially with PA, fastest in T. fasciculata, followed by T. limbata and most slowly in A. bracteata (Figure 4). Bromeliad species and PA explained 65% of TL variance, while fixed and random effects explained 66%. When species were not considered in the model (Figure 4), the residual deviance increased significantly (χ2 = 40.2, df = 2, p < .001), and the fit of the model decreased according to Akaike's information criterion (Table S3). However, the explanatory power of this reduced model was still moderate, with PA explaining 41% of TL variance, and fixed and random effects explaining 58%. According to the LME fitted with the distance from bromeliads to the ground (DG) and plant mass set as fixed covariates, TL increased with plant mass (t = 21.75, p < .001) but there was no significant effect of DG on TL (t = .05, p = .96; Table 1).

Relationship between tank litter mass and projected plant area per bromeliad species. The regression lines were obtained from a Gamma general linear mixed-effects model fitted with a log link function and tree set as a random effect. Bands show 95% CIs. The model fitted excluding bromeliad species identity is represented by the dashed line
TABLE 1. Effect of plant mass and distance to the ground (DG) on tank litter mass Coefficients Estimate SE t value p (>|t|) (Intercept) −4.90 0.38 −12.98 <.001*** DG 0.002 0.03 0.05 .96 log plant mass 1.24 0.06 21.75 <.001*** Random effects σ2Residual 0.73 σ2 Tree 0.42 Observations 336 Marginal R2/Conditional R2 0.59/0.74 Note Coefficients significant at p < .001 (***). Notice that the response variable (tank litter) was log-transformed. Standard error (SE). 3.4 Forest estimationsThe number of bromeliads increased log-linearly with tree size (DBH, t = 4.4, p < .001) and with a difference of 0.94 between site intercepts (t = 2.8, p = .01), with trees in the SDTF hosting significantly more bromeliads than in the MF (Figure 5a). Bromeliad biomass also increased log-linearly with tree size (t = 5.1, p < .001) with no site difference (t = .29, p = .78, Figure 5b). Tank litter followed the same patterns increasing log-linearly with tree size (t = 5.1, p < .001) and with no effect of site (t = 1.4, p = .18, Figure 5c). Tank bromeliads had a total projected ground cover of 1.6 and 3.5% and trapped ca. 1 (CI 95%, 0.5–2%) and 2.4% (CI 95%, 1–5%) of the annual litterfall in the MF and the SDTF, respectively. Carbon and nutrient pools and fluxes estimations for both compartments (bromeliads biomass and TL) and sites (MF and SDTF) are presented in Table 2 and Figure 6.

Relationship between tree size (DBH) and bromeliad abundance (a, p < .001, R2 = 0.74), bromeliad biomass (b, p < .001, R2 = 0.58), and tank litter mass (c, p < .001, R2 = 0.59) in the mangrove (MF) and semi-deciduous tropical forest (SDTF). The solid lines represent the linear models and bands show 95% CIs
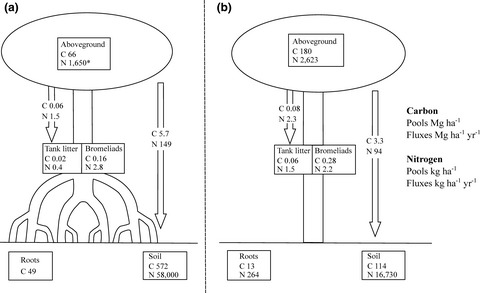
TABLE 2. Mean bromeliad abundance, and carbon and nutrient pools per bromeliad compartment (± 95% CI) Mangrove forest Semi-deciduous tropical forest Bromeliads (individuals ha−1) 2,741 (1,452–5,156) 12,281 (7,096–21,297) Bromeliad tissue (kg ha−1) Dry mass 356 (133–993) 578 (237–1,422) C 162 (61–452) 277 (114–681) N 2.8 (1.1–7.8) 2.2 (0.9–5.4) P 0.4 (0.1–1.1) 0.2 (0.1–0.4) K 6.9 (2.6–19.2) 4.6 (1.9–11.2) Na 4.9 (1.8–13.6) 1.3 (0.5–3.3) Ca 2.1 (0.8–5.8) 2.5 (1.0–6.3) Mg 1.1 (0.4–3.0) 1.2 (0.5–2.8) Tank litter (kg ha−1) Dry mass 37.0 (13–104) 112 (47–272) C 18.0 (6.3–50.7) 56.6 (23.8–137.6) N 0.4 (0.1–1.1) 1.5 (0.6–3.6) P 0.03 (0.01–0.07) 0.06 (0.02–0.14) K 0.2 (0.1–0.5) 0.2 (0.1–0.5) Na 0.3 (0.1–0.8) 0.3 (0.1–0.7) Ca 0.9 (0.3–2.6) 2.8 (1.2–6.9) Mg 0.1 (0.05–0.4) 0.2 (0.1–0.4) Estimated pools (boxes) and annual fluxes (arrows) of carbon and nitrogen in the mangrove (a) and the semi-deciduous tropical forest (b). Aboveground, roots, and soil pools for semi-deciduous tropical forests were taken from Jaramillo et al. (2011), and for the mangrove from López-Portillo, J., Lara-Dominguez, A.L., Bravo, M., and Aguirre, L. (2020, unpublished). *Aboveground nitrogen in the mangrove was calculated using the C:N ratios reported by Twilley et al. (1986)
4 DISCUSSION
4.1 Forest litterfall and trapped litter along the elevation gradient
Estimated pools (boxes) and annual fluxes (arrows) of carbon and nitrogen in the mangrove (a) and the semi-deciduous tropical forest (b). Aboveground, roots, and soil pools for semi-deciduous tropical forests were taken from Jaramillo et al. (2011), and for the mangrove from López-Portillo, J., Lara-Dominguez, A.L., Bravo, M., and Aguirre, L. (2020, unpublished). *Aboveground nitrogen in the mangrove was calculated using the C:N ratios reported by Twilley et al. (1986)
4 DISCUSSION
4.1 Forest litterfall and trapped litter along the elevation gradient
The mangrove was by far the ecosystem with the highest litterfall, followed by forests located between 1,000 and 1,650 m a.s.l, where the annual litterfall during the study was above the mean value reported from tropical evergreen, and tropical rain-green forests worldwide (i.e., 7 Mg ha−1 y−1) (Zhang et al., 2014). In this region, forests at intermediate elevations also show the highest richness and abundance of vascular epiphytes including bromeliads, which dominate the epiphyte assemblages (Guzmán-Jacob et al., 2020; Hietz & Hietz-Seifert, 1995). This pattern could be the result of mild temperatures and high humidity and litterfall at mid-elevations (Table S1), which may provide abundant nutrients to tank bromeliads and increase nutrient release in the tanks (Aguilar-Cruz et al., 2020). In these productive seasonal forests, litter may rapidly accumulate in tank bromeliads during the litterfall peaks in the dry season, when some decomposers such as stigmatid mites and springtails can be abundant (Castaño-Meneses, 2016). However, most of the nutrients would be mineralized during the wet season when tanks alternate between flooded and dry cycles and litter decomposition increases (Aguilar-Cruz et al., 2020; Zotz & Thomas, 1999). In the upper part of the gradient (>2,000 m), litterfall and decomposition decrease (Aguilar-Cruz et al., 2020), and these factors probably contribute to non-suitable conditions to maintain a litter-trapping strategy. Decomposition is probably too slow and litterfall too scanty to sustain warm-season growth, and coupled with sub-freezing temperatures may reduce the richness and abundance of bromeliads species with tanks (Benzing, 2000; Hietz & Hietz-Seifert, 1995; Zona & Christenhusz, 2015).
Invariably, litterfall along the elevation gradient was mainly composed of leaves and twigs (including bark), and their contributions (leaves 60–79%; twigs 7–17%) being very similar to those reported for litterfall in forest ecosystems worldwide (leaves 64–73%; twigs 17%) (Zhang et al., 2014). Considering that litter captured by bromeliads followed these general proportions as well, leaves, especially from trees, are the main litter source for tank bromeliads located in the understory, and probably, they are also the most important energy source for their associated food webs (Farjalla et al., 2016). Vascular epiphytes (including bromeliads), however, represented <5% of the BLC, suggesting little recycling of nutrients. This result contrasts with previous findings of fine litter deposited in the canopy of a cloud forest in Costa Rica, where 35% of the canopy standing leaf litter was epiphytic in origin, indicating higher nutrient reuse within the epiphyte community rooted in arboreal soil (Nadkarni & Matelson, 1991).
4.2 Bromeliad litter capture and tank litterProjected plant area is a frequently used morphological trait to predict BLC and TL because it reflects not only plant size but also the area for litter interception (Castaño-Meneses, 2016; Ospina-Bautista & Estévez Varón, 2016; Richardson, 1999; Richardson et al., 2000). However, this variable and other morphological traits such as sheath length, and leaf number have only poorly explained litter capture by bromeliads (ca. 30% of the variance) (Ospina-Bautista & Estévez Varón, 2016). Unsurprisingly, the results of our LME confirmed a positive effect of PA on BLC, and a significant interaction between month and site, which reflects the differences in litterfall seasonality among forests. Although this model included not only the morphological trait PA, but also temporal (month) and spatial (site) variables, and it accurately predicted temporal patterns of BLC in the different forests (Figures 2b and 3b), the fixed effects explained less than half of the BLC variance (46%). Contrastingly, when we controlled the non-independence of individual plants and species by including these variables in the random effects, the model explained 75% of the variance. These results highlight the importance of including not only the intraspecific but also the interspecific variation in the future models that seek to predict the litter capture by bromeliad communities.
Unlike BLC, up to 90% of the TL variance can be explained by PA in bromeliads of the same species or with similar morphologies (Castaño-Meneses, 2016; Richardson, 1999). Although the relationship between PA and TL can also be species-specific, it has been used to estimate TL pools at the ecosystem level without considering species differences (Richardson et al., 2000). Our results showed that species identity has a significant effect on TL and therefore should be included in the models whenever possible, especially in studies that use bromeliads as food webs models and require accurate estimates of carbon and nutrients per plant. However, models that only include PA as a predictor can still arrive at reasonable estimates to forecast TL forest pools, particularly when variation among trees is considered. These findings are consistent with those of a previous study on water relations in tank bromeliads: Ontogenetic changes in plant size are more important than species identity for tank capacity, allowing the
留言 (0)