
記住我


Progressive supranuclear palsy (PSP) and corticobasal degeneration (CBD) are sporadic, progressive neurodegenerative diseases, collectively termed tauopathies.[1, 2] PSP typically presents with levodopa-unresponsive parkinsonism, postural instability, frequent falls, vertical supranuclear gaze palsy and cognitive impairment, with the most common presentation referred to as Richardson syndrome (RS).[3] Prototype clinical features of CBD include asymmetric rigidity and apraxia, parkinsonism, dystonia, myoclonus, cortical sensory loss, dystonia and cognitive impairment, referred to as corticobasal syndrome (CBS).[4] In addition to typical presentations, both PSP and CBD can present with RS, CBS, behavioural variant frontal dementia and progressive non-fluent aphasia.[1, 2] This clinical overlap makes a clinical diagnosis of tauopathy challenging; thus, autopsy is indispensable to confirm a diagnosis.
PSP and CBD show similar tau pathology characterised by numerous neuronal and glial lesions composed of pathological aggregates of insoluble tau protein in the grey and white matter of the neocortex, basal ganglia, diencephalon and brainstem.[5-7] Neuronal loss and atrophy in the subthalamic nucleus, red nucleus and cerebellar dentate nucleus are more frequent and severe in PSP compared to CBD.[5] While tau pathology occurs predominantly in hindbrain structures in PSP, tau pathology in CBD occurs predominantly in forebrain structures.[8, 9] The distinct morphology of astrocytic lesions is also helpful in distinguishing two diseases.[5, 10] The tufted astrocyte is characteristic for PSP: a radial arrangement of thin, long, branching accumulation of tau in the proximal processes of astrocyte.[6, 7] The astrocytic plaque is a pathognomonic lesion in CBD and is an annular cluster of short and stubby processes of astrocytes.[5] Even though the two diseases have different distributions and morphologic features of tau pathology, the neuropathologic diagnosis of PSP and CBD is sometimes challenging because the distribution pattern of neurodegeneration and tau lesions overlap.[7, 9, 11, 12]
With advances in machine learning, the application of computer-aided diagnosis is a promising technology to assist diagnostic decision-making.[13, 14] Several machine learning methods based on deep learning, such as image classification and object detection, have been applied in the fields of radiology, pathology and other specialties [15-20]; however, due to the “black box” nature of deep learning, it is difficult to interpret the results from deep learning, which may limit their use in decision-making in clinical practice.[21] A decision tree is a promising method to overcome this problem.[22] A decision tree is a machine learning method that separates outcomes based on the statistical significance, displayed as a probability tree. A recent study has shown that a machine learning-based decision tree using CSF biomarkers showed a higher diagnostic accuracy of Alzheimer's disease (AD) compared with a traditional cut-off.[23] The advantage of this technique is the “white box” nature; clinicians are able to interpret the output of the machine learning algorithm and use the results as a flowchart.
The present study aimed to demonstrate that the topographical distribution and severity of tau pathology, rather than the morphology of astrocytic tau lesions or other pathological features, are sufficient to distinguish between PSP and CBD. To achieve this, we performed hierarchical cluster analysis using semi-quantitative scores of tau lesions in select brain regions from PSP and CBD. In addition, we constructed machine learning-based decision tree classifiers to identify the most decisive predictive factor and provide a simple flowchart for diagnosis.
MATERIALS AND METHODS Case selection and ethical approvalAll brain tissues used in this study were from the Mayo Clinic brain bank collected between 2000 and January 2020. In this period, 1411 cases and 261 cases have been given a neuropathologic diagnosis of PSP and CBD respectively. Cases with known MAPT mutations were excluded. Any case with missing data for at least one neuroanatomical region for a given tau pathology score were excluded from the study. The remaining 1219 cases, consisting of 1020 PSP and 199 CBD, were included in the study. For the validation study, 10 consecutive cases of either PSP or CBD between June and August 2020 were selected. Demographic information and clinical diagnoses were extracted from medical records and a questionnaire filled out by a family member. Clinical diagnoses of all cases were divided into three categories: RS, CBS and others (i.e., PSP-parkinsonism, frontotemporal dementia, AD, dementia with Lewy bodies, aphasia and PSP-pure akinesia with gait freezing) based on available clinical information.[2, 4] Brain autopsies were performed after consent of the legal next-of-kin or individuals with power-of-attorney to grant consent. De-identified studies of autopsy samples are considered exempt from human subject research by the Mayo Clinic Institutional Review Board.
Neuropathologic assessmentFormalin-fixed brains underwent systematic and standardised sampling with neuropathologic evaluation by a single, experienced neuropathologist (DWD). Regions sampled on all cases included six regions of neocortex, two levels of hippocampus, a basal forebrain section that includes amygdala, lentiform nucleus and hypothalamus, anterior corpus striatum, thalamus at the level of the subthalamic nucleus, midbrain, pons, medulla and two sections of cerebellum, one including the dentate nucleus. Paraffin-embedded 5-μm thick sections mounted on glass slides were stained with haematoxylin and eosin and thioflavin S. Braak neurofibrillary tangle (NFT) stage and Thal amyloid phase were assigned based upon lesion density and distribution with thioflavin S fluorescent microscopy according to published criteria.[24, 25] For Braak NFT stage, sections from the entorhinal cortex (stage II), the pyramidal layer of the CA1 subsector of the hippocampus (stage III), temporal cortex (stage IV), frontal cortex (stage V) and primary visual cortex (stage VI) were used. For Thal amyloid phase, sections from the frontal cortex (phase 1), the pyramidal layer of the CA1 subsector of the hippocampus (phase 2), putamen (phase 3), CA4 subsector of the hippocampus (phase 4) and the molecular layer of the cerebellum (phase 5) were used. The neuropathological diagnosis of AD was based on the consensus criteria for the neuropathologic diagnosis of AD.[26]
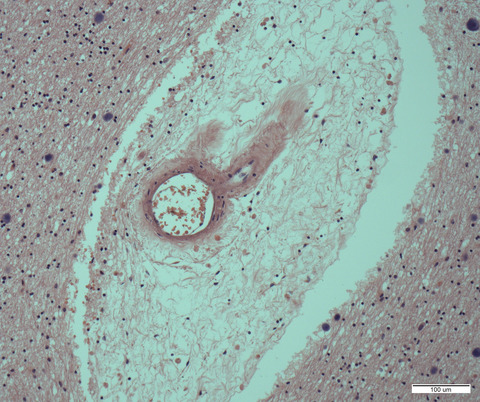
Immunohistochemistry for phospho-tau (CP13, Ser202, mouse monoclonal, 1:1000, from the late Dr Peter Davies, Feinstein Institute, North Shore Hospital, NY) was performed using a DAKO Autostainer (Universal Staining System, Carpinteria, CA) to establish a neuropathological diagnosis of PSP and CBD.[5-7] The severity of tau pathology, which included NFTs (including pretangles), coiled bodies, astrocytic lesions (including tufted astrocytes and astrocytic plaques) and tau threads, was graded semi-quantitatively on a four-point scale (0 = absent, 1 = mild, 2 = moderate, 3 = severe) by an experienced neuropathologist (DWD) in eight brain regions: temporal cortex, motor cortex, caudate nucleus, globus pallidus, subthalamic nucleus, red nucleus, substantia nigra and midbrain tectum. Representative images of tau pathology scores in each lesion type are shown in Figure 1.

Representative images of tau pathology scores in CP13-immunostained slides. Images of NFT, tau threads and astrocytic plaques are from the motor cortex in CBD cases. Images of tufted astrocytes are from the caudate nucleus, and images of coiled bodies are from the motor cortex in PSP cases. All images are the same magnification. Scale bar =100 μm
Immunohistochemistry for phospho-tau (AT8, Ser202/Thr205, mouse monoclonal, 1:1000, Invitrogen) was also performed in select cases using the sections of caudate nucleus to show similarity with CP13 (Figure S1).
Hierarchical cluster analysisHierarchical cluster analysis using Euclidean distance and average linkage clustering was performed on patients and region-specific variables reflecting the tau pathology scores in eight brain regions in 1219 cases. A heatmap was generated to visualise hierarchical clustering using the “pheatmap package” in R 3.4.3 (The R Foundation for Statistical Computing, Vienna, Austria).
Machine learning-based decision tree classifierA decision tree classifier was created using the “scikit-learn” Python module.[27] Classification and regression tree algorithm and Gini impurity measure were used to construct decision trees. A total of 1219 cases were randomly divided into a training set (914 cases; 75%) and a testing set (305 cases; 25%). The target variable was the pathological diagnosis (i.e., PSP and CBD). The dependent variables were the tau pathology scores in eight brain regions.
Validation studyFor further validation of the decision tree, three investigators (SK, XZ and DWD), who have different levels of experience in neuropathologic research in tauopathy, blindly assessed tau pathology scores of select brain regions in ten most recent cases of either PSP or CBD (validation set). For scoring, each investigator separately reviewed glass slides under a microscope, rather than using digital images. The diagnosis of PSP or CBD was made based only on the tau pathology scores and the decision tree classifier.
Statistical analysisAll statistical analyses were performed using R 3.4.3. Fisher's exact test was performed for group comparisons of categorical data, as appropriate. Mann-Whitney rank sum test and student t-test were used for analyses of continuous variables as appropriate. p-values < 0.05 were considered statistically significant.
RESULTS Cohort summaryThe demographic and clinicopathologic features of 1020 PSP and 199 CBD cases are summarised in Table 1. Patients with PSP were significantly older than those with CBD (75 ± 8 vs. 70 ± 8 years; p < 0.001). Although the frequency of concurrent neuropathologic diagnosis of AD was not significantly different in PSP and CBD (10% vs. 6%; p = 0.076), the medians of Braak NFT stage (2.5 vs. 2; p = 0.002) and Thal amyloid phase (1 vs. 0; p ≤ 0.001) were significantly higher in PSP than in CBD. The symptomatic duration of PSP was longer than that of CBD (7 vs. 6 years; p < 0.001). The majority of PSP patients (82%) were given a clinical diagnosis of RS, followed by CBS (8%). In contrast, the clinical diagnosis of CBD was more heterogeneous: CBS in 37%, RS in 36% and others in 28%.
TABLE 1. Demographic and clinicopathologic features of PSP and CBD casesPSP
N = 1020
CBD
N = 199
p value Male, No. (%) 530 (52%) 103 (52%) 0.936 Age at death, years 75 ± 8 70 ± 8 <0.001 Brain weight, g 1140 ± 150 1110 ± 140 0.006 Concurrent AD 97 (10%) 11 (6%) 0.076 Braak neurofibrillary tangles stage II (II, III) II (I, III) 0.002 0 116 (11%) 27 (14%) I 111 (11%) 27 (14%) II 336 (33%) 80 (40%) III 282 (28%) 44 (22%) IV 154 (15%) 18 (9%) V 12 (1%) 1 (1%) VI 9 (1%) 2 (1%) Thal amyloid phase 1 (0, 3) 0 (0, 2) <0.001 0 452 (44%) 111 (56%) 1 154 (15%) 35 (18%) 2 99 (10%) 23 (12%) 3 220 (22%) 25 (13%) 4 56 (6%) 2 (1%) 5 39 (4%) 3 (2%) Disease duration, years 7 ± 3 6 ± 2 <0.001 Clinical diagnosis <0.001 RS 836 (82%) 71 (36%) CBS 77 (8%) 73 (37%) Other 107 (11%) 55 (28%) Data are displayed as n (%), mean ± SD and median (25th, 75th range). Hierarchical cluster analysisHierarchical cluster analysis based on regional semi-quantitative tau pathology scores in 1020 PSP and 199 CBD cases were performed. The results are shown as a heatmap in Figure 2. This heatmap indicates tau pathology scores from white (score =0) to red (score =3). Each row represents the lesion types in a given brain region, and each column represents an individual case. The first cluster contained only CBD cases (Cluster 1), while the second one contained all PSP cases and six CBD cases (Cluster 2). This indicates that PSP and CBD were clearly separated based on the severity and distribution of tau pathology. For further analysis, Cluster 2 was subdivided into four clusters (2–1, 2–2, 2–3 and 2–4).

Heatmap and hierarchical clustering based on tau pathology in 1020 PSP and 199 CBD cases. The heatmap reflects the severity of tau pathology, and a colour scale is given at the top right. Each tau lesion type in a brain region is represented with rows, and each case is represented with columns. Two distinct clusters are identified by hierarchical clustering. The left cluster (Cluster 1) mainly contains CBD cases as shown in orange in the pathology label, while the right cluster (Cluster 2) mainly contains PSP cases as shown in blue in the pathology label. Cluster 2 can be divided into four clusters (Cluster 2–1, 2–2, 2–3 and 2–4). Pathologically confirmed CBD cases in Cluster 2 are noted as #1-6. Note that Case 3 is located at the left end in Cluster 2–2. Abbreviations: AD, Alzheimer's disease; Astro, astrocytic tau lesions; Caudate, caudate nucleus; CB, coiled bodies; CBD, corticobasal degeneration; CBS, corticobasal syndrome; GP, globus pallidus; MBT, midbrain tectum; NFT, neurofibrillary tangle; Red, red nucleus; MBT, midbrain tectum; Motor, motor cortex; PSP, progressive supranuclear palsy; RS, Richardson syndrome; SN, substantia nigra; STN, subthalamic nucleus; Temp, temporal cortex; Threads, tau positive threads
Some striking differences in the distribution of tau pathology were observed between the clusters. Astrocytic tau lesions in the midbrain tectum and coiled bodies in the globus pallidus, subthalamic nucleus, red nucleus and midbrain tectum were less severe in Cluster 1 than Cluster 2. NFT and tau threads in the caudate nucleus were more severe in Cluster 1 than Cluster 2. Coiled bodies, tau threads, NFT and astrocytic tau lesions in the temporal cortex were more severe in Cluster 1 than Cluster 2, except Cluster 2–2. Astrocytic tau lesions in the globus pallidus, substantia nigra, subthalamic nucleus and red nucleus were much less severe in Cluster 1 than Cluster 2, except Cluster 2–4. Cluster 2–2 had a higher burden of tau pathology in the temporal cortex than other clusters (i.e., 2–1, 2–3 and 2–4). Cluster 2–4 had less severe astrocytic pathology in the globus pallidus, substantia nigra, subthalamic nucleus and red nucleus, compared with other clusters (i.e., 2–1, 2–2 and 2–3).
Table 2 compares demographic and clinicopathologic features among these sub-clusters of Cluster 2. Cluster 2–2 had several differences compared to other clusters; age at death (81 ± 7 years) was significantly older, the frequency of AD (53%) was significantly higher and the frequency of clinical diagnosis of RS (69%) was significantly lower than other clusters. The breakdown of other clinical diagnoses is given in Table S1.
TABLE 2. Demographic and clinicopathologic features of cases in Cluster 2 Cluster 2–1 Cluster 2–2 Cluster 2–3 Cluster 2–4 p value Number of cases 568 105 204 149 Male, No. (%) 306 (54%) 49 (47%) 102 (50%) 76 (51%) 0.666 Age at death, years* 73 ± 7 81 ± 7 76 ± 7 77 ± 8 <0.001 Pathologic diagnosis of PSP 566 (99%) 103 (98%) 204 (100%) 147 (99%) Concurrent AD** 21 (4%) 56 (53%) 9 (4%) 11 (7%) <0.001 Clinical diagnosis*** <0.001 RS 483 (85%) 71 (68%) 179 (88%) 105 (70%) CBS 40 (7%) 15 (14%) 8 (4%) 17 (11%) Other 45 (8%) 19 (18%) 17 (8%) 27 (18%) Data are displayed as n (%), mean ± SD and median (25th, 75th range). *Age is significantly different between all clusters except Clusters 2–3 and 2–4. **The frequency of concurrent AD is significantly different between Cluster 2–2 and all other clusters. ***The frequency of clinical diagnosis is significantly different between Clusters 2–1 and 2–2; and Clusters 2–2 and 2–3. Pairwise comparison is done using Bonferroni correction.Six autopsy-confirmed CBD cases were included in Cluster 2: two cases in Cluster 2–1, two cases in Cluster 2–2, and two cases in Cluster 2–4. Clinicopathologic features are shown in Table S2. Although they were included in the PSP-predominant cluster, all cases had astrocytic plaques, confirming the neuropathologic diagnosis of CBD (Figure S2). Cases in Cluster 2–1 and cluster 2–4 were characterised by less severe tau pathologies in the temporal cortex, while cases in Cluster 2–2 were characterised by more severe tau pathologies in the midbrain tectum (Figure S2). Four of them were clinically diagnosed with CBS, and the other two were diagnosed with PSP-RS.
Decision tree classifiersThe cluster analysis showed that several tau pathology scores, such as the tau threads in the caudate nucleus, can help distinguish PSP and CBD. To determine the minimum combination of parameters that can distinguish the two diseases, we next built machine learning-based decision tree classifiers.
When only one decision node was used to construct a tree (depth of the tree =1), a score of tau threads in the caudate nucleus showed the highest accuracy. As shown in Figure 3A, of 914 cases in a training set (152 CBD and 762 PSP), 743 cases (7 CBD and 736 PSP) had the score <3 and 171 cases (145 CBD and 26 PSP) had the score 3. This indicates that 736 PSP and 145 CBD were correctly categorised in each diagnosis; thus, the accuracy of training set was 96.3% (881/914). In cross-validation, this decision tree correctly classified 298 out of 305 cases in a testing set (97.7% accuracy).

Decision tree for the diagnosis of PSP and CBD. The colour of nodes indicates the diagnosis: blue =CBD, orange =PSP. The darker colour indicates higher proportion of each disease. (A) A decision tree with the maximum depth of 1. Of 914 cases (762 PSP and 152 CBD) in a training set, 881 cases are correctly classified (accuracy =96.3%). (B) A decision tree with the maximum depth of 3. Of 914 cases, 903 cases are correctly classified (accuracy =98.8%). Abbreviations: Caudate, caudate nucleus; GP, globus pallidus; MBT, midbrain tectum; NFT, neurofibrillary tangle; RN, red nucleus; STN, subthalamic nucleus
To improve the diagnostic accuracy of decision tree classifiers, we increased the number of decision nodes by increasing the maximum depth of decision trees. Figure 3B shows a decision tree with a depth of 3, which contained 7 decision nodes. The root node used the score of tau threads in the caudate nucleus. Most PSP cases had a score of <3, so they selected the “True” path. In the second layer, the decision node asked whether the coiled body score in the subthalamic nucleus was 0. The majority of PSP cases had coiled bodies in this region, so they chose the “False” path. In the third layer, the decision node determined whether the coiled body score in the red nucleus was 0. Almost all PSP cases had coiled bodies in this region, so they chose the “False” path and arrived at the leaf node as a PSP (719 PSP and 1 CBD). This is the main pathway for most PSP cases. When the coiled bodies score was 0 in the subthalamic nucleus in the second layer, then the node in the third layer asked whether the score of tau threads in the globus pallidus. The diagnosis of PSP was made if the score was lower than 2, and the diagnosis of CBD was made if the score was 2 or 3. The majority of CBD cases (and a few PSP cases) selected the “False” path at the root node because almost all CBD cases had a score of 3 for the tau threads in the caudate nucleus. In the second layer, the majority of CBD cases answered “True” at the decision node, asking whether a score 0 for astrocytic tau in the red nucleus. Finally, these cases were asked whether having a coiled body score of <3 in the midbrain tectum. Most CBD cases selected the “True” path and arrived at the leaf node as a CBD class. If the score of astrocytic tau in the red nucleus was higher than 0 in the second layer, then the next node asked the score of NFT in the caudate nucleus. The diagnosis of PSP was made if the score was lower than 3, and the diagnosis of CBD was made if the score was 3. As shown in Figure 3B, 903 out of 914 cases in a training set were correctly categorised as PSP or CBD (98.8% accuracy). In cross-validation, this decision tree correctly classified 302 out of 305 cases in a testing set (99.0% accuracy).
As maximum depth increases, both training and testing scores increased. The decision tree achieved the best testing score of 0.997 when the maximum depth was 6 (data not shown). Table 3 summarises the training and testing scores of the decision tree classifier in each maximum depth.
TABLE 3. Training and testing scores of decision tree classifiers in each maximum depth Maximum depth Training score Testing score 1 0.963 0.977 2 0.978 0.987 3 0.988 0.990 4 0.997 0.993 5 0.998 0.993 6 1.000 0.997 7 1.000 0.997 Validation studyFor further validation of the decision tree, three investigators blindly assessed the tau pathology scores and made a diagnosis in 10 cases using a flowchart created by the diagnostic tree classifier (Figure 4). All the scores in six brain regions and final diagnoses are shown in Table 4. All three reviewers made a correct diagnosis in all cases, although the diagnostic path was different in the two cases. In Case 5, for instance, Reviewer 1 and 3 scored 3 in the caudate tau threads, but Reviewer 2 gave a score of 2. After the root node, Review 1 and 3 assessed astrocytic lesions in the red nucleus and coiled bodies in the midbrain tectum, while Reviewer 2 assessed coiled bodies in the subthalamic nucleus and tau threads in the globus pallidus. Nevertheless, the final diagnosis was CBD in all reviewers. This result indicated that despite some inter-rater differences, multiple nodes rescued the final diagnosis. The same result was observed in Case 9.

Diagnostic flowchart for PSP and CBD based on the decision tree classifier. Values indicate semi-quantitative tau pathology scores (0 = none; 1 = mild; 2= moderate; 3 = severe). *This class indicates PSP at 80% accuracy, so also consider CBD. **This class indicates CBD at 67% accuracy, so also consider PSP. Abbreviations: Caudate, caudate nucleus; GP, globus pallidus; MBT, midbrain tectum; NFT, neurofibrillary tangle; RN, red nucleus; STN, subthalamic nucleus
TABLE 4. Validation study by three investigators Case ID Reviewer Caudate: Tau threads STN: CB RN: CB RN: Astrocytes MBT: CBGP:
Tau threads
Dx 1 1 3 0 1 CBD 2 3 0 0 CBD 3 3 0 0 CBD 2 1 3 0 1 CBD 2 3 0 1 CBD 3 3 0 2 CBD 3 1 1 3 3 PSP 2 1 3 2 PSP 3 1 3 3 PSP 4 1 2 2 3 PSP 2 1 3 2 PSP 3 2 3 3 PSP 5 1 3 0 1 CBD 2
留言 (0)