
記住我
Social media have acquired a worldwide presence for attracting and holding human attention, and, according to some estimates, more than three-fourths of those who use the Internet actively participate in at least one social media platform.1 In fact, most social media users visit the respective sites at least once per day1; however, the epic reach and impressive availability of social media have had a mixed reception in academic medicine. Specifically, much of the focus in academic medicine has been on regulating the use of social media to avoid distractions from paid labor, to preclude the risk of posting confidential patient information or embargoed study results online,2 or to minimize the risk of harming individuals or institutions. The regulations have created barriers for using social media in academic medicine,2 and most physicians and academicians avoid participating in social media, citing time, effort, and lack of apparent value as the primary reasons.3 Efforts to validate any positive value for social media in academic medicine have been feeble at best.
The 2015 publication of the “Intention to Tweet” (ITT) study, sponsored in part by the journal Circulation and the American Heart Association, has reinforced reservations regarding the benefits of social media in academic medicine.4 In an effort to examine the added benefit of social media to scientific publications, the investigators selected 243 articles published in Circulation and its subsidiary journals to be randomized to either social media promotion or usual care. The results of this trial identified no benefit of social media promotion; however, the randomized treatments in this research may have been inadequately differentiated.
The aim of the current study was to test the hypothesis that social media promotion would increase the readership of an academic medical journal, measured primarily in website views at 0–30 days, and then at 31–60 days, after publication. To test this hypothesis, we studied 3 consecutive months’ worth of articles published in Mayo Clinic Proceedings (MCP), a large-circulation general/internal medicine journal, by quantifying article views and downloads during the 2 months following the date of each article’s publication. We randomized equal numbers of similar article types per month to either (1) a comprehensive, planned social media promotion strategy (SoMe group) or (2) no social media promotion (NoSoMe group).
MethodWe undertook this study in collaboration with the Mayo Clinic Center for Social Media, MCP, Elsevier (Amsterdam, the Netherlands), and the Mayo Clinic Department of Cardiovascular Medicine. We sought institutional review board approval, but because no human subjects were recruited, enrolled, or affected by the study, the board deemed ethical approval unnecessary for this trial. Authors on the planning committee (R.J.W., A.W., L.A.A., and T.C.G.) had access to the table of contents for MCP journal articles, designed and executed the randomization of articles, designed the social media posts for the distinct platforms, and collected and analyzed the data independent of the journal editors, journal staff, and Elsevier staff.
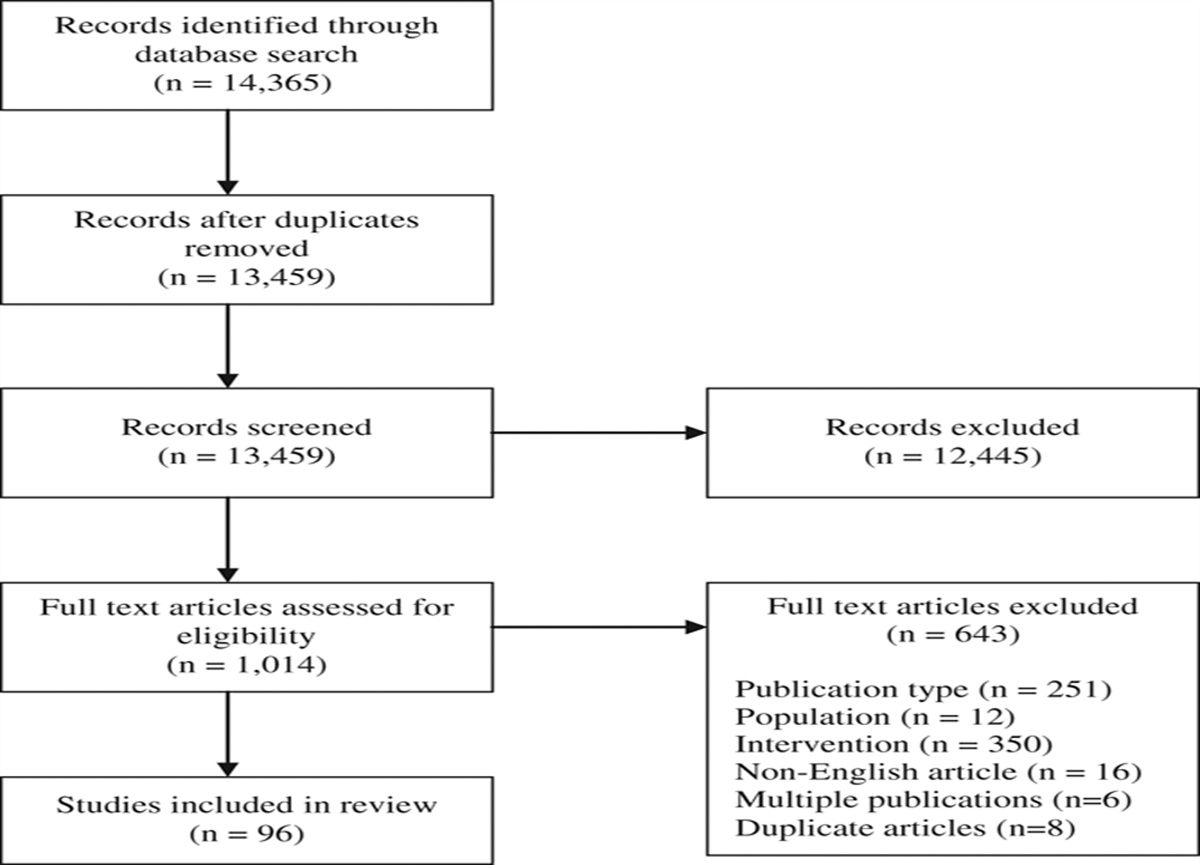
During the 4 months of October 2015 through January 2016, all MCP content published online was made open access and available free of charge. To avoid a confounding effect on the study outcomes, this open-access action was never publicized in any form. Traditional promotion of journal content by press releases or news media interviews was allowed to proceed as usual at the discretion of MCP editors or the authors’ home institutions. We randomized the articles in the trial in a single-masked fashion following simple randomization procedures (computerized random numbers) with a 1:1 allocation to SoMe versus NoSoMe groups on a per-month basis. The social media promotion began on the date of each article’s online publication. We allocated articles to the SoMe or NoSoMe group monthly as the table of contents was constructed in conjunction with each monthly issue. See Figure 1 for the general design of the randomization protocol.
 Figure 1:
 Study flow detailing article randomization and allocation to the social media strategy group versus the no social media strategy group, plus an outline of the data collection and analysis that followed.
Allocation concealment was selectively unmasked when the list of SoMe articles was delivered to Mayo Clinic’s Center for Social Media, where we generated social media messages through MCP social media accounts. We used the following existing social media accounts:
Elsevier Twitter (@ElsevierConnect; 20,603 followers at the time of final data collection [January 31, 2016]), Elsevier Facebook (Elsevier; 187,551 followers at the time of final data collection), Elsevier LinkedIn (Elsevier Company Page; 89,754 followers at the time of final data collection), MCP Twitter (@MayoProceedings; 1,418 followers at the time of final data collection), MCP Facebook (Mayo Clinic Proceedings; 1,548 followers at the time of final data collection), Mayo Clinic Twitter (@MayoClinic; 1,176,076 followers at the time of final data collection), Mayo Clinic Facebook (Mayo Clinic; 637,802 followers at the time of final data collection), and Mayo Clinic LinkedIn (Mayo Clinic Company Page; 65,400 followers at the time of final data collection).We selected these social media platforms to align with those used in the ITT trial4 and to follow the current social media practices of MCP and Elsevier.
We placed the articles randomized to the SoMe group into GatherContent (London, United Kingdom), an online content collaboration tool, which we used to organize the articles into individual entries. For each specific article, we constructed individual social media posts for Facebook (2 posts per month), Twitter (4 posts per month), and LinkedIn (1 post per month; we created 1 post for LinkedIn and posted it to each of the 2 LinkedIn accounts). Each article had 7 social media posts evenly distributed among the corresponding individual accounts listed above throughout the entire month. For each social media post, we used simple conversational English designed to convey the primary purpose of the article. We included images when available and used Bitly (New York, New York) to shorten web links. Messages were shortened to approximately 120 characters on Twitter to allow space for comments and replies. We released the posts throughout the month at different times of the day using best social media practices.5,6 We used Spredfast (Austin, Texas) to disseminate MCP and Elsevier posts and Sprinklr (New York, New York) to disseminate Mayo Clinic social media messages. We also used Unica (IBM, Armonk, New York) and Literatum (Atypon, Santa Clara, California) to measure individual website traffic and full-text article downloads of both SoMe and NoSoMe articles. See Figure 2 for study flow and timing.
 Figure 2:
 Study flow detailing the timing of the randomization, social media promotion, and data collection across the 120 days of the trial. The articles in the social media (SoMe) group were promoted through a planned social media strategy (7 total postings across 3 platforms in the 30 days following publication); the articles in the no social media (NoSoMe) group were not promoted through a planned social media strategy. The social media platforms used were Twitter, Facebook, and LinkedIn.
We counted page visits and full-text article downloads for 0 to 30 days following initial online publication and then from 31 to 60 days following online publication. The primary outcome assessed was the number of individual article website visits at 0–30 days following original publication (based on previous work4). Secondary outcomes included full-text article (PDF) downloads, MCP website views through Google searches or other nonpaid/promotional web-based searches (the latter referred to as organic searches), and article views through the 3 social media platforms (Twitter, Facebook, and LinkedIn)—assessed 0–30 days following the original online release of the article and again 31–60 days after publication. We collected final data for analysis 60 days after the posting of the last article in December 2015. Two authors (R.J.W. and T.C.G.), along with an independent biostatistician (J.M.), assessed the outcomes in a blinded fashion without knowledge of article randomization or allocation.
Additionally, we used data from the ISI Web of Knowledge proprietary website (https://apps.webofknowledge.com), which we accessed through the Mayo Clinic Libraries license, to evaluate the impact of upfront SoMe promotion on aggregated article citations from 2015 to 2017. We searched the ISI Web of Knowledge site in June 2018, immediately after the release of the most recent impact factor (based on 2017 calculations of articles published in 2016 and 2015). We used citation counts from 2017 because citations accrued beyond the second calendar year after the date of publication have no bearing on a journal’s 2-year impact factor. Two authors (R.J.W. and W.L.L.) searched and obtained citations, defined as the “Times Cited” on the ISI website, for each article in the study.
Two authors (R.J.W. and J.M.) analyzed all the data (the page view numbers, full-text article download numbers, Google search numbers, organic web-based search numbers, and ISI times cited) in an intention-to-treat fashion, meaning that all articles were analyzed as originally randomized independent of any changes made to the article or its publishing schedule after randomization. Here, we have presented the median counts and the count at the 25th and 75th percentiles. We have presented binary data as percentages. We have compared the outcomes between the SoMe and NoSoMe groups of articles using Wilcoxon rank-sum tests, and we have used signed rank tests for within-group comparisons of the number of views for 0–30 days and 31–60 days. In all cases, we considered 2-tailed P values < .05 to be statistically significant. We analyzed the data with SAS software (version 9.3, SAS Institute Inc., Cary, North Carolina). The study was initially powered incorporating 30 articles per group over 2 months, providing 80% power to detect a difference of 50 unique views assuming a standard deviation rate of 50% of the primary outcome.4
ResultsTypes of articles randomized to the SoMe versus NoSoMe groups are characterized in Table 1. Notably, we detected no differences in the groups—in total or on a per-month basis—in terms of article type. In addition, we detected no differences in traditional content promotion by press releases between the SoMe group (6 [18%]) and the NoSoMe group (4 [12%], P = .22; Table 1).
 Table 1:
 Articles by Type Randomized Into the SoMe or NoSoMe Groups for an RCT on the Effect of Promotion via Social Media on Access of Articles, 2015
Total website visits (Table 2) at 0–30 days were significantly higher in the SoMe group versus the NoSoMe group (1,070 median visits [25th percentile: 563; 75th percentile: 2,361] vs 265 [148; 570], P < .001) and at 31–60 days (194 median visits [62; 594] vs 69.5 [25; 161], P = .009). Similarly, full-text article downloads were significantly higher at 0–30 days in the SoMe group (1,042 median downloads [25th percentile: 497; 75th percentile: 2,133] vs 142 [50; 335] for the NoSoMe group, P <.001), and this pattern was sustained at 31–60 days (115 median downloads [31; 394] vs 21 [7; 150], P =.003). Organic search website visits (non-Google searches) were not different between the groups at 0–30 days after publication (17.5 median searches [25th percentile: 10; 75th percentile: 40] for the SoMe group vs 10.5 [9; 38] for the NoSoMe group, P = .41) or at days 31–60 after publication (5 median searches [1; 13] vs 5 [3; 13], P = .69). Google website searches were also not different between the 2 groups in days 0–31 (57.5 median searches [21; 110] for the SoMe group vs 29.5 [24; 97] for the NoSoMe group, P = .61) or in days 31–60 days after publication (15 [4; 29] vs 10.5 [8; 33], P = .65).
 Table 2:
 Website Visits, Organic Online Searches,a Google Searches, and Full-Text Article Downloads the Month of Publication and the Month Following Publication of 68 Articles in an RCT on the Effect of Promotion via Social Media on Access of Articles, 2015
Table 3 demonstrates the impact of individual social media channels on article views with each platform. Specifically, increases in SoMe-associated access to the MCP articles through the entire 60-day period were demonstrated with each platform as follows:
 Table 3:
 Number of Article Views With Social Media Promotion in the Month of Publication and the Month Following Publication for 68 Articles in an RCT on the Effect of Promotion via Social Media on Access of Articles, 2015
Twitter (90 median article views [25th percentile: 64; 75th percentile: 138] vs 1 median article view [0; 14], P < .001), Facebook (526 median article views [274; 1,194] vs 2.5 article views [1; 6], P < .001), and LinkedIn (31.5 median article views [12; 54] vs 0 [0; 1], P < .001).Despite the aforementioned positive effects of SoMe promotion on article views, survey of the ISI Web of Knowledge database revealed that the median “Times Cited” during 2015–2017 were not statistically different between the SoMe group (3.0 [0; 6]) and the NoSoMe group (3.0 [1; 9]; P = .66).
DiscussionThese results are among the first to demonstrate the value of a planned social media promotion strategy for academic medical publications, as assessed by website visits and full-text article downloads. We discovered that—with a proactively applied social media strategy—academic medical publications can reach broader audiences within the first 30, and up to 60, days after publication. Furthermore, the increase in website traffic and an increase in full-text article downloads for a publication occurs in concert with increased visits among the separate social media platforms of the journal, irrespective of the social media platform; that is, regardless of the social media channel, there is more positive attention for the article and journal. The difference in total visits (Table 2) outpaces the visits via social media posts (Table 3), reducing the likelihood that traditional or extraneous social media campaigns artificially drove the primary endpoints. Importantly, this increase in social media and web-based engagement was not congruent with an increase in organic Internet search visits or visits originating through Google, indicating that the increased traffic was directly related to the planned social media promotion strategy and that this increased traffic continued beyond the month of initial publication. Thus, academic medical journals should consider planning and implementing a social media promotional strategy to increase readership and propagate the dissemination of article content immediately following online publication.
Comparison with the ITT trialThese positive results from our research contrast with findings from the ITT trial.4 Fox and colleagues’ social media promotion research strategy for academic-journal content did not involve multiple posts on multiple social media platforms over multiple time periods. Instead, the investigators posted only once on Facebook and/or Twitter for each article published, for a total of no more than 2 posts per article4 (compared with 7 posts per article in our research). Given differences in study designs, comparisons of the 2 trials suggest a possible dose–response element to social media promotion. Specifically, with the comprehensive strategies we used in our trial—despite a smaller pool of articles randomized—we detected an impressive and statistically significant benefit to social media promotion (vs no social media promotion) over the initial 30 days following publication, and again 31 to 60 days following publication (even though we did no additional social media promotion during this second period).
Another difference in the methods between the 2 trials is that Fox and colleagues retained some element of social media promotion for articles assigned to the control group, whereas ours did not. Specifically, in the ITT trial, articles randomized to no social media promotion retained hyperlink social media promotion buttons on their website landing pages. These hyperlinks were removed during the trial period presented in our research.
These nuanced differences in study designs emphasize that research into social media promotions as applied to academic medical journals can be fraught with difficult-to-recognize intricacies that, in turn, confound research results and data interpretation. Perhaps collaborations involving research designers, experts in digital marketing, and social media experts—as employed in our research—could meaningfully improve future investigations, rendering them more rigorous and the results less ambiguous.
Comparison with other prior social media studiesLarge aggregates of retrospectively captured data that are used to assess the efficacy of social media platforms are termed “altmetrics.” Haustein and colleagues, whose research involved collecting these data, reported no obvious benefit of social media promotion on scientific academic publication citations.7 Their retrospective analysis of more than 1 million publications showed that only 21.5% of the articles had any presence on social media with an average of 0.78 tweets per article. Their findings, similar to ours, showed no strong correlations between social media and citations, which further supports that citations might not be dependent on social media promotion. While these data were collected from articles published in 2012, when social media promotion within academia was still in its infancy, Haustein and colleagues demonstrated that—without a planned social media strategy—the benefit of social media may only minimally augment the reach of academic medical publications.
Although employing a slightly different sampling of publications, Eysenbach reported that early social media metrics (Twitter search application programming interface) could predict future journal article citations.8 The articles chosen for his text sample were published in the Journal of Medical Internet Research. The human consumers of the examined articles were considered more likely to be knowledgeable in social media use (compared with the general population), and the chosen topics were considered especially amenable to rapid social media disbursement.8 As such, the outcomes of social media promotion of scholarly publications may be population-specific.
While the data from our study demonstrate an important ephemeral benefit of a planned social media promotion strategy on full-text article downloads and page views, we note no statistically significant impact on longer-term citations of these same articles. This finding somewhat contradicts the earlier findings by Eysenbach8; however, the aims and study designs of the 2 studies differed. We designed our research to emulate the ITT trial and to evaluate the immediate impact on article dissemination, and we did not review all the social media traffic on all the articles to study the long-term impact on citations. Perhaps future efforts should focus not only on tactics for short-term dissemination of the article but also on practices that create more social media traffic and conversations intended to spur later citations.
The findings we present here, along with the results of Xia and colleagues’ study, which demonstrated the effects of the use of Twitter by the audience of Nature,9 add to the burgeoning argument that social media promotions do add value to research publications in academic medicine.
Social media in general and specific social media promotion concepts are currently being applied to expand the reach of articles published in the cardiovascular literature. Specifically, a joint venture involving the Mayo Clinic Department of Cardiology and the American College of Cardiology has joined other communities of specialists, including oncology, radiology, radiation oncology, and urology, by introducing a hashtag ontology for cardiovascular disease topics in an effort to coalesce Twitter communications around common hashtags.10,11 To illustrate, those in the cardiology “twitterverse” can now efficiently share and search around common terms such as #AFib, #STEMI, and #TAVR. These efforts have helped to educate and attract more early-career physicians and fellows to social media12 and are likely to ensure an ongoing social media presence within academic medicine.
LimitationsDespite the positive outcomes we have demonstrated, our study has limitations. Certainly, the work involved only one academic medical journal, and the outcomes were based on a relatively small sample size with a heterogeneous set of articles. Nevertheless, the study was adequately powered, and the data revealed a statistically significant difference in article access associated with social media promotion. Whether the results of this study are generalizable remains unclear. This study should be repeated with multiple journals across an extended period of time in an attempt to validate our findings. Similarly, since we included only 0- to 30-day and 31- to 60-day data, whether the increase in social media interest (1) translates into longer interest in the promoted articles or (2) influences a journal’s impact factor remains unclear. Moreover, we noted a rapid decay in responses to social media posts in the ITT trial,4 which potentially strengthens the design of our trial in that confounding of article posts at different times throughout the month is likely minimal. In other words, without a sustained social media effort, social media traffic will quickly decline and be no different from having no dedicated social media strategy. Nevertheless, we did not find significant impact on longer-term citation data. Further trials should evaluate the impact of an initial and sustained social media strategy and the correlation with altmetrics and citation data over a longer time period. Moreover, we present no financial data outlining a potential return on investment (ROI) for the resources that might be required to initiate a competent social media campaign for journals. Examining ROI would be an additional area ripe for future thought and study.
ConclusionsIn conclusion, we demonstrate a meaningful benefit of a planned social media promotion strategy on the access of articles in an academic medical journal over the period of 2 months. These findings add to the notion that a carefully planned social media strategy can improve the reach and penetrance of academic medical publications. These increases in journal–reader interactions do not necessarily lead to increased citations. Different tactics with larger, multicentered, and longer-duration trials are needed to further delineate the role of social media in academic medical publication.
Acknowledgments:The authors would like to thank Pamela Poppalardo (Elsevier), Cynthia Clark (Elsevier), Rachel Zeleske (Elsevier), Bruce Polsky (Mayo Clinic Proceedings [MCP] and Hanell Consulting, LLC), and Lisa Muenkel (MCP) for their help and contributions toward this work.
References 1. Greenwood S, Perrin A, Duggan M. Social media update 2016: Facebook usage and engagement is on the rise, while adoption of other platforms holds steady. Pew Research Center website. http://assets.pewresearch.org/wp-content/uploads/sites/14/2016/11/10132827/PI_2016.11.11_Social-Media-Update_FINAL.pdf. Published November 2016. Accessed April 30, 2019. 2. Lie D, Trial J, Schaff P, Wallace R, Elliott D. “Being the best we can be”: Medical students’ reflections on physician responsibility in the social media era. Acad Med. 2013;88:240–245. 3. Hawkins CM, Hillman BJ, Carlos RC, Rawson JV, Haines R, Duszak R Jr.. The impact of social media on readership of a peer-reviewed medical journal. J Am Coll Radiol. 2014;11:1038–1043. 4. Fox CS, Bonaca MA, Ryan JJ, Massaro JM, Barry K, Loscalzo J. A randomized trial of social media from Circulation. Circulation. 2015;131:28–33. 5. Chretien KC, Kind T. Social media and clinical care: Ethical, professional, and social implications. Circulation. 2013;127:1413–1421. 6. Aase L, Timimi FK. Health care social media: Engagement and health care in the digital era. Clin Obstet Gynecol. 2013;56:471–476. 7. Haustein S, Costas R, Larivière V. Characterizing social media metrics of scholarly papers: The effect of document properties and collaboration patterns. PLoS One. 2015;10:e0120495. 8. Eysenbach G. Can tweets predict citations? Metrics of social impact based on Twitter and correlation with traditional metrics of scientific impact. J Med Internet Res. 2011;13:e123. 9. Xia F, Su X, Wang W, Zhang C, Ning Z, Lee I. Bibliographic analysis of Nature based on Twitter and Facebook altmetrics data. PLoS One. 2016;11:e0165997. 10. Widmer RJ, Engler NB, Geske JB, Klarich KW, Timimi FK. An academic healthcare Twitter account: The Mayo Clinic experience. Cyberpsychol Behav Soc Netw. 2016;19:360–366. 11. Widmer RJ, Larsen CM, Harrington RA, et al. #Cardiology ontology: Using hashtags to improve #CVD care. ACC in Touch Blog website. https://www.acc.org/latest-in-cardiology/articles/intouch/2016/04/02/08/18/cardiology-ontology-using-hashtags-to-improve-cvd-care. Published April 2, 2016. Accessed May 1, 2019. 12. Widmer RJ, Larsen CM. Call for FITs/ECs to become engaged with social media. J Am Coll Cardiol. 2016;68:422–425.
留言 (0)