
記住我


T cell-mediated immunity in birds, as in mammals, requires antigen uptake and presentation. While immune cell types including macrophages, monocytes and B cells can act as antigen-presenting cells (APCs), cDCs are thought to have a central role in the maintenance of tolerance and induction of immune responses against pathogens due to their capacity to initiate primary immune responses by driving the proliferation of naïve T cells [1-3]. Mammalian cDC development largely occurs in the bone marrow (BM) and involves a developmental cascade of BM-resident haematopoietic stem cell-derived precursor and progenitor cells [4, 5]. In the steady state, mammalian cDC populations in peripheral tissues are maintained by pre-cDCs or cDCs entering tissues from the blood and dividing locally [6]. In mammals, the prevailing paradigm in cDC biology is that after encountering antigen and being activated in peripheral tissues, they migrate via lymphatic vessels to draining lymph nodes where they initiate T-cell-dependent immune responses [4, 7]. Birds do not have specialized lymph nodes: avian secondary lymphoid tissues largely consist of poorly characterized dispersed lymphoid follicles in mucosal tissues and the skin, as well as avian-specific mucosal lymphoid organs, such as the caecal tonsils [8-10]. In contrast to the mammalian lymph node based local immune responses, in birds it is hypothesized that antigen presentation occurs locally within tissues [11]. The precise nature and mechanisms of this antigen presentation are currently unknown.
The development of the cDC lineage (cDCpoiesis) in mammals is controlled by the growth factor Fms-related tyrosine-kinase 3 ligand (Flt3L) and its cognate receptor FLT3 [12]. Mammalian cDCs consist of two subsets: cDC1 and cDC2 [13]. Each cDC subset exhibits functional specialization, which is further influenced by tissue microenvironment [12, 14-17]. The cDC1 subset excel at cross-presentation of exogenous microbial and tumour antigens to efficiently prime CD8+ T cells and activate CD4+ T cells through MHC class II antigen (MHCII) presentation resulting in the polarization of activated CD4+ T cells towards a Th1 phenotype [18-21]. The mammalian cDC2 subset exhibits less functional specialization, promoting a wide range of immune responses [22-24]. The literature is somewhat confused by the use of the term ‘DC’ to describe APCs that can be generated by cultivation of monocytes or bone marrow cells in CSF2, although monocytes are generally regarded as a separate lineage from cDC [13, 25].
Using transcriptomic approaches, a chicken immune cell population expressing genes associated with the mammalian cDC1 subset (including XCR1, FLT3, CIITA, ZBTB46, ID2, IRF8, CADM1) has been identified in the spleen, liver and lungs [26-29]. However, due to the limited availability of avian reagents compared with mammalian species, it is unclear whether chickens have cell population equivalent to the mammalian cDC2 subsets, nor whether avian-specific dendritic cell subsets exist. As birds lack lymph nodes, it is not clear whether chicken cDCpoiesis proceeds in the same manner as observed in mammals, nor how chicken cDCs perform the same basic functions of immune surveillance and antigen presentation as their mammalian counterparts in a radically different lymphoid tissue environment. Addressing these outstanding questions will require the production of immunological tools to identify and characterize chicken cDCs.
To address this resource gap, we previously generated antibodies against chicken CSF1 [30] and CSF1R [31] and demonstrated that labelled recombinant chicken CSF1 could bind to CSF1R-positive cells [30]. In the current study, we describe the production and characterization of a novel anti-chicken FLT3 monoclonal antibody and show its applications in the flow cytometric analysis and immunofluorescent staining of chicken tissue cDCs. Furthermore, we also generated reagents to label the cell surface receptors XCR1 and CSF2R, which, in combination with the anti-chicken FLT3 monoclonal antibody, allowed us to efficiently phenotypically characterize the chicken cDC. We show that the chicken spleen contains several FLT3+ cell populations, with the XCR1+ FLT3HI subset likely representing the bona fide chicken cDC population. In combination with a previously generated CSF1R-transgenic chicken line [10], a more detailed flow cytometry analysis revealed that the cell surface phenotypes of chicken XCR1+ cDC were partially conserved with the mammalian XCR1+ cDC1 subset, with distinct differences in CSF1R and CSF2R expression compared with mammalian orthologues. We show that while Salmonella Typhimurium invades chicken FLT3HI cDCs, they exhibit preferentially trophism for splenic macrophages. Finally, we show that the in vitro bone marrow-derived DCs (BMDCs) expresses the classical chicken monocyte/macrophage marker MRC1L-B and do not express either FLT3 or XCR1, indicating that these are more accurately described as antigen-presenting macrophages rather than DC.
MATERIALS AND METHODS Chickens and ethics statementAll birds were obtained from the National Avian Research Facility at The Roslin Institute, University of Edinburgh. All birds were hatched and housed in premises licensed under a UK Home Office Establishment License in full compliance with the Animals (Scientific Procedures) Act 1986 and the Code of Practice for Housing and Care of Animals Bred, Supplied or Used for Scientific Purposes. Production of the CSF1R-eGFP reporter transgenic line has been previously described [10]. This transgenic line has been used for various studies of mononuclear phagocyte development [28, 32-34]. Breeding of transgenic chickens was carried out under the authority of Project License PPL 70/8940 with the consent of The Roslin Institute Animal Welfare and Ethical Review Board. Animals were humanely culled in accordance with Schedule 1 of the Animals (Scientific Procedures) Act 1986.
Amplification of the full-length chicken FLT3 gene and a short isoformTo obtain accurate sequence data for the 5’end of FLT3, it was firstly cloned by a mismatch RT-PCR. Briefly, total RNA was extracted from splenocytes from a 6-week-old J line bird using TRIzol reagent (Invitrogen, Thermo Fisher Scientific), mRNA was then purified with Dynabeads Oligo (dT)25 (Invitrogen, Thermo Fisher Scientific), as per manufacturer's instruction. 2 µg mRNA was then used to create a double-strand cDNA library using Marathon® cDNA Amplification Kit (Clontech Laboratories), as per manufacturer's instructions. The mismatched adaptors were prepared as following: a forward primer 5’-end phosphorylated AdaptL (5’ PO4-TCGAGGGAATCTTGATATCGAATTCCTGC-3’) and a reverse primer AdaptMS (5’-GCAGGAATTCGATATCAAGCTTCCCTCGA −3’), where bold and italic letters indicated mismatched residues. These were synthesized by Sigma-Aldrich. 10 µl of both primers at concentration of 100 µM was mixed thoroughly, heated at 95ºC for 10 min in a water bath to anneal primers and cooled down gradually to form mismatched double-strand adaptors. This adaptor (200 pmol) was then ligated to the above double-strand cDNA using T4 ligase (Invitrogen). After dilution by 1 in 10 with H2O, the cDNA was used as PCR template to clone cDNA of 5’ end of FLT3, using forward primer, AP1 (5’-GCAGGAATTCGATATCAAGA-3’), complementary to AdaptL and reverse primer FLT3-JHR3 (5’-CTGATGACTGAGAAAGTGTA-3’), specific to chicken FLT3, with the following cycling conditions: 94ºC for 1 min, 3 cycles of 53 ºC for 3 min, 3 cycles of 94ºC for 1 min, 56 ºC for 1 min and 72 ºC for 1·5 min, and 30 cycles of 94ºC for 1 min, 58 ºC for 1 min and 72 ºC for 1·5 min. Based on the DNA sequence of the FLT3 5’ end amplicon, a forward primer Flt3F1 (5’ATCACCAGCATGGCAGTGTGTCT3’) was synthesized, together with a reverse primer Flt3R1 (5’-GATAACATCTTCTTAGTGGTGATGTGAA-3’) to clone full-length chicken FLT3 cDNA from a splenic cDNA template, reversely transcribed from a 6-week-old J-line bird and following cycling conditions: 94ºC for 3 min, 33 cycles of 94ºC 1 min 60ºC 1 min, 72ºC 3 min and then 72ºC 10 min, resulting in two amplicons, a full-length FLT3 (chFLT3) and a short isoform (chFLT3s).
Semi-quantitative RT-PCR analysis of FLT3 expressionTissues (thymus, spleen, bursa of Fabricius, Harderian gland, caecal tonsil, Meckel's diverticulum, bone marrow, brain, breast muscle, heart, liver, kidney, lung, small intestine and testis) were dissected from 6-week-old J-line chickens. Total RNA was prepared from tissues using RNeasy mini kit (QIAGEN), following the manufacturer's instructions. 2 µg total RNA was then reverse-transcribed into cDNA, using Superscript III (Invitrogen) as per manufacturer's instructions. Primers Flt3-iosFwd 5’-GCTCATCCAAATCAAACTGCT-3’) and Flt3-iosRev 5’-CAACTGACATGT TAATGAAGCTC-3’) were used for PCRs to analyse FLT3 expression via following cycling conditions: 94ºC for 3 min, 33 cycles of 94ºC 1 min 55ºC 30 sec, 72ºC 1 min. Chicken GAPDH was used as a control gene, as described before [35].
Expression and purification of recombinant chFLT3-Fc and recombinant chFLT3-V5HIS6 proteinThe extracellular domains of chFLT3 or chFLT3s were sub-cloned into pKW06 to produce a fusion protein with a C-terminal human IgG1 Fc tag or pKW08 to produce a fusion protein with a V5HIS6 tag [36]. The constructs were named as pKW06/chFLT3, pKW06/chFLT3s, pKW08/chFLT3 and pKW08/chFLT3s. All constructs have their own signal peptides and were expressed in human embryonic kidney HEK293 cells as described elsewhere [37]. FLT3-Fc was purified using a HiTrap Protein G affinity column (GE Healthcare Life Sciences). The purity and identity of FLT3-Fc were confirmed by SDS-PAGE and analysis of tryptic peptides by mass spectrometry (Dr Dominic Kurian, Proteomics and Metabolomics, The Roslin Institute) before immunization.
Monoclonal antibody production, isotyping, purification and labellingMice were immunized with purified chFLT3-Fc fusion protein. Immunization and cell fusion were carried out by Dundee Cell Products (DCP, Dundee, UK). Following fusion, polyclonal hybridoma cultures were tested with recombinant chFLT3-V5HIS6 by dot-blot and six positive hybridoma cultures were selected by DCP. These samples were then further screened by ELISA with chFLT3-Fc, chFLT3-V5HIS6, Fc or V5HIS6 controls and screened with chFLT3 transfected Ba/F3 cells or control Ba/F3 cells (below). Positive samples were selected for further cloning to produce monoclonal hybridomas. Specificity of supernatant from monoclonal hybridoma cultures was again confirmed by ELISA and flow cytometry. Isotypes of these monoclonal antibodies were tested to common mouse antibody isotypes (IgG1, IgG2a, IgG2b, IgG3, IgM and IgA) and to the κ and λ light chains using the IsoStrip Mouse Monoclonal Antibody Isotyping Kit (Roche). Monoclonal hybridomas were cultured in Dulbecco's modified Eagle's medium (DMEM) with 10% Ig-depleted foetal bovine serum (FBS). Monoclonal antibodies were purified using HiTrap Protein G affinity columns (GE Healthcare Life Sciences) and dialysed against phosphate-buffered saline (PBS) using 30 kDa molecular weight cut-off (MWCO) Slide-A-Lyser cassettes (Pierce, Thermo Fisher Scientific). The concentrations of mAbs were determined by absorbance at 280 nm with a Nanodrop. Purified mAbs were labelled with Alexa Fluor™ 647 Antibody Labelling Kit (Invitrogen). All procedures were performed according to the manufacturer's instructions.
Transfection of Ba/F3 cell with full-length FLT3 for screening of hybridomasThe full length of chFLT3 or chFLT3s open reading frame (without stop codons) was cloned into the pEF6/V5-His TOPO expression vector (Thermo Fisher Scientific) in-frame with the V5 and His tags at the 3’ end of the protein. The pEF6-FLT3 or FLT3s expression constructs and pEF empty vector was transfected into Ba/F3 cells by electroporation and stably transfected Ba/F3 cells were selected with blasticidin as previously described for the chicken CSF1R gene [33]. Briefly, logarithmically growing Ba/F3 cells were harvested and resuspended in complete media at a concentration of 5 × 10⁶ cells per 200 µl. Cells were then placed in 0·4-cm electroporation cuvettes with 50 μl of PBS containing 5 μg plasmid DNA. The cuvettes were left to equilibrate at room temperature (RT) for 10 min before electroporation at 975 μF and 300 V using a Bio-Rad Gene Pulser electroporation apparatus. After electroporation, cells were washed in complete medium to remove surplus DNA, plated out in 6-well plates and then incubated at 37 ºC for 24 h before adding 40 µg/ml blasticidin (Fisher Bioreagents, Fisher Scientific) for three weeks. Stable clones were selected for their survival in blasticidin.
Screening of hybridomas and confirmation of specificity by ELISASupernatant from hybridoma culture was screened by indirect ELISA as described previously [38]. Briefly, assay plates (Nunc Immuno MaxiSorp, Thermo Electron LED) were coated with recombinant FLT3-Fc, FLT3s-Fc, FLT3-V5H6, FLT3s-V5H6 or relative control protein in carbonate/bicarbonate buffer (15 mM sodium carbonate, 35 mM sodium bicarbonate and 3 mM sodium azide; pH 9·6) and incubated overnight at 4 ºC. Plates were washed in PBS containing 0·1% (v/v) Tween 20 (PBS-T) and blocked with 0·5% (w/v) casein/PBS at RT for 1 h. Neat supernatant of hybridoma culture or purified mAb was added to the plate and incubated at RT for 1 h. After three washes with PBS-T, plates were incubated with goat anti-mouse IgG-horseradish peroxidase (HRP) at RT for 1 h. After a further three washes, plates were visualized by 3,3’,5,5'-tetramethylbenzidine (TMB) substrate (Invitrogen, Thermo Fisher Scientific), and the reaction was stopped by 2N H2SO4. Plates were read at 450 nm in a SpectraMax 250 microplate spectrophotometer system (Molecular Devices, Sunnyvale, CA, USA).
Screening of hybridomas and confirmation of specificity with FLT3-Ba/F3 cellsParental Ba/F3 cells, stably transfected FLT3-Ba/F3, FLT3s-Ba/F3 or pEF-Ba/F3 were cultured in presence of IL-3 (X63 medium). Cells were fixed with 1% (w/v) paraformaldehyde in PBS, permeabilized with 0·1% saponin and stained with mouse anti-V5-Tag antibody (Bio-Rad) or IgG2a isotype control before adding goat anti-mouse IgG-fluorescein isothiocyanate (FITC; Bio-Rad) for flow cytometric analysis. To detect surface FLT3, cells were incubated with supernatant from hybridoma culture or purified mAbs on ice for 30 min before adding goat anti-mouse IgG (H + L) cross-adsorbed secondary antibody, conjugated with Alexa Fluor 647 (Invitrogen, Thermo Fisher Scientific) to detect hybridoma supernatant and then analysed by flow cytometric analysis.
Development of specific reagent to XCR1The protein sequence of chicken XCL1 was obtained from NCBI (Accession NP_990377). The mature peptide of chicken XCL1 (previously known as lymphotactin), with the addition of a terminal lysine residue for coupling, was synthesized (Sequence: SVASQSMRKLSCVNLSTQKVDIRSIVNYEKQKVPVEAVMFITANGIRICVHPEQKWVQSAMKRIDRRRTTRRRK) and coupled with Alexa Fluor 647 (Linker-Cys-AF647; ALMAC Science (Edinburgh, Scotland)), yielding reagent XCL1AF647. The cDNA sequence for chicken XCR1 was obtained from NCBI (Accession NM_001045838). To analyse the specificity of the reagent, the full length of XCR1 open reading frame (without stop codon) was cloned into the pEF6/V5-His TOPO expression vector (Thermo Fisher Scientific) in-frame with the V5 and His tags at the 3’ end of the protein. The pEF-XCR1 plasmids were transfected into Ba/F3 cells and selected with blasticidin to produce stably transfected Ba/F3 (XCR1-Ba/F3) as described above for the transfection of Ba/F3 cells with full-length FLT3 for screening of hybridomas. XCR1-Ba/F3 or pEF-Ba/F3 transfected cells were then harvested and stained with XCL1AF647 (0·2 μg/ml) on ice for 30 min. Human IgG1-Fc was conjugated to Alexa Fluor 647 using the AF647 Microscale Protein labelling kit (Thermo Fisher Scientific) according to manufacturer's instructions to use as peptide control. Cells were then washed twice with FACS buffer (PBS, 1·0% (w/v) bovine serum albumin and 0·05% (w/v/) sodium azide) and resuspended in FACS buffer with SYTOX® Blue (Invitrogen; 1 mM solution in dimethylsulphoxide; 1/4000 dilution) immediately prior to flow cytometric analysis using a LSRFortessa (Becton Dickinson). Resulting data were analysed using FlowJo V10 software (FlowJo, Ashlan, OR. USA).
Development of labelled CSF2 to detect CSF2R expressionChicken CSF2 (GM-CSF) cDNA [39] was sub-cloned into the vector pKW06 to produce recombinant protein with a C-terminal human IgG1 Fc tag (CSF2-Fc) as described previously [36]. CSF2-Fc specifically binds to chicken CSF2R on the surface of chicken granulocytes and monocytes and macrophages (Wu et al., manuscript in preparation). CSF2-Fc was conjugated to Alexa Fluor 647 using the AF647 Microscale Protein labelling kit (Molecular Probes, Thermo Fisher Scientific) according to the manufacturer's instructions. CSF2-Fc was also recognized with goat F(ab’) anti-human IgG-phycoerythrin (PE) (mouse absorbed, Cambridge BioScience) as in Table 1 when co-staining with XCL1AF647.
TABLE 1. List of reagent used for flow cytometry and immunofluorescence staining Reagent name/Clone Target Conjugate Isotype Source/Reference Conc µg/ml Mouse anti-CD45/ clone LT−40 CD45 RPE Mouse IgM Southern Biotech 0·8 Mouse anti-Bu−1/ clone AV20 Bu−1a/b RPE Mouse IgG1 Southern Biotech 0·1 Mouse anti-CD3/ clone CT−3 CD3 RPE Mouse IgG1 Southern Biotech 0·1 Mouse anti-chicken Monocytes/Macrophages /clone KUL01 MMR1L4/MRC1L-B RPE Mouse IgG1 Southern Biotech 0·4 Mouse anti-chicken MHC II / clone 2G11 MHC class II β-chain RPE Mouse IgG1 Southern Biotech 0·1 XCL1 XCR1 AF647 ALMAC 0·2 CSF2-Fc CSF2R AF647 Human IgG1-Fc In house (Manuscript in preparation) 0·1 Mouse IgM isotype control RPE Mouse IgM AlphaDiagnostic 0·8 Mouse IgG1 isotype control RPE Mouse IgG1 AlphaDiagnostic 0·1 Bovine IgG1-Fc AF647 Bovine IgG1-Fc In house 0·1 Goat anti-Chicken IgY (H + L) Alexa Fluor 488 AF488 Polyclonal Thermo Fisher Scientific 1/500 Reagent name Target Isotype Supplier Conc µg/ml Secondary antibody Mouse anti-chicken FLT3 FLT3 Mouse IgG1 In house(ROS-AV184) 0·1 Goat anti-mouse IgG1-PE Thermo Fisher Scientific P21129;1/2000 Mouse anti-TIM4/clone JH9 TIM4 Mouse IgG1 In house (Hu et al., 2016) 0·1 Mouse anti-chicken CSF1R CSF1R Mouse IgG1 In house (ROS-AV170, Garcia-Morales, 2014) Mouse IgG1 isotype control/GR13·1 Mouse IgG1 In house (Hu et al., 2016) 0·1 CSF2-Fc CSF2R Human IgG1-Fc In house 0·1 Goat F(ab’)2 Anti-Human IgG, Mouse ads-PE; Cambridge BioScience 2043–09; 1/1000 Bovine IgG1-Fc Bovine IgG1-Fc In house 0·1Chicken splenic white blood cells (splenocytes) were isolated from CSF1R-eGFP reporter transgenic birds aged from 3–20 weeks and age-matched Hy-line wild-type controls. Briefly, the spleen was removed, cut into small pieces and homogenized using a borosilicate glass homogenizer (Fisher Scientific UK Ltd) with ice-cold dissection medium (calcium- and magnesium-free Hank's balanced salt solution (HBSS) with 10mM HEPES 0·45% (w/v) glucose and 1mM sodium pyruvate) and filtered through a 100-µm cell strainer into a 50-ml tube. Homogenized solution for birds older than 3 weeks of age was overlaid on Histopaque-1·077 (Sigma-Aldrich) and spun at 400 g for 20 min at RT with the brake off. Cells at the density interface were collected, washed, resuspended in cold FACS buffer and placed on ice for 10 min. Cold cells were then stained with a combination of mAbs as in Table 1 in FACS buffer for 30 min on ice in the dark. Cells were then washed three times, resuspended in cold FACS buffer and stained with SYTOX® Blue Dead Cell Stain (Invitrogen; 1·0 mM stock, 1/4000 dilution) for live cell gating. Data were collected with a LRSFortessa (BD Biosciences) and analysed using FlowJo V10 software. At least 100,000 events were acquired. Dead cells were excluded by SYTOX® Blue staining and doublets were then discriminated based on signal processing (FSC-A/H). Fluorescence minus one controls (FMO) were used to confirm gating strategies. The dimensionality reduction algorithm, t-distributed stochastic neighbour embedding (t-SNE) was used to generate cell clusters.
Culture of chicken BM-derived dendritic cellsChicken bone marrow cells were isolated from two-week-old CSF1R-eGFP transgenic chickens (n = 3) and cultured with CSF2 and IL-4 for 7 days as described previously [40]. Chicken BMDCs were collected by pipetting, washed with cold FACS buffer and stained with XCL1AF647, anti-FLT3 and KUL01-RPE for 30 min in FACS buffer on ice. Goat anti-mouse IgG1 was used as secondary antibody to detect anti-FLT3. All staining was carried out on ice and washes performed with ice-cold buffer. Data were collected with a LRSFortessa (BD Biosciences) and analysed using FlowJo V10 software.
In vitro staining of splenic dendritic cells and confocal imagingSplenocytes were prepared as described above from 12-week-old CSF1R-eGFP reporter transgenic birds. 0·2 × 106 cells were plated on fibronectin-coated 8-well Nunc Lab-Tek II Chamber slides (Thermo Fisher Scientific) and incubated at 41˚C with RPMI medium supplemented with 10% (v/v) heat-inactivated FBS, 2 mM L-glutamine and antibiotics (100 g/ml penicillin, 100 g/ml streptomycin) for one hour. After one-hour, non-adherent cells were gently washed off with RPMI and remaining adherent cells were incubated overnight in complete RPMI medium supplemented with 200 ng/ml recombinant chicken CSF1 produced as described previously [30]. The next day slides were chilled on ice for 30 minutes and stained using XCL1AF647, anti-chicken MHCII-RPE and KUL01-RPE (Table 1) in RPMI. After one hour, cells were washed in phenol red-free RMPI medium. After staining, phenol red-free RMPI with 10% (v/v) FBS was added to the cells and the chamber slides were placed on a microscope stage heated to 41˚C and imaged using a Zeiss LSM 710-inverted microscope.
Immunofluorescent staining of FLT3+ cells and confocal imaging of tissue sectionsUnfixed tissue sections from four-week-old birds were embedded in Cellpath™ OCT Embedding Matrix (Fisher Scientific UK Ltd, Loughborough, UK) and snap-frozen at −80˚C for two hours. 10-µm sections were cut onto Superfrost Plus slides (Menzel-Gläser, Braunschweig, Germany), air-dried for one hour at room temperature before being fixed with 100% methanol at 4°C for 10 min and then air-dried for a further one hour at room temperature. All primary antibodies used in this study are shown in Table 1. All slides were blocked for one hour in 2·5% skimmed milk powder (Oxoid Ltd., Basingstoke, UK), 2·5% normal horse serum (Sigma, Gillingham, UK), 0·1% Triton X-100 (Sigma, Gillingham, UK) in PBS (MST-PBS). Isotype-matched antibody controls (Table 1) were added at the same concentration as primary antibodies. Primary antibodies: goat anti-chicken IgY (H + L), Alexa Fluor 488 (Thermo Fisher Scientific (Life Technologies Ltd.), Renfrew, UK) used at 1/500 dilution; all other antibodies used at 1/100 dilution. All primary antibodies diluted in blocking reagent (above) and incubated at 4°C overnight, washed for 20 minutes in PBS, followed by incubation with secondary antibodies for two hours (donkey anti-mouse IgG Alexa Fluor 594, donkey anti-mouse IgG1 Alexa Fluor 594, donkey anti-mouse IgG2a Alexa Fluor 647; Thermo Fisher Scientific (Life Technologies Ltd.)) used at 1/300 dilution and mounted in ProLong® Gold Antifade Mountant (Thermo Fisher Scientific (Life Technologies Ltd.)). Where appropriate, sections were counterstained with 1 μg/ml 4′, 6′-diamidino-2-phenylindole (DAPI; Sigma, Gillingham, UK) in the final incubation step. Samples were imaged using an inverted confocal microscope (Zeiss LSM710) and images analyses using Zeiss ZEN 3·1 software.
Preparation of bacteria and phagocytosis assaySalmonella enterica serovar Typhimurium strain ST4/74 nalR and an isogenic mutant lacking the function of type III secretion system 1(ΔprgH) which promotes bacterial invasion were used in this study [32]. Both ST4/74 nalR and ST4/74 nalR ΔprgH were engineered to constitutively express mCherry by transformation with a derivative of pFVP25·1 [41] (Salmonella-mCherry). Bacteria were streaked from frozen glycerol stocks onto fresh Luria Bertani (LB) agar plates and incubated at 37°C overnight. A single bacterial colony was inoculated into LB broth and incubated in a shaking incubator overnight at 37°C. Optical density at 600 nm (O.D.600) of the overnight culture was measured to determine the bacterial count, and the culture was diluted in RPMI 1640 (Gibco, Thermo Fisher Scientific) with 10% (v/v) FBS to achieve the desired multiplicity of infection (MOI). The bacterial viability and the MOI were retrospectively determined by plating of serial ten-fold culture dilutions to agar medium.
Single-cell suspensions of splenocytes from 11-week-old CSF1R-eGFP transgenic reporter birds [10] were isolated as described above, washed with RPMI1620 twice, resuspended in RPMI1640 with 10% (v/c) FBS and plated into a 96-well U-bottom plate. The above two stains of Salmonella-mCherry were added at a MOI of 5 for 45 min at 41 °C. A duplicated plate with cells was pre-chilled, and the same number of bacteria was added and left on ice for controls. Cells were then washed and incubated with RPMI with 10% (v/v) FBS containing 100 μg/ml gentamicin (Thermo Fisher Scientific) for 30 min to kill extracellular Salmonella. Then, the cells were washed with cold PBS, stained with FLT3 mAb and analysed by flow cytometry as described above. Two independent phagocytosis assays were performed, and six CSF1R-eGFP birds and two Hy-Line wild-type birds (flow control) were used in total. Results are presented as the relative percentage of mCherry-expressing cells in each population (the mean ±standard deviation (SD)). Geometric mean fluorescence intensity (MFI) was used to measure the expression level of mCherry. The integrated mean fluorescence intensity (iMFI) [42, 43] was introduced to reflect the total functional response of mCherry+ cells. iMFI is computed by multiplying the relative frequency (% positive) of cells expressing mCherry with MFI of mCherry+ population.
Statistical analysis was conducted using a two-tailed unpaired t-test with Welch correction. Statistical significance was defined as follows: ∗, p < 0·05; ∗∗, p < 0·01; and ∗∗∗, p < 0·001. All analyses were performed using the statistical program PRISM 7 (GraphPad).
RESULTS Chicken FLT3 gene and isoformsThe only chicken FLT3 transcript annotated in ENSEMBL (ENSGALT00000080989·3) encodes an 877 amino acid predicted protein, truncated at the N terminus relative to orthologs in turkey and zebrafinch. Using 5’ rapid amplification of cDNA ends (RACE) method, we amplified an extended cDNA product of approximately 460 base pairs (bps) in length, that contained a short-length of 5’ untranslated region, a start codon and a signal peptide region of chicken FLT3 (chFLT3), which corrected the prediction in the ENSEMBL database for a signal peptide region of chFLT3. Based on this information, we cloned full-length of FLT3 cDNA. The largest open reading frame of chFLT3 is 2,988 bps and composed of 24 coding exons. The predicted protein sequence of chFLT3 has 50·5% and 51·6% identity with human and murine FLT3, respectively. ChFLT3 gene encodes 995 amino acids, including a signal peptide region (aa 1–19), an extracellular domain (aa 20–548), a transmembrane domain (aa 549–569) and an intracellular domain (aa 570–995), which contains a tyrosine-kinase domain consisting of 2 lobes joined by a tyrosine-kinase insert and a C terminus (Figure 1). In our PCR cloning, we also identified an isoform of chFLT3 with a deletion mutation, named as chFLT3s. The chFLT3s is 219 bps shorter than chFLT3, with a deletion of 107 bps in 3’ end of exon 9 and 112 bps in 5’ end of exon 10, resulting in a 73-aa deletion located at the N terminal end of the extracellular domain in comparison with chFLT3 (Figure 1).

Alignment of the predicted chicken fms-like tyrosine-kinase 3 (chFLT3) amino acid (aa) sequence with those of human (P36888-2) and mouse (Q3UEW6) Flt3, with reference to secondary structural features. Shaded areas represent conservation of amino acid similarity—the darker the shading, the more conserved the residue across species. Dashes indicate gaps in the alignment. Empty reverse triangles above the sequences indicate the start points of each domain, and filled diamonds label the start points of each substructure of intracellular domain. TM: transmembrane domain, JM: juxtamembrane domain, TK1: tyrosine-kinase 1 domain, KI: tyrosine-kinase insert domain, TK2: tyrosine-kinase 2 domain, CT: C terminus. Filled triangles indicate that those residues are lack in chFLT3s isoform
Tissue distribution and cellular expression of chicken FLT3The expression patterns of chFLT3 isoforms were analysed by RT-PCR using Flt3-iosFwd/iosRev primers. In contrast to rather restricted expression of human and murine FLT3 (see www.biogps.com), chFLT3 was widely expressed at the mRNA level in lymphoid and most non-lymphoid tissues analysed apart from brain, muscle and heart. ChFLT3 was a predominant isoform, whereas chFLT3s was only weakly expressed (Figure 2). The widespread expression is confirmed in a large-scale meta-analysis of gene expression data to produce a chicken gene expression atlas [44].

Tissue expression of chFLT3 isoforms. Tissues were dissected from a 6-week-old male J line, including lymphoid and non-lymphoid chicken tissues, where HG refers to Harderian gland; CT, caecal tonsil; Meckel's, Meckel's diverticulum; BM, bone marrow. M represents a DNA ladder (bp) and the chicken GAPDH cDNA is a control. The results shown are representative of two independent experiments
Generation of mouse anti-chFLT3 monoclonal antibodiesTo generate monoclonal antibodies recognizing chicken FLT3, mice were immunized with FLT3-Fc and hybridomas generated as described in Methods and Materials. After initial screening, six hybridoma supernatants were further screened by ELISA (Figure S1A). Three produced antibodies that bound specifically to FLT3-Fc and FLT3-V5H6, but not FLT3s-Fc or FLT3s-V5H6, Fc or V5H6 controls. To enable studies of the binding specificity of mAb to FLT3, Ba/F3 cells were stably transfected with full-length FLT3 or FLT3s. The success of transfection was tested by intracellular staining against the V5 tag. Anti-V5 staining (Figure S1B) showed around 36% of Ba/F3 cells were successfully transfected for chFLT3 or chFLT3s. Two hybridoma supernatants (4E7 and 8A5) among the three tested were found to bind Ba/F3 cells stably transfected with full-length FLT3 (FLT3-Ba/F3), but not the short form (FLT3s-Ba/F3) or empty pEF6 vector transfected Ba/F3 cells (pEF-Ba/F3). All three hybridomas selected by either ELISA or flow cytometry analysis were further cloned to produce monoclonal hybridomas. Unfortunately, 8A5 stopped producing antibody after sub-cloning. 4E7 and 8D12 were isotyped and found to be IgG1. These two monoclonal hybridomas were designated as ROS-AV184 (4E7) and ROS-AV185 (8D12) for future reference.
Confirmation of the specificity and utility of the anti-chFLT3 monoclonal antibodyMonoclonal antibodies ROS-AV184 and ROS-AV185 were purified and further tested by ELISA and flow cytometry analysis on Ba/F3 cells (Figure 3). Both ROS-AV184 and ROS-AV185 specifically recognized FLT3 by ELISA (Figure 3a). As in the screening, ROS-AV184 recognized FLT3-Ba/F3, but not FLT3s-Ba/F3 or pEF-Ba/F3 control cells. ROS-AV185 failed to stain transfected Ba/F3 cells (Figure 3b). Henceforward, ROS-AV184 (4E7) was used as mouse anti-chicken FLT3 as listed in Table 1. Anti-chFLT3 was used to detect FLT3+ cells in situ by immunofluorescence staining. Anti-chFLT3 did not detect specific cell populations in paraformaldehyde-fixed or acetone-fixed tissues (data not shown). In methanol fixed sections, anti-chFLT3 stained ramified MHCII+ cells in the liver (Figure 3c; Figure S2A-D). Liver FLT3+ cells were scattered throughout the parenchyma and concentrated around blood vessels (Figure 3c; Figure S2A-D). In contrast, MRC1L-B+ MHCII+ liver macrophages and Kupffer cells [27] were more abundant in the liver parenchyma and not concentrated around blood vessels (Figure 3c; Figure S2C). In the bursa of Fabricius FLT3+ MHCII+ cell were located in the interfollicular regions, but not with B-cell follicles (Figure 3c; Figure S2E,F). In the spleen, FLT3+ MHCII+ cells were abundant in the red pulp but not detected in the periellipsoid white pulp (PWP), nor germinal centres (GC) (Figure 3d; Figure S3A, B). Anti-chFLT3 also stained the MHCII− ellipsoid blood vessels, but not other blood vessels (including the central artery; Figure 3d; Figure S3Ci, Cii).

Confirmation of the specificity of purified monoclonal antibodies for FLT3 by ELISA (a) and flow cytometric analysis on transfected Ba/F3 cells (b). Plates were coated with chFLT3 or control protein. Purified antibodies ROS-AV184 (4E7) and ROS-AV185 (8A5) effectively recognized chFLT3 not control proteins by ELISA (a). Purified ROS-AV184 (4E7) specially labelled FLT3-Ba/F3 not FLT3s-Ba/F3 or control Ba/F3 (b). Y-axis = FSC-H; purified mAbs or IgG1 isotype control as detected by secondary goat anti-mouse IgG1-AF647. (c and d). Confocal analysis of anti-FLT3 (ROS-AV184) staining on sections of liver, bursa and spleen. Co-staining of anti-FLT3 and MHC II on liver sections revealed that liver FLT3+ cells were scattered throughout the parenchyma and concentrated around blood vessels (yellow arrows); scale bar = 20 µm. In contrast, MRC1L-B+ MHCII+ liver macrophages and Kupffer cells were more abundant in the liver parenchyma and not concentrated around blood vessels (yellow arrows); scale bar = 20 µm. Co-staining of anti-FLT3 and MHC II in the bursa of Fabricius revealed that FLT3+ MHCII+ cell were located in the interfollicular regions (red arrow), but not with B-cell follicles (labelled as F); Scale bar =20 µm. Co-staining of anti-FLT3 and MHC II on the spleen sections demonstrated that FLT3+ MHCII+ cells were abundant in the red pulp but not detected in the periellipsoid white pulp (PWP), nor germinal centres (GC). Anti-chFLT3 also stained the MHCII− ellipsoid blood vessels (penicillary capillaries, PC), but not other blood vessels (including the central artery, CA); scale bar = 50 µm
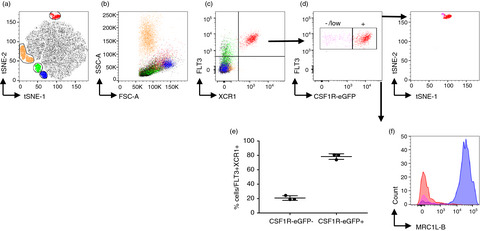
Identification of splenic conventional dendritic cells using the anti-chFLT3 monoclonal antibody ROS-AV184In mammals, FLT3 is highly expressed on haematopoietic progenitor cells and is progressively lost in cells committing to the B cell, T cell, granulocyte/macrophage and megakaryocyte/erythrocyte lineages [12, 14, 45], whereas expression is maintained in the dendritic cell lineages [46]). In RNA expression analysis, chicken cDCs but not macrophages, T cells nor B cells were found to express FLT326. Most if not all DC in mouse also express CSF1R mRNA, albeit at the lowest levels in cDC1s, and in non-lymphoid tissues are CSF1R-dependent [47]. In the current study, anti-chFLT3 was used to stain cell surface FLT3 in chicken splenocytes. Figure 4a shows that high levels of FLT3 were detected in a subpopulation of CD45+ cells in both wild-type (WT) and CSF1R-eGFP transgenic birds. The majority (~80%) of FLT3HI CD45+ cells expressed the CSF1R-eGFP transgene (Figure
留言 (0)