
記住我
Xylella fastidiosa (Xf), Lysobacteraceae family, Gammaproteobacteria class (Wells et al., 1987) is a fastidious, non-flagellate, Gram-negative, xylem-limited bacterium, known to cause destructive diseases worldwide in a broad range of crops (grapevine, citrus, stone fruit, olive, pecan, blueberry, alfa alfa, and coffee) but also ornamental and forestry plant species (elm, oak, sycamore, and oleander) (Henneberger et al., 2004; Rapicavoli et al., 2018). The updated Xf host plant database lists over 712 species across 312 genera and 89 families in which the bacterium causes symptomatic or latent infections (Cavalieri et al., 2024). The Xf long-distance spread and its associated diseases are primarily attributed to human activities related to the movement and exchange of infected plant material while locally, the bacterium is dispersed through xylem-sap feeding insects (Almeida and Nunney, 2015). Xf was originally discovered in the late 1800’s in the Americas, where is now endemically distributed and more recently, in Asia and Europe, being reported, up to now, in more than 20 countries across America, Asia, and Europe [PM 7/24 (5) Xylella fastidiosa, 2023]. The first Xf finding in Europe occurred in 2013, associated with the Olive Quick Decline Syndrome (OQDS) (Saponari et al., 2013, 2014; Cariddi et al., 2014), a severe epidemic decimating olive trees in the Salento peninsula (Apulia, Italy), although phylogenetic and genomic investigations dated the first introduction of the pathogen in the European continent back to the 80’s of the last century (Soubeyrand et al., 2018; Landa et al., 2020).
The plant-bacterial interactions enhancing systemic host colonization and modulating plant defense response are still largely unknown. It is well-known that Xf has a dual lifestyle encompassing a planktonic motile form to systemically colonize the plant vessels, and a steady condition, where cells are sticky and organized in aggregates embedded in an exopolysaccharide (EPS) matrix, which is required by the insect vector for the acquisition and transmission (Chatterjee et al., 2008), passing through a phase transition that is finely regulated by a mechanism called “quorum sensing.”
A further process regulating the cell growth dynamics, the bacterium survival to various stresses, and the virulence is based on bacterial toxin-antitoxin (TA) systems (Merfa et al., 2016; de Souza-Neto et al., 2022). TA loci are organized in operons and encode for two neighboring genes, a stable protein-based “toxin,” that could exert harmful effects on the cells inhibiting their growth, and a specific cognate labile “antitoxin” (either RNA or protein), that acts as a transcriptional repressor, preventing self-toxicity (Maisonneuve and Gerdes, 2014). This auto-inhibition, called “conditional cooperativity,” relies on the proper toxin: antitoxin stoichiometric ratio in the cells under normal conditions (Cataudella et al., 2012), while the uneven co-expression of TA genes have been associated with cell growth dynamics under stress conditions (Burbank and Stenger, 2017; Gupta et al., 2017). Xf has multiple TA modules on its chromosome involved both in virulence and stress survival (Van Sluys et al., 2003; Lee et al., 2014). One such TA system, named cvaC/cvi, represents a putative component of the virulence process (Zaini et al., 2008). The cvaC toxin belongs to the bacteriocin class, sharing homologies with the RTX protein recovered in Rizobium leguminosarum, a hemolysin and leukotoxin (Oresnik et al., 1999; Holtsmark et al., 2008) that possibly plays a structural role in biofilm maturation (de Souza et al., 2020). Xf bacteriocin has a comparable structure with colicin V (Col-V) secreted by E. coli and other Enterobacteriaceae members (Waters and Crosa, 1991). The peptide, synthesized as a 103 amino acids precursor molecule, endowed with a leader 15-amino acid motif, is successively post-translationally modified during its secretion by the proteolytic cleavage of the leader to give rise to the 88 amino acid long mature protein. This “core peptide” represents the bioactive molecule. Indeed, the abundant levels of transcript of this gene, under standard growth conditions (De Souza et al., 2003) and in microbiological media supplemented with glucose (Pashalidis et al., 2005), iron (Zaini et al., 2008), calcium (Chen and De La Fuente, 2020) and grape sap (Nunes et al., 2010; Surano et al., 2023) confirms that the toxin encoded by cvaC gene is likely a prevalent weapon employed by Xf to efficiently compete with other closely-related sensitive endophytes in the xylem and insect foregut (Zaini et al., 2008). In most of Xf genomes publicly available, cvaC gene has a tripled-tandem organization, with the first copy (cvaC-1) in antisense and the other two (cvaC-2 and cvaC-3) in sense direction. Located upstream of this module is the immunity protein cvi, which self-protects the producing strain from the toxic effects of its own antibacterial product (Pashalidis et al., 2005; Baquero et al., 2019; Figure 1). Because of the molecular mass of cvaC below 10 kDa, and the existence of a dedicated export system for the translocation, it should fall in the microcin group (MccV-like) (Duquesne et al., 2007) likely acting as a pore-forming toxin (PFT), causing membrane permeabilization and destabilization, i.e., the formation of pores and channels in the lipid bilayers, through the binding of specific receptors, and therefore, the dissipation of the protonmotive force of sensitive bacteria (Chatterjee et al., 2005; Hasper et al., 2006).
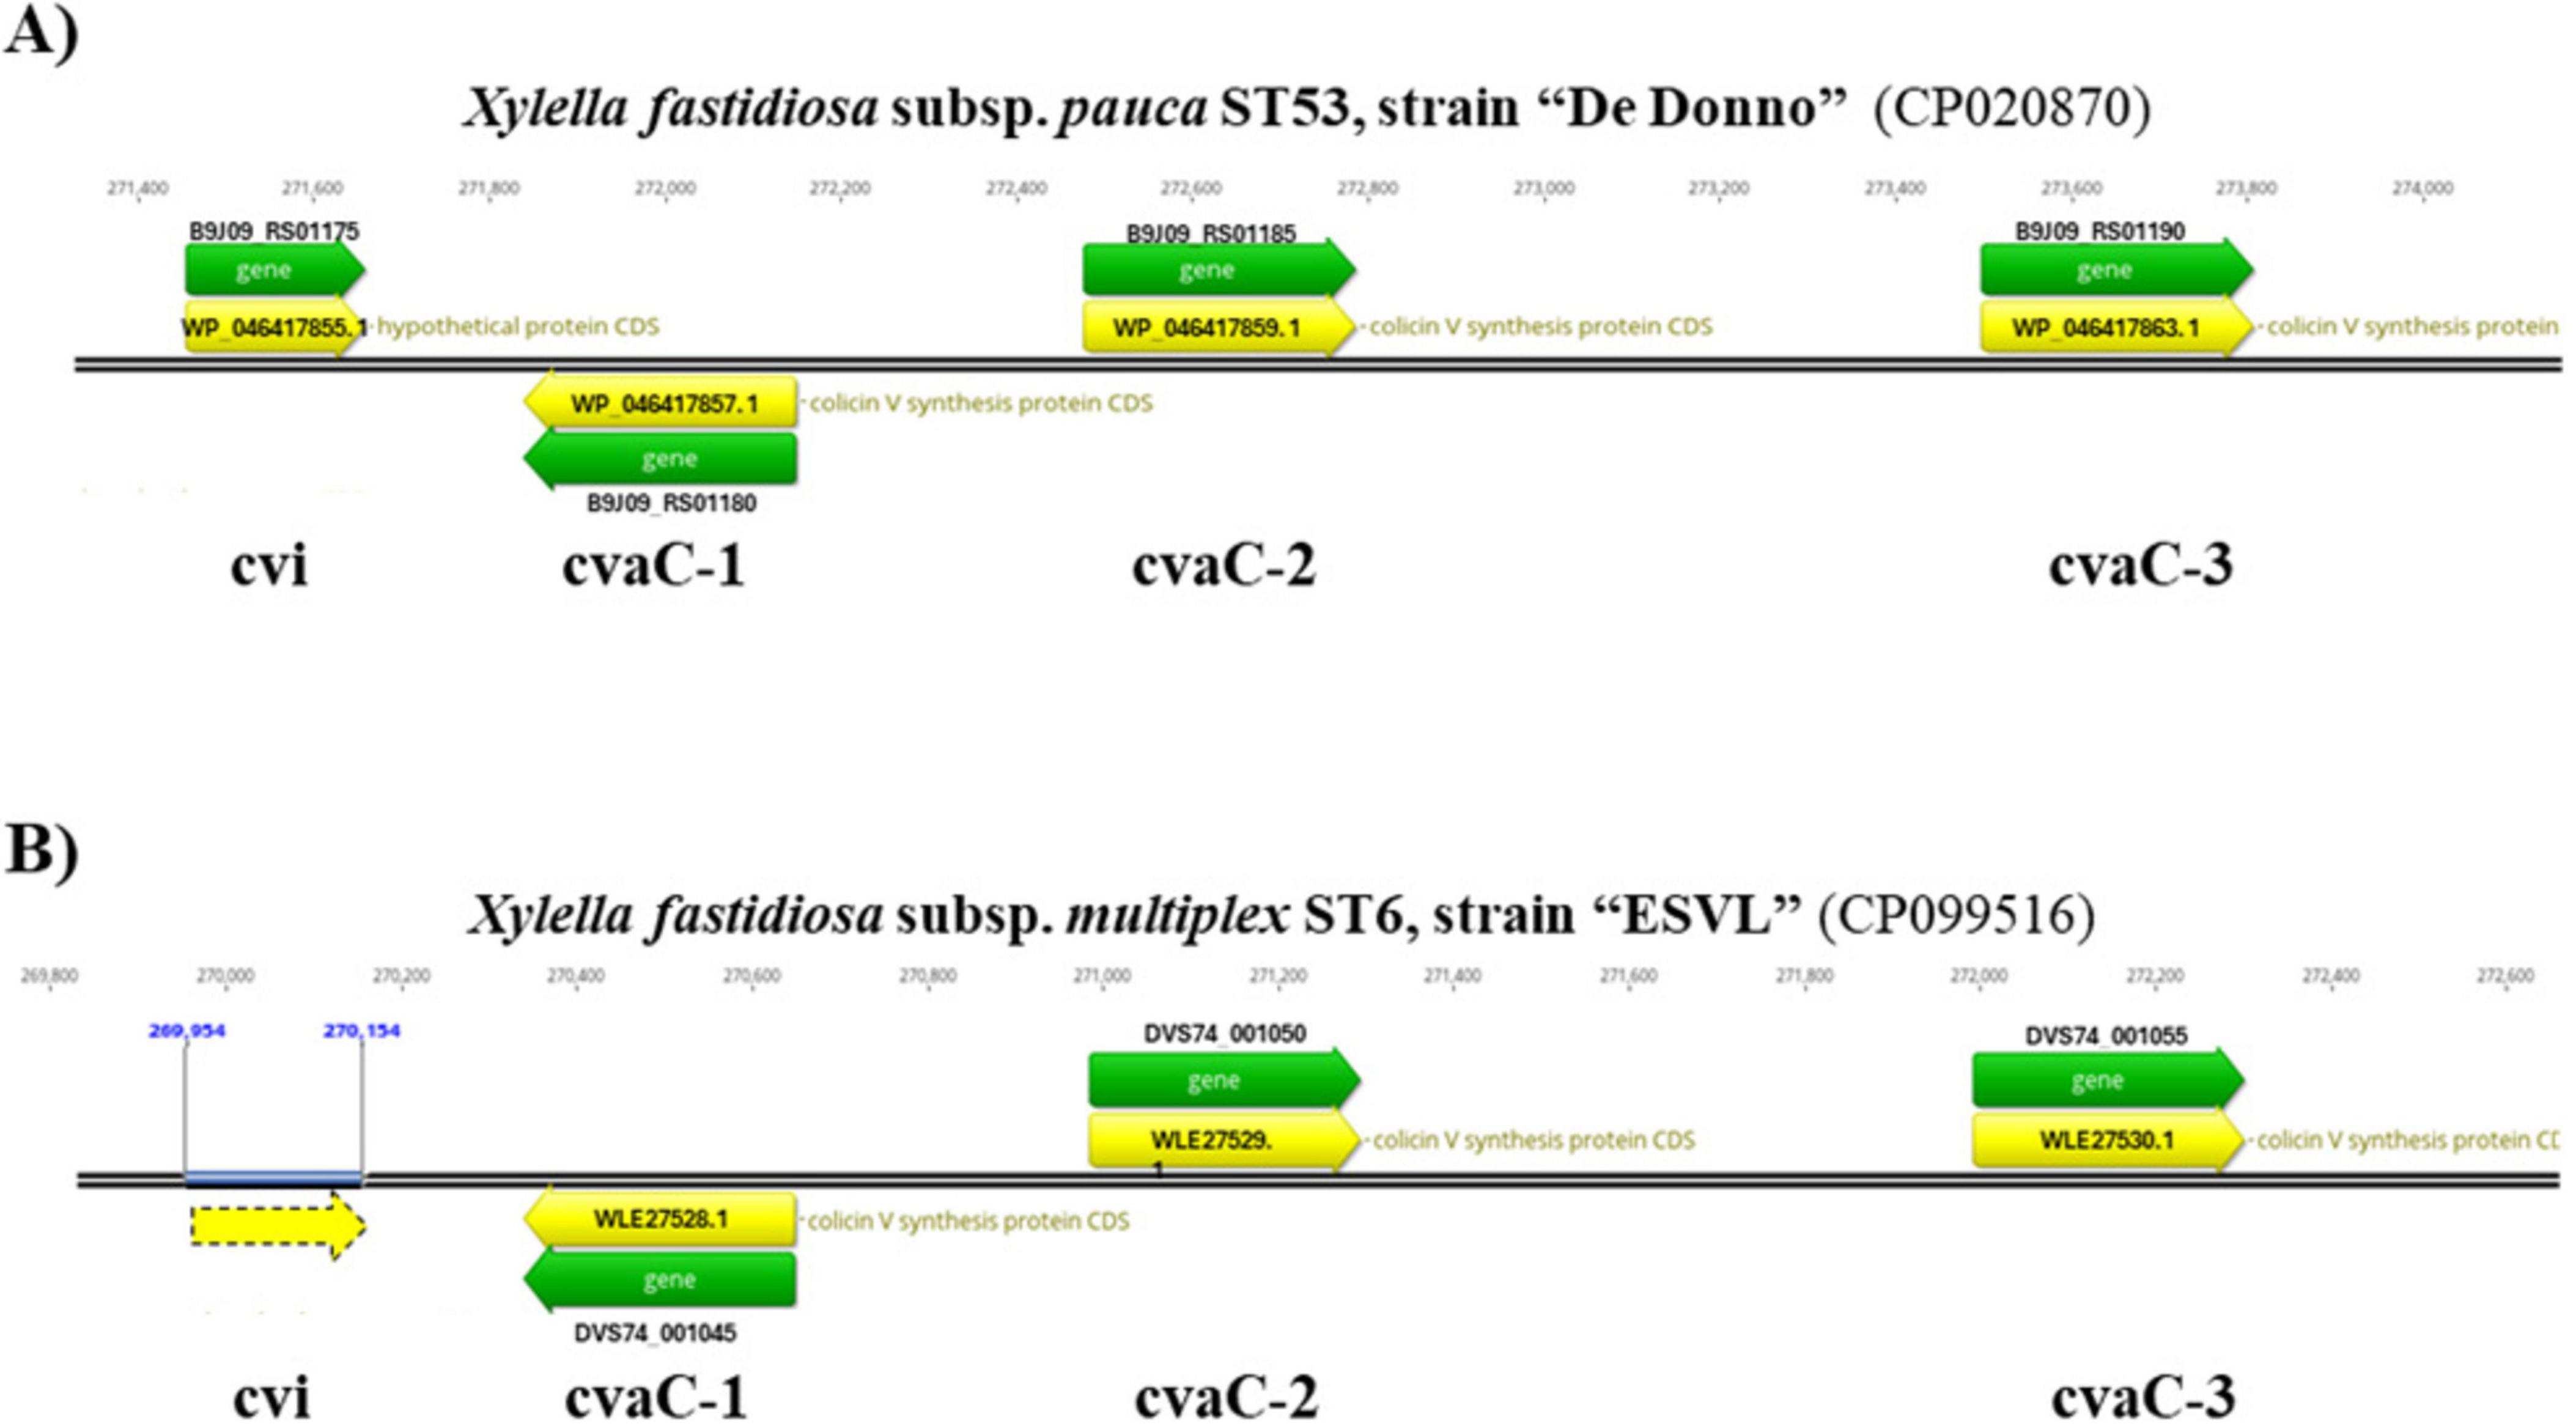
Figure 1. Tripled-tandem organization of the cvaC operon. The correspondent genome regions in the Xfp De Donno (Acc. Nr. CP020870.1) (A) and Xfm ESVL (Acc. Nr. CP099516.1) genome (B) are displayed. In both genomes, cvaC-1 gene is in antisense direction and the self-immunity protein, encoded by cvi gene, is placed upstream of the cvaC operon. In the ESVL genome, the gene coding for the cvi protein is not annotated, even if an ORF (dashed yellow arrow) is present in the sequence. Gene ID (Locus tag) and Protein IDs are also reported.
While several transcriptome studies provided insights into the plant response to Xf infection (Rodrigues et al., 2013; Giampetruzzi et al., 2016; Zaini et al., 2018), the bacterial gene expression in infected plants has been poorly investigated (Surano et al., 2023) or limited to the condition mimicking the xylem environment (De Souza et al., 2003; Parker et al., 2016; Chen and De La Fuente, 2020; Wei et al., 2021). The application of dual RNA sequencing (dRNA-seq) allows for the simultaneous study of the host and the pathogen transcriptomes, detecting pathogen-specific transcripts and host responses in the same tissues, thus providing a comprehensive understanding of their interaction (Westermann et al., 2012) and revealing novel aspects of the infective process. Besides shedding light on the Xf/host interaction, such studies could identify genes of the pathogen to exploit as biomarkers activated at the early stage of the infection, allowing to develop new molecular approaches based on the replication activity and physiological/viability state of the microorganism in a sample (Kovalchuk et al., 2019; Kunjeti et al., 2012; Meyer et al., 2016). Indeed, the identification of biomarkers linked to the primary phase of the infection, prior the symptoms onset and before the pathogen population reaches detectable level, is crucial for successful early detection.
In the present work, a pilot dRNA-seq experiment was carried out to profile the Xf subsp. pauca (Xfp) gene expression in a naturally infected olive tree and the data, compared to the transcriptome profile of in vitro grown Xf, allowed us to identify a bacterial transcript highly expressed in planta during the infection process and conserved across strains belonging to different subspecies. The transcript, annotated as a “Colicin V synthesis protein” (cvaC-1) coding for a virulence-related microcin, resulted in an effective molecular target for a timely diagnosis of Xf active growing cells in tissues of different hosts, by quantitative reverse transcription PCR (RT-qPCR) or conventional two-step RT-PCR.
The developed assay proved to be more sensitive (with higher analytical sensitivity) than the official real-time quantitative PCR (qPCR, Harper et al., 2010) test widely used for bacterial detection. Indeed, when the results of the RT-qPCR assay were compared with those of the standard qPCR targeting the bacterial DNA, it was possible to retrieve additional useful indications about the status of the infection in the host plants, i.e., active replicating and colonizing the plant vs non-growing bacterial cells.
2 Materials and methods 2.1 Bacterial strains and growth conditionsXf strains used in our experiments belonged to subspecies pauca and multiplex (Xfm). More specifically, Xfp strains “De Donno” (later on DD) (CFBP 8402), APL-64 and APL-69, all belonging to sequence type (ST) 53, were isolated between 2013 and 2017 from OQDS affected olive trees in the Salento area (Apulia, Italy) (Giampetruzzi et al., 2017a; Saponari et al., 2017; Sicard et al., 2021). Xfm strain ESVL (CFBP 8684) ST6 was recovered from an almond tree in Guadalest Valley (Alicante, Spain) with notable almond leaf scorch disease signs (ALSD) (Giampetruzzi et al., 2019b). Moreover, Xfm strain “TOS4” having ST87 genotype, was recovered from an infected almond in the Italian region of Tuscany (northern Italy) (Giampetruzzi et al., 2019a) All strains were cultured for 10 days on PD3 agar plates (Davis, 1992) at 28°C from −80°C glycerol stock (50%), re-streaked onto new PD3 plates and cultured for another 7 days before use.
2.2 Total DNA extraction and detection of Xylella fastidiosa in infected plantsTissues for the dual RNA-seq were sampled from a Xfp-infected olive of the susceptible cultivar Ogliarola salentina grown in the Salento epidemic area. Wooden shoots were collected from the sections of the canopy close to branches with severe symptoms of desiccation of 1 or 2 years-old twigs (ca. 0.5 cm in diameter and 1–1.5 cm long) were debarked with a scalpel to obtain ca. 1 g of xylem-enriched tissues that was used to extract total DNAs and RNAs fractions. Total DNAs were extracted using the PureFood GMO and Authentication Kit on the dedicated automatic platform Maxwell® RSC (Promega Corporation, United States) (Loconsole et al., 2021) and processed to assess the Xf presence using a qPCR assay following the protocol of (Harper et al., 2010), with some minor modifications (Amoia et al., 2023).
2.3 Construction of dual RNA-seq library from infected olive treeTotal RNAs extraction was carried out on xylem-enriched tissues of olive obtained as described above. One g of twigs was grinded in a mortar using 10 mL of cold McKenzie grinding buffer (Foissac et al., 2001) plus 2% sodium metabisulfite. The homogenate was added with 20% N-Lauroylsarcosine Sodium salt and centrifuged (13.000 × g) to throw out the plant debris. The clear slurry was extracted twice with TRIzol™ (Invitrogen™) and chloroform in a proportion of 1:1 (v:v) by 5.000 × g centrifugation, and the final supernatant was added with 2.5 volumes of 70% ethanol and stored overnight at −20°C. Total RNAs were recovered by centrifugation at 20.000 × g and resuspended in 450 μL RTL buffer (RNeasy Plant Mini Kit, Qiagen) to be further purified according to the manufacturer’s instructions. RNA concentration and quality were evaluated by measuring the absorbance ratio 260/280 nm with the spectrophotometer NanoPhotometer™ N60 UV/Vis (Implen, München Germany). RNA quality was assessed by evaluating the integrity of 28S and 18S rRNA bands on 1.2% TBE (Tris boric EDTA) agarose gel and by capillary electrophoresis (Supplementary Figure 1).
Total RNAs were used for the dRNA-seq library construction which was outsourced to Vertis Biotechnology AG, Germany, according to a custom protocol based on depletion of ribosomal RNA (rRNA) molecules (plant plus bacteria). The ribodepleted RNAs were first fragmented by ultrasounds (2 pulses of 30 s each at 4°C). Then, an oligonucleotide adapter was ligated to the 3′ end of the fragmented RNA molecules. First-strand cDNA synthesis was primed by an oligonucleotide complementary to the 3′ adapter using M-MLV reverse transcriptase. The first strand cDNA was purified, and the 5’ Illumina TruSeq sequencing adapter was ligated to the 3′ end of the antisense cDNA. The resulting cDNA was PCR-amplified (16 cycles) to achieve about 10–20 ng/μL of DNA using a high-fidelity DNA polymerase and the TruSeq barcode sequences. The cDNA was purified using the Agencourt AMPure XP kit (Beckman Coulter Genomics) and analyzed by capillary electrophoresis (Supplementary Figure 3). For the Illumina NextSeq sequencing, the DNA sample was size-fractionated in the range of 200–550 bp using a preparative agarose gel. An aliquot was also analyzed by capillary electrophoresis (Supplementary Figure 3). The DNA pool was sequenced on an Illumina NextSeq 500 system using 1 × 75 bp read length.
2.4 RNA-seq on in vitro bacterial culturesThree different Xfp ST53 strains (Xfp DD, APL-64, APL-69) grown in vitro were used for RNASeq analysis. Upon scraping bacterial colonies and dissolving them in sterile water to obtain a turbid suspension, cells were centrifugated at 10.000 × g for 10 min at 4°C. Total RNAs were extracted from the three bacterial pellets according to the TRIzol™ Reagent protocol (Invitrogen™) and successively DNAse digested with RNase-free DNase I following the manufacturer’s instruction (Thermo Scientific™), to avoid contamination by genomic DNA. Purity, concentration and integrity of RNA samples were evaluated by agarose gel electrophoresis as described above. RNA samples with a RNA:DNA ratio > 15 and RNA integrity number (RIN) > 7 were employed for libraries construction. Libraries were prepared with the TruSeq stranded total RNA kit construction for microbe with NEBNext® rRNA Depletion Kit (Bacteria). Paired-end sequencing (100 × 2 bp) was performed on an Illumina Novaseq 6000 platform at the Macrogen Europe B.V. facilities (Amsterdam, NE).
2.5 Bioinformatic pipeline analysis of the RNASeq and dRNA-seq librariesThe FastQC tool software was used to assess the quality of the raw reads obtained by the two different RNASeq sequencing approaches. The reference genome data of Olea europaea L. subsp. europaea var. europaea cv Farga v9 (Julca et al., 2020) and Xfp DD (Giampetruzzi et al., 2017b) were downloaded from NCBI database. Raw reads obtained from the dRNA-seq, preliminarily checked for quality and trimmed of the adapters, were first mapped to the cv. Farga genome v9 using TopHat2 (Kim et al., 2013). The remaining unmapped reads were then mapped to the Xfp DD genome. In parallel, raw reads obtained from the RNASeq of the in vitro cultured bacteria were directly mapped to the Xfp DD bacterial genome. Reads count data after mapping on the reference genome (Xfp DD bacterial genome) were determined using SeqMonk software version 1.48.1. Gene expression levels of both RNASeq and dRNASeq were measured as raw count reads per annotated transcript by SeqMonk. Therefore, two abundance matrices of reads to the annotated bacterial genome were obtained and reported in the Excel file for further comparison between the two. The number of counts per annotated transcript was also normalized to 20,000, which was the lowest amount of total mapped reads obtained from the dRNA-seq library.
2.6 RT-PCR and RT-qPCR for gene expression and Xf transcripts detection 2.6.1 Gene expression analysis for validation of the RNA-seq resultsA Sybr-green-based two-step RT-qPCR assay was developed to target three out of four genes forming the cvaC operon in Xf genome. Primers for cvaC-1, cvaC-2 and cvi genes were designed using Primer-Blast tool version 4.1.0, available at NCBI website, and checked in silico for their specificity to target transcripts. The tandem arrangement of the three cvaC copies and the putative self-immunity protein cvi were found to be similarly, organized and annotated in two reference strains Xfp DD and Xfm ESVL (Figure 1).
The three cvaC genes are annotated as “colicin V synthesis protein” in both genomes (Xfm ESVL: Acc. Nr. CP099516.1; protein_ID: WLE27528.1, WLE27529.1, WLE27530.1; Xfp DD: Acc. Nr. CP020870.1; protein_ID: WP_046417857.1, WP_046417859.1, WP_046417863.1) (Giampetruzzi et al., 2017a,2019b; Román-Écija et al., 2023). The cvi gene is functionally annotated as a “hypothetical protein” in Xfp DD (WP_046417855.1) and it is not annotated in Xfm ESVL, although an open reading frame (ORF), underlined with a dashed yellow arrow, is present (Figure 1).
RNA extraction and DNase treatment were performed following the TRIzol™ Reagent protocol (Invitrogen™) and DNase I treatment (Thermo Scientific), respectively; cDNA synthesis was carried out using the M-MLV Reverse Transcriptase protocol (Invitrogen™). RNA fractions were recovered from 7 days old bacterial colonies grown on PD3 medium. The reaction was set up using a 2x Fast SYBR™ Green Master Mix (Applied Biosystems™) according to manufacturer’s recommendations. The following thermal cycling profile was used: 50°C for 2 min, 95°C for 2 min, followed by 40 cycles of 95°C for 15 s, 58°C for 30 s and 72°C for 30 s. Primer sets specificities were confirmed by checking the absence of non-specific amplifications in melting curve analysis, consisting of a continuous 0.5°C increase in temperature from 65 to 95°C. Experiments were repeated in two independent times and each sample was amplified in three technical replicates. The efficiencies of the newly designed primers and the one of housekeeping gene were preliminarily assessed using 10-fold serial dilution of purified bacterial DNA with a known concentration. The stable transcript of the dnaQ gene, encoding a DNA polymerase III subunit epsilon, was used as an internal control to normalize the expression of the other genes (Zaini et al., 2008; Wei et al., 2021). The change of the expression levels of the three target genes (cvaC-1, cvaC-2 and cvi), compared to the dnaQ gene control, was calculated using the 2–ΔCt method (Livak and Schmittgen, 2001). To verify the potential presence of residual DNA after digestion, qPCR reactions without reverse transcriptase enzyme were also set up using the dnaQ specific primers.
2.6.2 TaqMan-based RT-qPCR assay for the detection of cvaC-1 transcript in host plantsBased on multiple alignments of representative Xfp and Xfm genomes deposited in GenBank (Supplementary Figure 2), performed with Geneious version 2023.2.1, of the first copy (cvaC-1) of cvaC operon, a primer pair (col_F/R) and a 6′-carboxyfluorescein/Black Hole Quencher-1-labeled probe (6′FAM/BHQ) TaqMan (col_Prb) were specifically designed using NCBI Primer-Blast tool v. 4.1.0 and PrimerQuest™ Tool (Integrate DNA Technology) for a TaqMan based RT-qPCR. Protocols used for plant RNA extraction and RT-qPCR conditions are described in the paragraph below.
2.6.3 Analytical sensitivity and primer efficiencyTo assess the diagnostic sensitivity of the new cvaC-1 RT-qPCR assay and establish its limit of detection (LoD), total RNA recovered from xylem tissues of a Xfp infected olive, either with the traditional CTAB method (Loconsole et al., 2014) followed by DNase I-treatment or by using the Maxwell® RSC Plant RNA Kit (as described in paragraph 2.7.1) was used. Primer efficiency and analytical sensitivity were determined by calculating the slope value of the standard curves generated with five ten-fold (from 1 to 10–5) serial dilutions of the two digested RNA samples. Each dilution was analyzed in duplicate and the average Cq was calculated. The experiment was repeated in two independent runs. The primer efficiency was computed using the following formula: E = 100 × (10–1/slope – 1). The associated Pearson’s product-moment correlation coefficients (PMCC) were also reported. To further support RT-qPCR results, a primer pair for end-point RT-PCR, covering the entire length of the gene, was manually designed for the amplification of the whole cvaC-1 gene. The diagnostic sensitivity of this assay was assessed by using the same serial dilutions used for RT-qPCR. All primer and probe sequences used in this study are listed in Table 1.
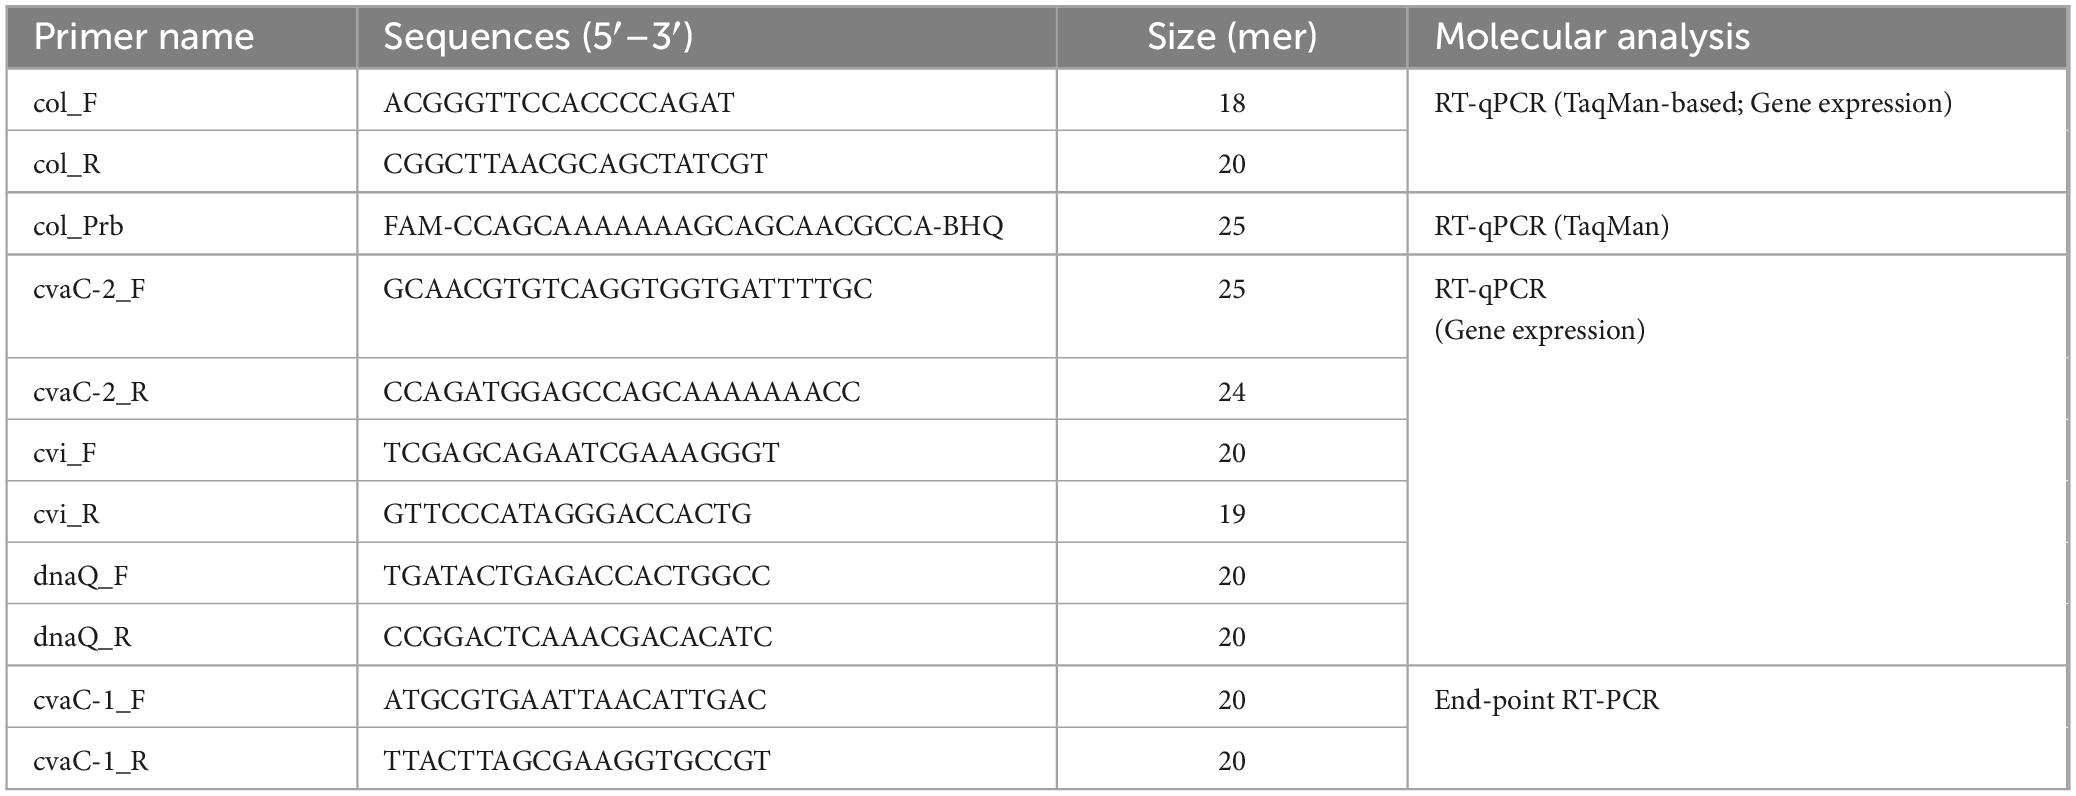
Table 1. RT-qPCR and RT-PCR primer/probe sequences used in this study.
2.7 Monitoring in planta accumulation of cvaC-1 during the infection processTwo bacterial strains, Xfp DD and Xfm ESLV were used to inoculate three different plant species and subsequently monitor the bacterial host colonization by standard qPCR assay (Harper et al., 2010) targeting bacterial DNA (Amoia et al., 2023) in comparison with the newly developed TaqMan-based RT-qPCR assay targeting the cvaC-1 gene. More specifically, the test included 24 olive trees cultivar Ogliarola salentina, 72 periwinkle plants (Catharanthus roseus (L.) G.Don, 1837) cultivar Madagascar and 72 citrus plants (Citrus × sinensis (L.) Osbeck, 1,765) cultivar Madam Vinous. Olive is known to be highly susceptible to Xfp DD infections while, in previous greenhouse tests, the strain ESLV needle-inoculated in olives proved to be able to colonize the plants to a lower extent than Xfp DD and without inducing typical shoot dieback and desiccations (Saponari, personal communication). Two-years-old olive plants with several ramifications were used, which allowed for the inoculation of multiple twigs, thus requiring a lower number of plants compared to the other species. These latter consisted of seedlings grown as single stems. Inoculated plants were grown in a quarantine greenhouse at 25°C ± 2 and relative humidity (RH) of 65% ± 10. For needle inoculation, bacterial suspensions were prepared by dispersing scraped colonies in sterile distilled water and their titers were adjusted to an optical density (OD600) of 1.0. Two small drops (8–10 μL each) of the suspension were placed at the level of two consecutive leaf nodes in the basal part of the main stem for citrus and periwinkle and multiple twigs for olive. Drops were pricked 4–5 times with a sterile entomological needle. Overall, experiments on olive and citrus lasted 12 months, while on periwinkle 6 months. Sampling and testing were performed on a monthly basis, starting 1 month after the inoculation, as follows: for the first three (in periwinkle) and 6 months (in olive and citrus) a total of six stem portions, each comprising an inoculation point (samples identified with the suffix PI), were collected and tested. For the remaining experimental period, in addition to the six inoculation points, the portions of the stem located 10 cm above the last inoculation point (samples identified with the suffix UP) were also harvested and tested (Figures 2A, B, C). Conclusively, 54 samples for each strain/species combination were tested (Figure 2D).
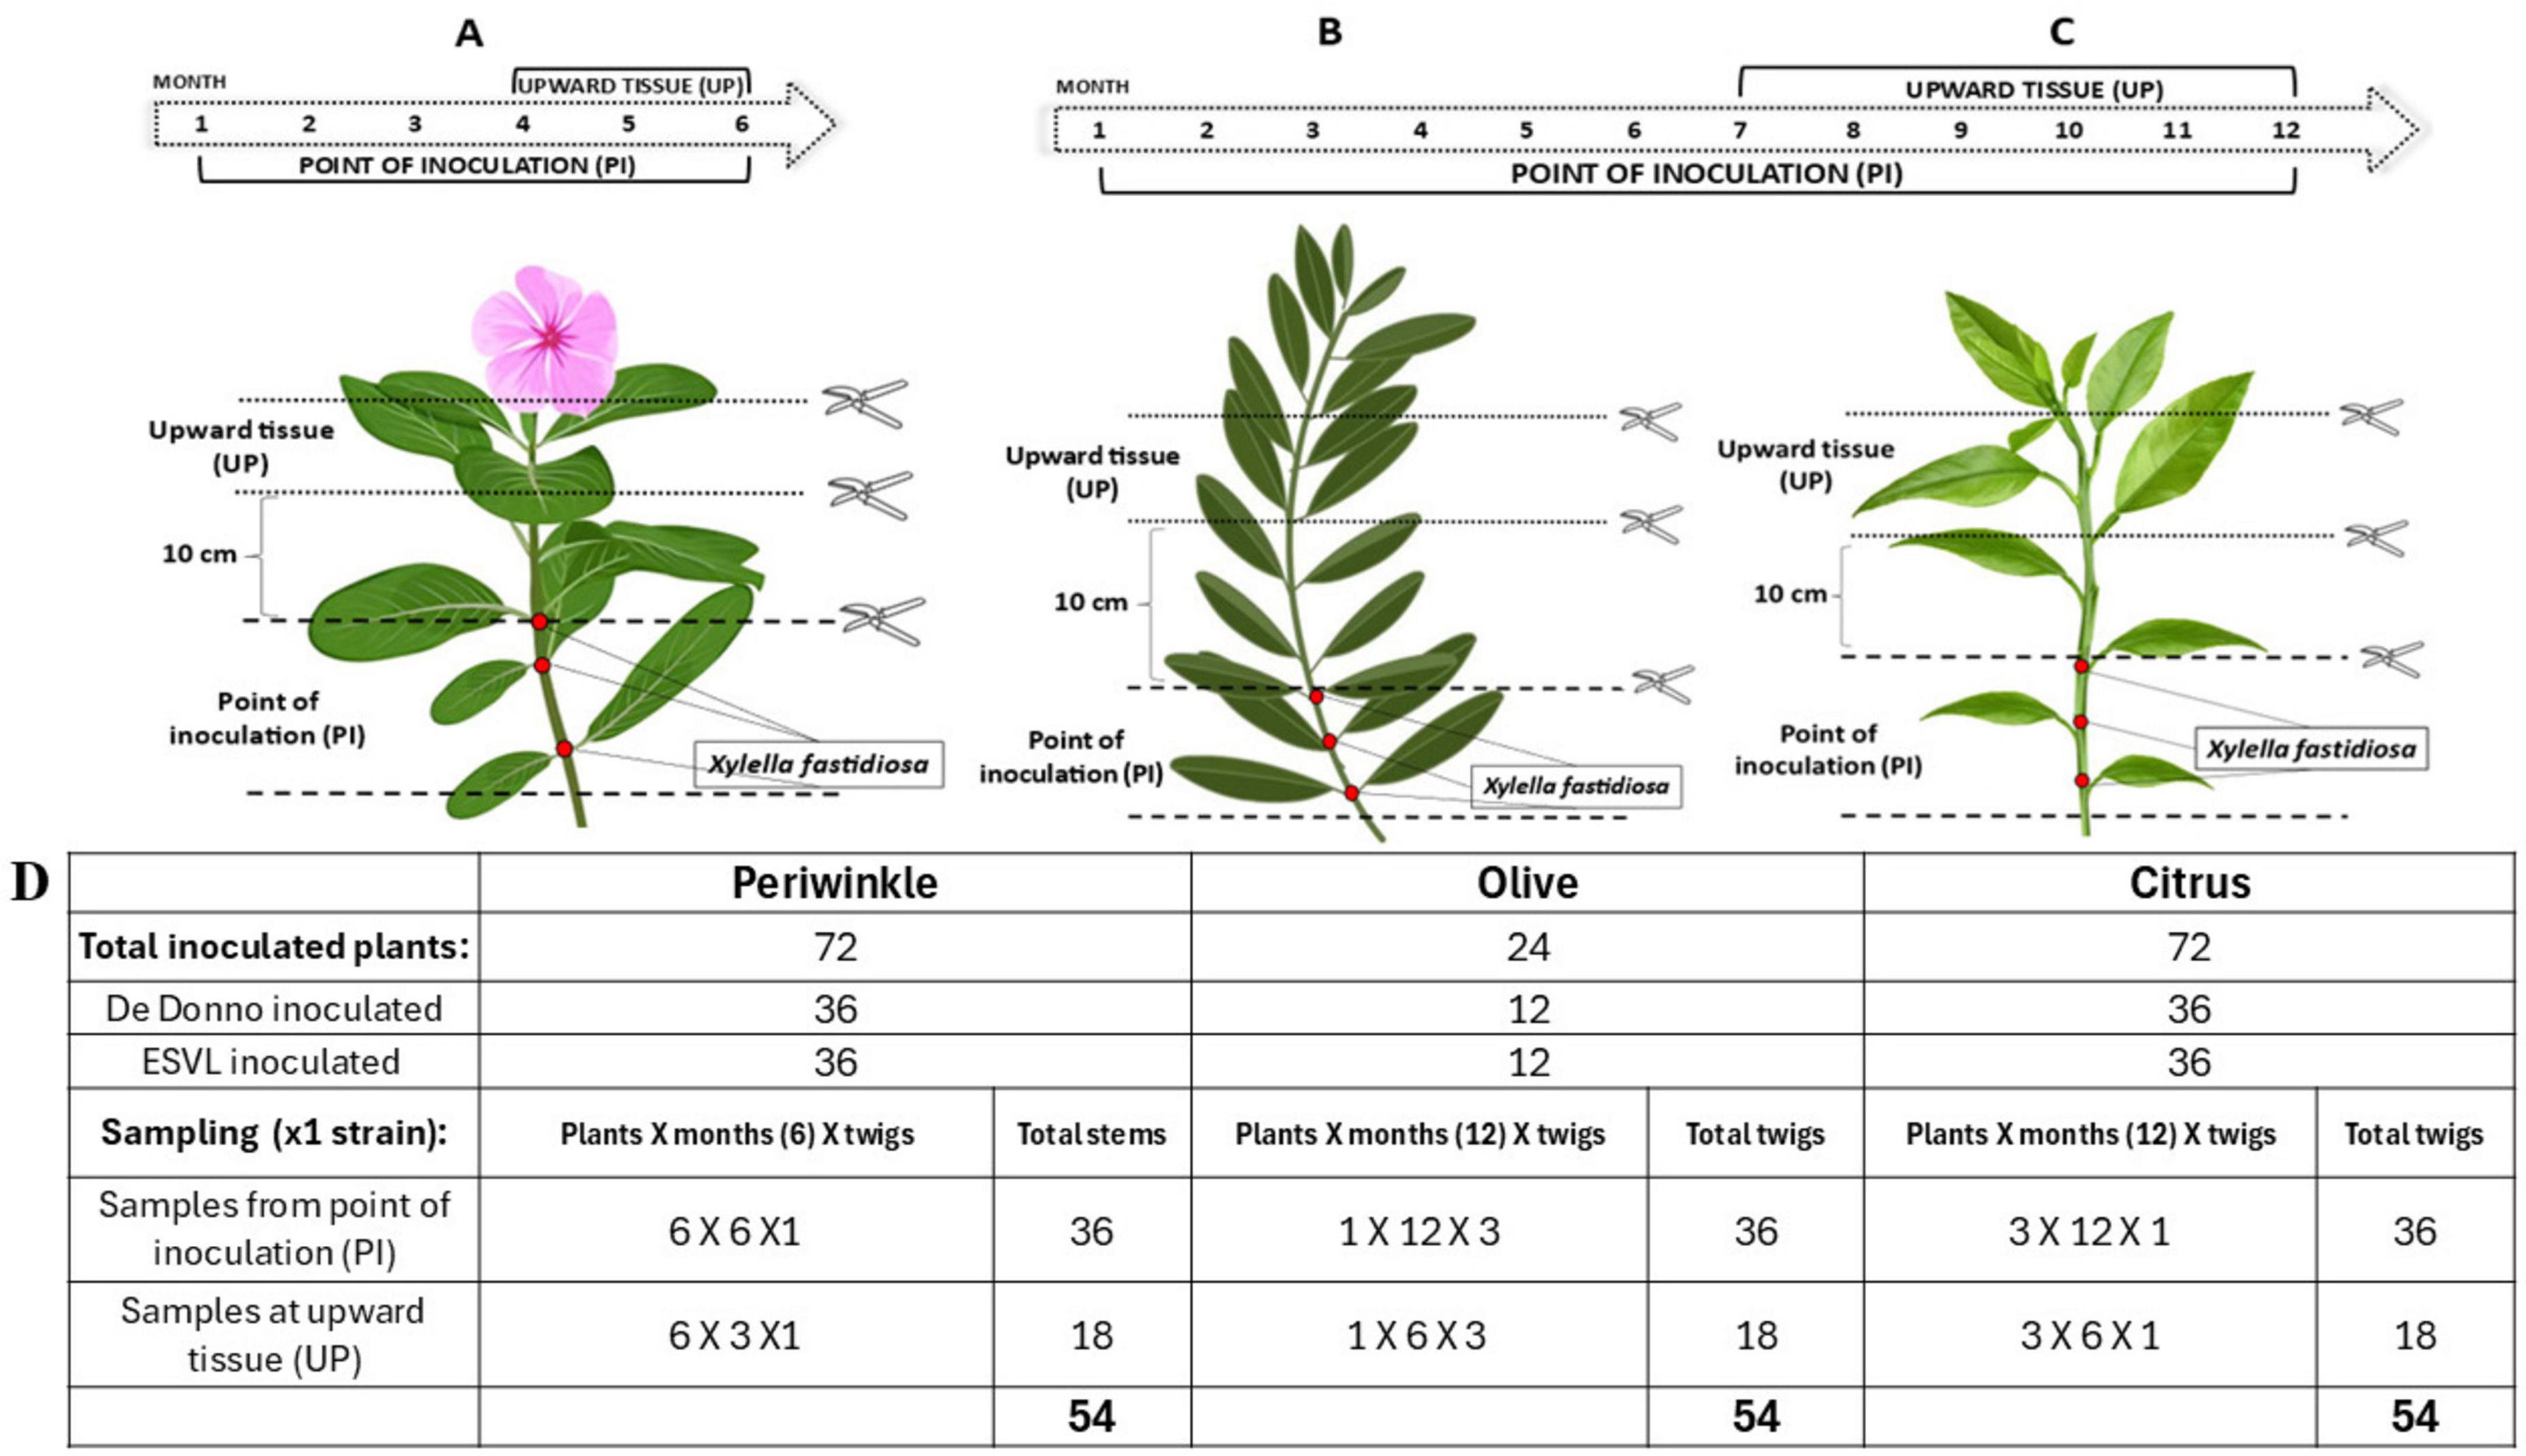
Figure 2. Schematic cartoon representing the time course of Xf inoculation experiment. For all the three species (periwinkle, olive and citrus), two consecutive needle-inoculation points (red dots) were made at the basal part of the stem. Six and three stem/twigs, harboring one or two inoculation points (PIs) were collected once per month for the first three and 6 months, respectively from the periwinkle (A) and from the olive (B) and citrus (C) plants. The remaining inoculated stems/twigs were monthly collected, by sampling the PIs and the 10 cm portions above the last inoculation point (UP) during the last 3 and 6 months of the trial for periwinkle and olive and citrus plants, respectively. Overall, 54 tissue samples per species per Xf-strain were analyzed. (D) Summary table of sampled tissue for each species throughout the whole trial.
2.7.1 Nucleic acids extraction and PCRs conditionsSmall pieces of stems/twigs were used to extract total DNAs with the commercial PureFood GMO Authentication Kit and total RNAs with the Maxwell® RSC Plant RNA Kit on an automated extraction platform. Total DNAs were employed to set up qPCR reactions for the amplification of the bacterial rimM gene (Harper et al., 2010), using the conditions described by (Amoia et al., 2023). Whereas total RNAs, previously digested with DNAse I/RNAse free, were tested by RT-qPCR and RT-PCR using the primers designed in this work (Table 1).
Briefly, 500 mg of tissue was homogenized in the presence of commercial CTAB (Cetyltrimethylammonium bromide) buffer added with chilled 2% 1-thioglycerol and heated at 65°C for 15 min; the clear homogenate was loaded in the cartridge according to manufacturer’s instructions, including the step of the DNase I treatment. The eluted RNAs (50 μL) were stored at −80°C until processing. For cvaC-1 quantitative amplification, the optimal primer/probe concentrations in the reaction mix were determined as those yielding the highest reporter fluorescence (RFUs) and the lowest threshold cycle (Ct). To establish the best annealing temperature of the new primer/probe set, a temperature gradient was carried out on a range spanning from 58 to 63°C. One-step RT-qPCR reactions were performed in a final volume of 11 μL containing 5.5 μL 2x iTaq Universal Probes Reaction Mix (Bio-Rad, Hercules, CA, USA), 0.3 μL each forward and reverse primer (10 μM; col_F/R), 0.2 μL FAM-labeled probe (col_Prb), 0.2 μL iScript Reverse Transcriptase (RNAse H ++ MMLV enzyme), 1 μL (up to circa 100 ng μL–1) of digested RNA sample and nuclease-free water to the final volume. Each sample was amplified in duplicate and the average Cq was considered. All qPCR and RT-qPCR analyses were run in a Bio-Rad CFX96 Real-Time PCR Detection System (Bio-Rad, Hercules, CA, USA). Data acquisition and analysis were performed using the CFX Maestro 1.1 version N. 4.1 software (Bio-Rad, Hercules). The threshold line was automatically set by the software or manually adjusted when necessary. To carry out RT-PCR, cDNA was first synthesized using the above-mentioned standard reverse transcription protocol. Then, PCR reaction mix was set up as follows: 2x GoTaq® Green Master Mix, 0.5 μL of each primer (cvaC-1_F/R), 1 μL of cDNA and nuclease-free H2O to 20 μL final volume. The PCR program included: one cycle at 95°C for 3 min, 35 cycles at 94°C for 30 s, 58°C for 30 s, and 72°C for 30 s, followed by a final extension at 72°C for 5 min.
2.7.2 Re-isolation in pure culture of bacterial strainsA few of the periwinkle plants displaying systemic infections, upon the inoculation of both strains (Xfp DD and Xfm ESLV), were used for re-isolation of the inoculated bacterial strains 6 months after the inoculations, before ending the experiment. Systemic infection was assessed by testing tissues distant from the inoculation points that gave positive results in qPCR for the detection of Xf (Montilon et al., 2022). Stem pieces were washed under tap water, surface-sterilized in 2% sodium hypochlorite for 3 min, soaked in 70% ethanol for 3 min and rinsed three times in sterile water. Cutted smaller pieces were automatically macerated in an extraction bag (Bioreba) in presence of sterile 1x Phosphate Buffered Saline (PBS) buffer (0.05 M NaCl, pH 7.2) and three consecutive ten-fold dilutions of the recovered sap were plated on periwinkle wilt gelrite (PWG) agar plates (Hill and Purcell, 1995). Plates were incubated for 3–4 weeks at 28°C and periodically inspected for the growth of Xf colonies.
2.8 Validation of the cvaC-based detection assays in chronically infected and symptomatic olive plantsSystemically infected olives (i.e., olives where Xf was detected by qPCR also in tissues far from the points of inoculations) were used to test the reliability of the RT-PCR and RT-qPCR detection assays for the identification of bacterial RNA and discriminate between tissues supporting active bacterial multiplication (i.e., infected vegetating shoots) and those harboring non-growing cells, likewise infected desiccated plant tissues in which the bacterial cells are not sustained any multiplication process, as Xf is not a saprophytic bacterium and requires living plants, specifically the xylematic system, to survive and cause disease. Infected plants were obtained by grafting onto healthy 2 years old olive plants (cv Ogliarola salentina), cuttings collected from field naturally infected trees of the same cultivar. Upon graft taking and sprouting, the occurrence of the bacterium in the new shoots was assessed, and 48 plants yielding qPCR-positive reactions were retained for the experiment, along with 6 Xf-free plants of the same cultivar. Six of the 48 plants were treated with tetracycline by trunk injection, delivering the antibiotic directly to the xylem where Xf multiplies, to assess the impact of the antibiotic on the bacterial multiplication rate as well as the efficiency of the newly developed cvaC-1-based assays to monitor the effect of such applications. Previous in vitro and in planta studies have shown that tetracycline could inhibit Xf growth leading to a reduction or temporal suppression of symptoms in treated plants, but none of the treatments eliminated the bacterium permanently (EFSA Panel on Plant Health (PLH), 2016). Briefly, at 12 months after grafting, corresponding to 6 months after the application of tetracycline for the treated plants, when approximately half of the plants started to show mild to severe shoot dieback and desiccation (Supplementary Figure 3), samples consisting of small pieces of twigs were collected. In the case of symptomatic plants, these consisted of desiccated, withered, and dried tissues. The DNA and RNA fractions were recovered as previously described. An aliquot of the DNA was used to set up the qPCR assay for the conventional detection of the bacterium, whereas an aliquot of the purified and DNA-digested RNA was used to arrange the two-step RT-PCR and the one-step RT-qPCR reactions, both targeting the cvaC-1 transcript.
2.9 Data analysisRegression analysis for analytical sensitivity was performed in R environment, using Rstudio version 4.3.1. According to the normal distribution of results, parametric (Paired t-test) or non-parametric (Wilcoxon Signed Rank Test) analysis was performed between qPCR and RT-qPCR Cq data in SigmaPlot v.15.0. P-values connected to the significance of both tests are also reported. GraphPAD Prism 9.3.0 software was also employed to perform the correlation analysis and the Principal Component Analysis (PCA) of qPCR/RT-qPCR results for tetracycline-treated/non-treated samples, and generate whisker plots with Cq data obtained from qPCR/RT-qPCR on artificially inoculated plants. The correlation between RT-qPCR cvaC-1 and qPCR by Harper et al., 2010 was determined using Spearman’s correlation coefficient.
3 Results 3.1 Colicin V precursor is highly transcribed in infected oliveThe olive tree S2, displaying the lowest quantification cycle (Cq) value (< 20, corresponding to a bacterial population in the range of 107–106 CFU/mL) among the 12 screened by qPCR, was selected for the total RNAs extraction and the construction of the dRNA-seq library. The sequenced library generated 40,261,113 raw reads. After the quality check, 31,407,417 (78%) reads were aligned to the olive genome (cv. Farga v9) and the resulted unmapped reads (8,853,696) were aligned to the Xfp De Donno (Xfp DD) reference genome (CP020870), resulting in 21,411 aligned reads to the bacterial genome (sequencing reads available from NCBI BioProject ID PRJNA1141272) (Table 2). Reads mapped to the Xfp DD genome were used to determine the abundance of annotated bacterial transcripts which consisted of 2,319 genes (GCF_002117875.1_ASM211787v1_genomic.gff.gz) including 6 ribosomal RNAs (rRNA), 49 transfer RNAs (tRNAs), 3 non-coding RNAs (ncRNAs), 1 transfer-messenger RNA (tmRNA) and 2,260 coding protein sequence (CDS). The raw counts were normalized to 20,000 mapped reads to obtain expression values comparable to the bacterial RNASeq data set obtained from the in vitro grown Xf cultures. Only 125 out of the 2,319 annotated genes were covered by a number of mapped reads greater than 10, and only 10 genes were covered by over 100 reads (Supplementary Table 1, mapped reads in dual RNA-seq; S2 column). Unexpectedly, the gene with the highest number of mapped reads (6,770 normalized counts) codes for a “colicin V precursor” (B9J09_RS01180, i.e., the first gene in the cvaC operon of Xf, indicated in the text as cvaC-1), and was much more expressed than the rnpB gene (B9J09_RS09380), an essential bacterial catalytic RNA (RNase P) known to be highly transcribed (Parker et al., 2016; Ellis, 2020) (Figure 3 and Supplementary Table 1).
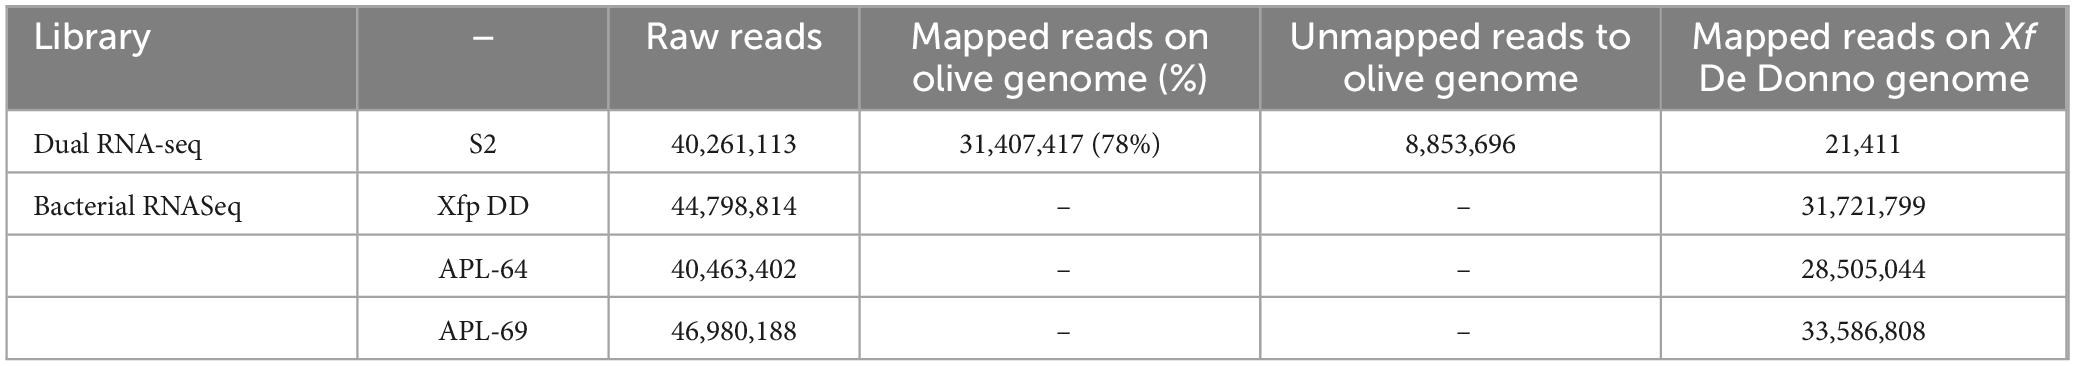
Table 2. Statistics on RNASeq sequencing libraries (DualRNA-seq and bacterial RNASeq).
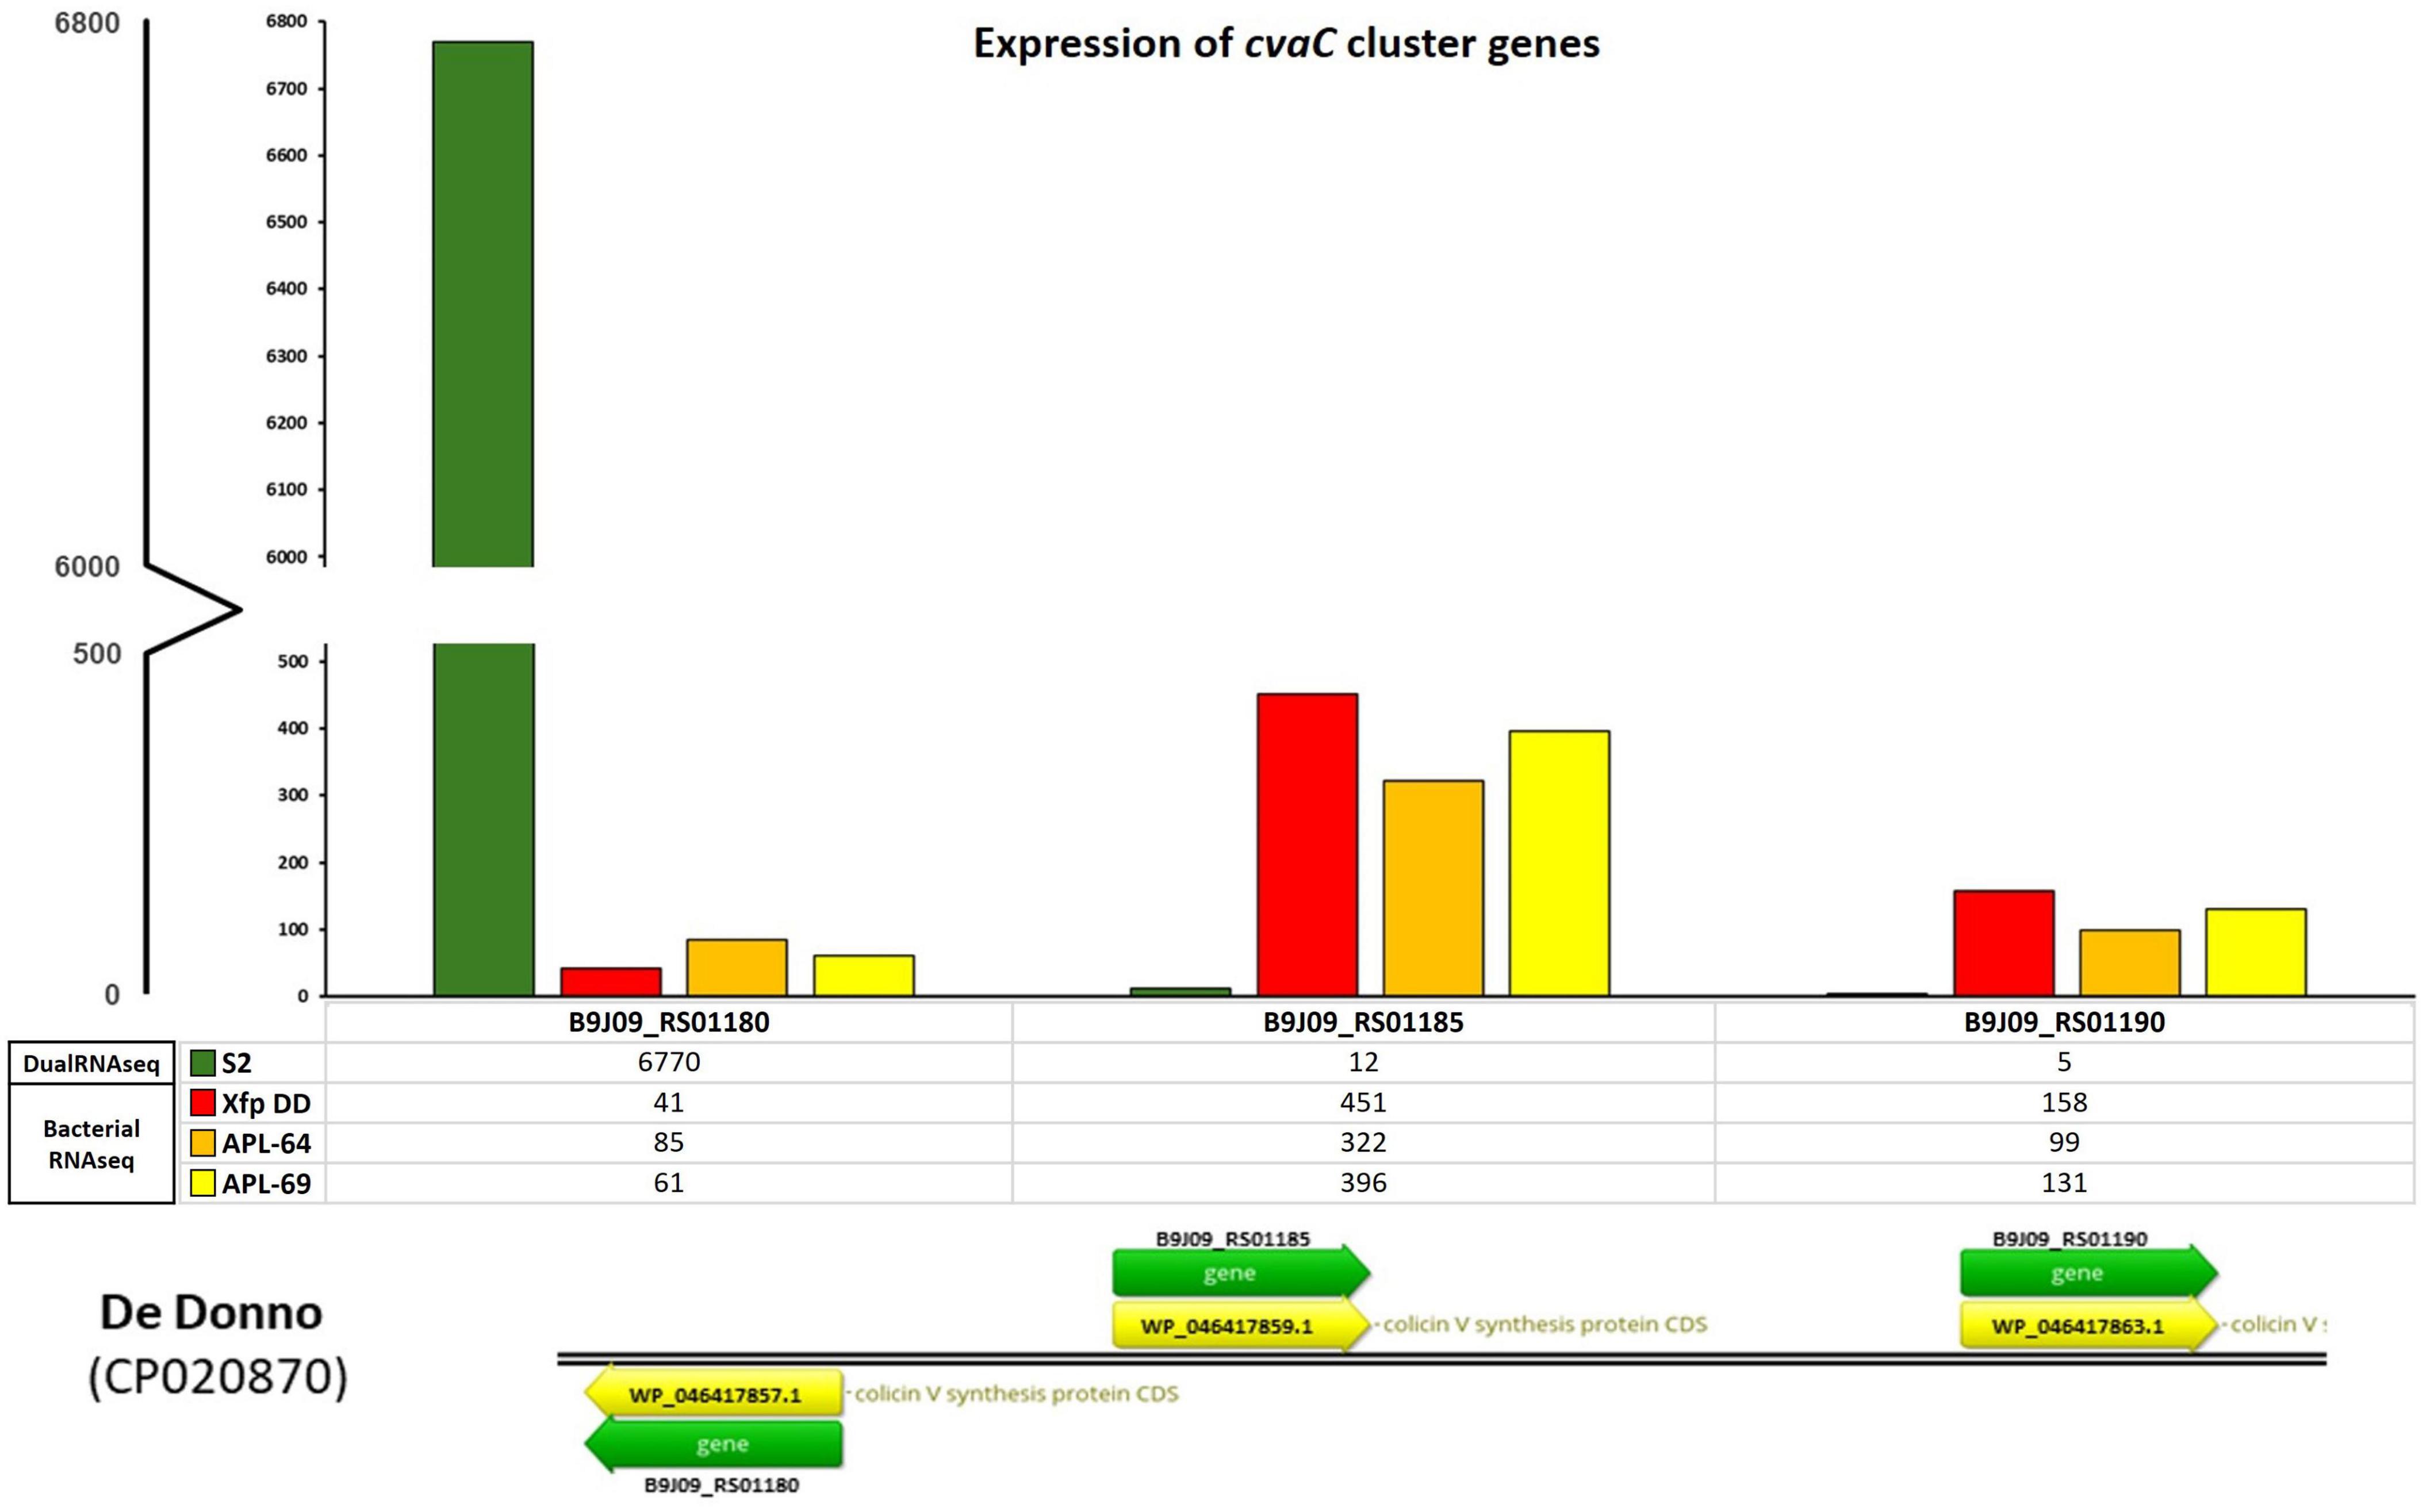
Figure 3. cvaC-operon transcripts from bacterial RNASeq and dual RNA-seq. Expression of cvaC genes (cvaC-1, cvaC-2, cvaC-3) in planta from dual RNA-seq (S2) and in vitro from the RNASeq of Xf cultured strains (Xfp DD, APL-64 and APL-69). The numbers of normalized reads of the three genes in the operon and the legenda are reported on the y-axis
3.2 RNA sequencing on in vitro cultured strains of Xylella fastidiosaTo extend the dataset of bacterial gene expression profiles, three RNASeq libraries were constructed and sequenced starting from total RNAs extracted from three cultured strains of Xfp ST53 (Xfp DD, APL-64, APL-69; NCBI BioProject ID PRJNA505446) grown in vitro on PD3 agar plates. High-throughput sequencing of these three libraries generated 44,798,814, 40,463,402 and 46,980,188 raw reads, respectively for Xfp DD, APL-64, APL-69. After the quality check, 31,721,799 (Xfp DD), 28,505,044 (APL-64) and 33,586,808 (APL-69) reads were mapped to the Xfp DD reference genome (CP020870) with an average coverage of 1000X (sequencing mapped reads available from NCBI BioProject ID PRJNA1141272) (Supplementary Table 1, mapped reads in Bacterial RNASeq columns). Beside the rnpB (B9J09_RS09380) and ssrA (small stable RNA A; B9J09_RS11595) genes, the gene B9J09_RS06930 annotated as Blp family class II bacteriocin, was the highest expressed transcript with 505, 476 and 455 normalized reads in the three RNASeq libraries (Supplementary Table 1, mapped reads in Bacterial RNASeq columns). The number of reads mapping cvaC-1 “colicin V precursor gene” (B9J09_RS01180), found to be overexpressed in planta, was approximately ten times lower, ranging from 41 to 85. By contrast, the number of reads mapping the cvaC-2 gene, the second gene of the cvaC operon, was much higher and similar to that of the most expressed in vitro genes (between 322 and 451 reads) (Supplementary Table 1, mapped reads in Bacterial RNASeq columns, Figure 3).
3.3 Validation by RT-qPCR of the expression of cvaC genes in cultured bacterial strainsThe RT-qPCR results showed that cvaC-1 transcript is upregulated under the in vitro culturing conditions for the three strains, although its expression level (fold changes) was low in Xfp DD and Xfm strain TOS4 and higher in Xfm strain ESVL (Figure 4). Conversely, cvaC-2 transcript was over-expressed in Xfp DD compared to both Xfm cultured strains. The RT-qPCR results for these target genes confirmed the RNASeq data on the Xfp strains, with the expression (2–ΔCt) ratio between cvaC-2 and cvaC-1 (7,6653) almost overlapping the average ratio of the reads cvaC-2: cvaC-1 recovered from RNASeq (7,0722) for the three Xfp-cultured strains Xfp DD, APL-64 and APL-69. For the strains tested, a low expression level was consistently detected by RT-qPCR for cvi gene (Figure 4). Direct qPCR amplification of the RNA extracts produced high quantification cycle (Cq) values (> 35), indicating that the RNA templates did not contain any residual DNA traces.
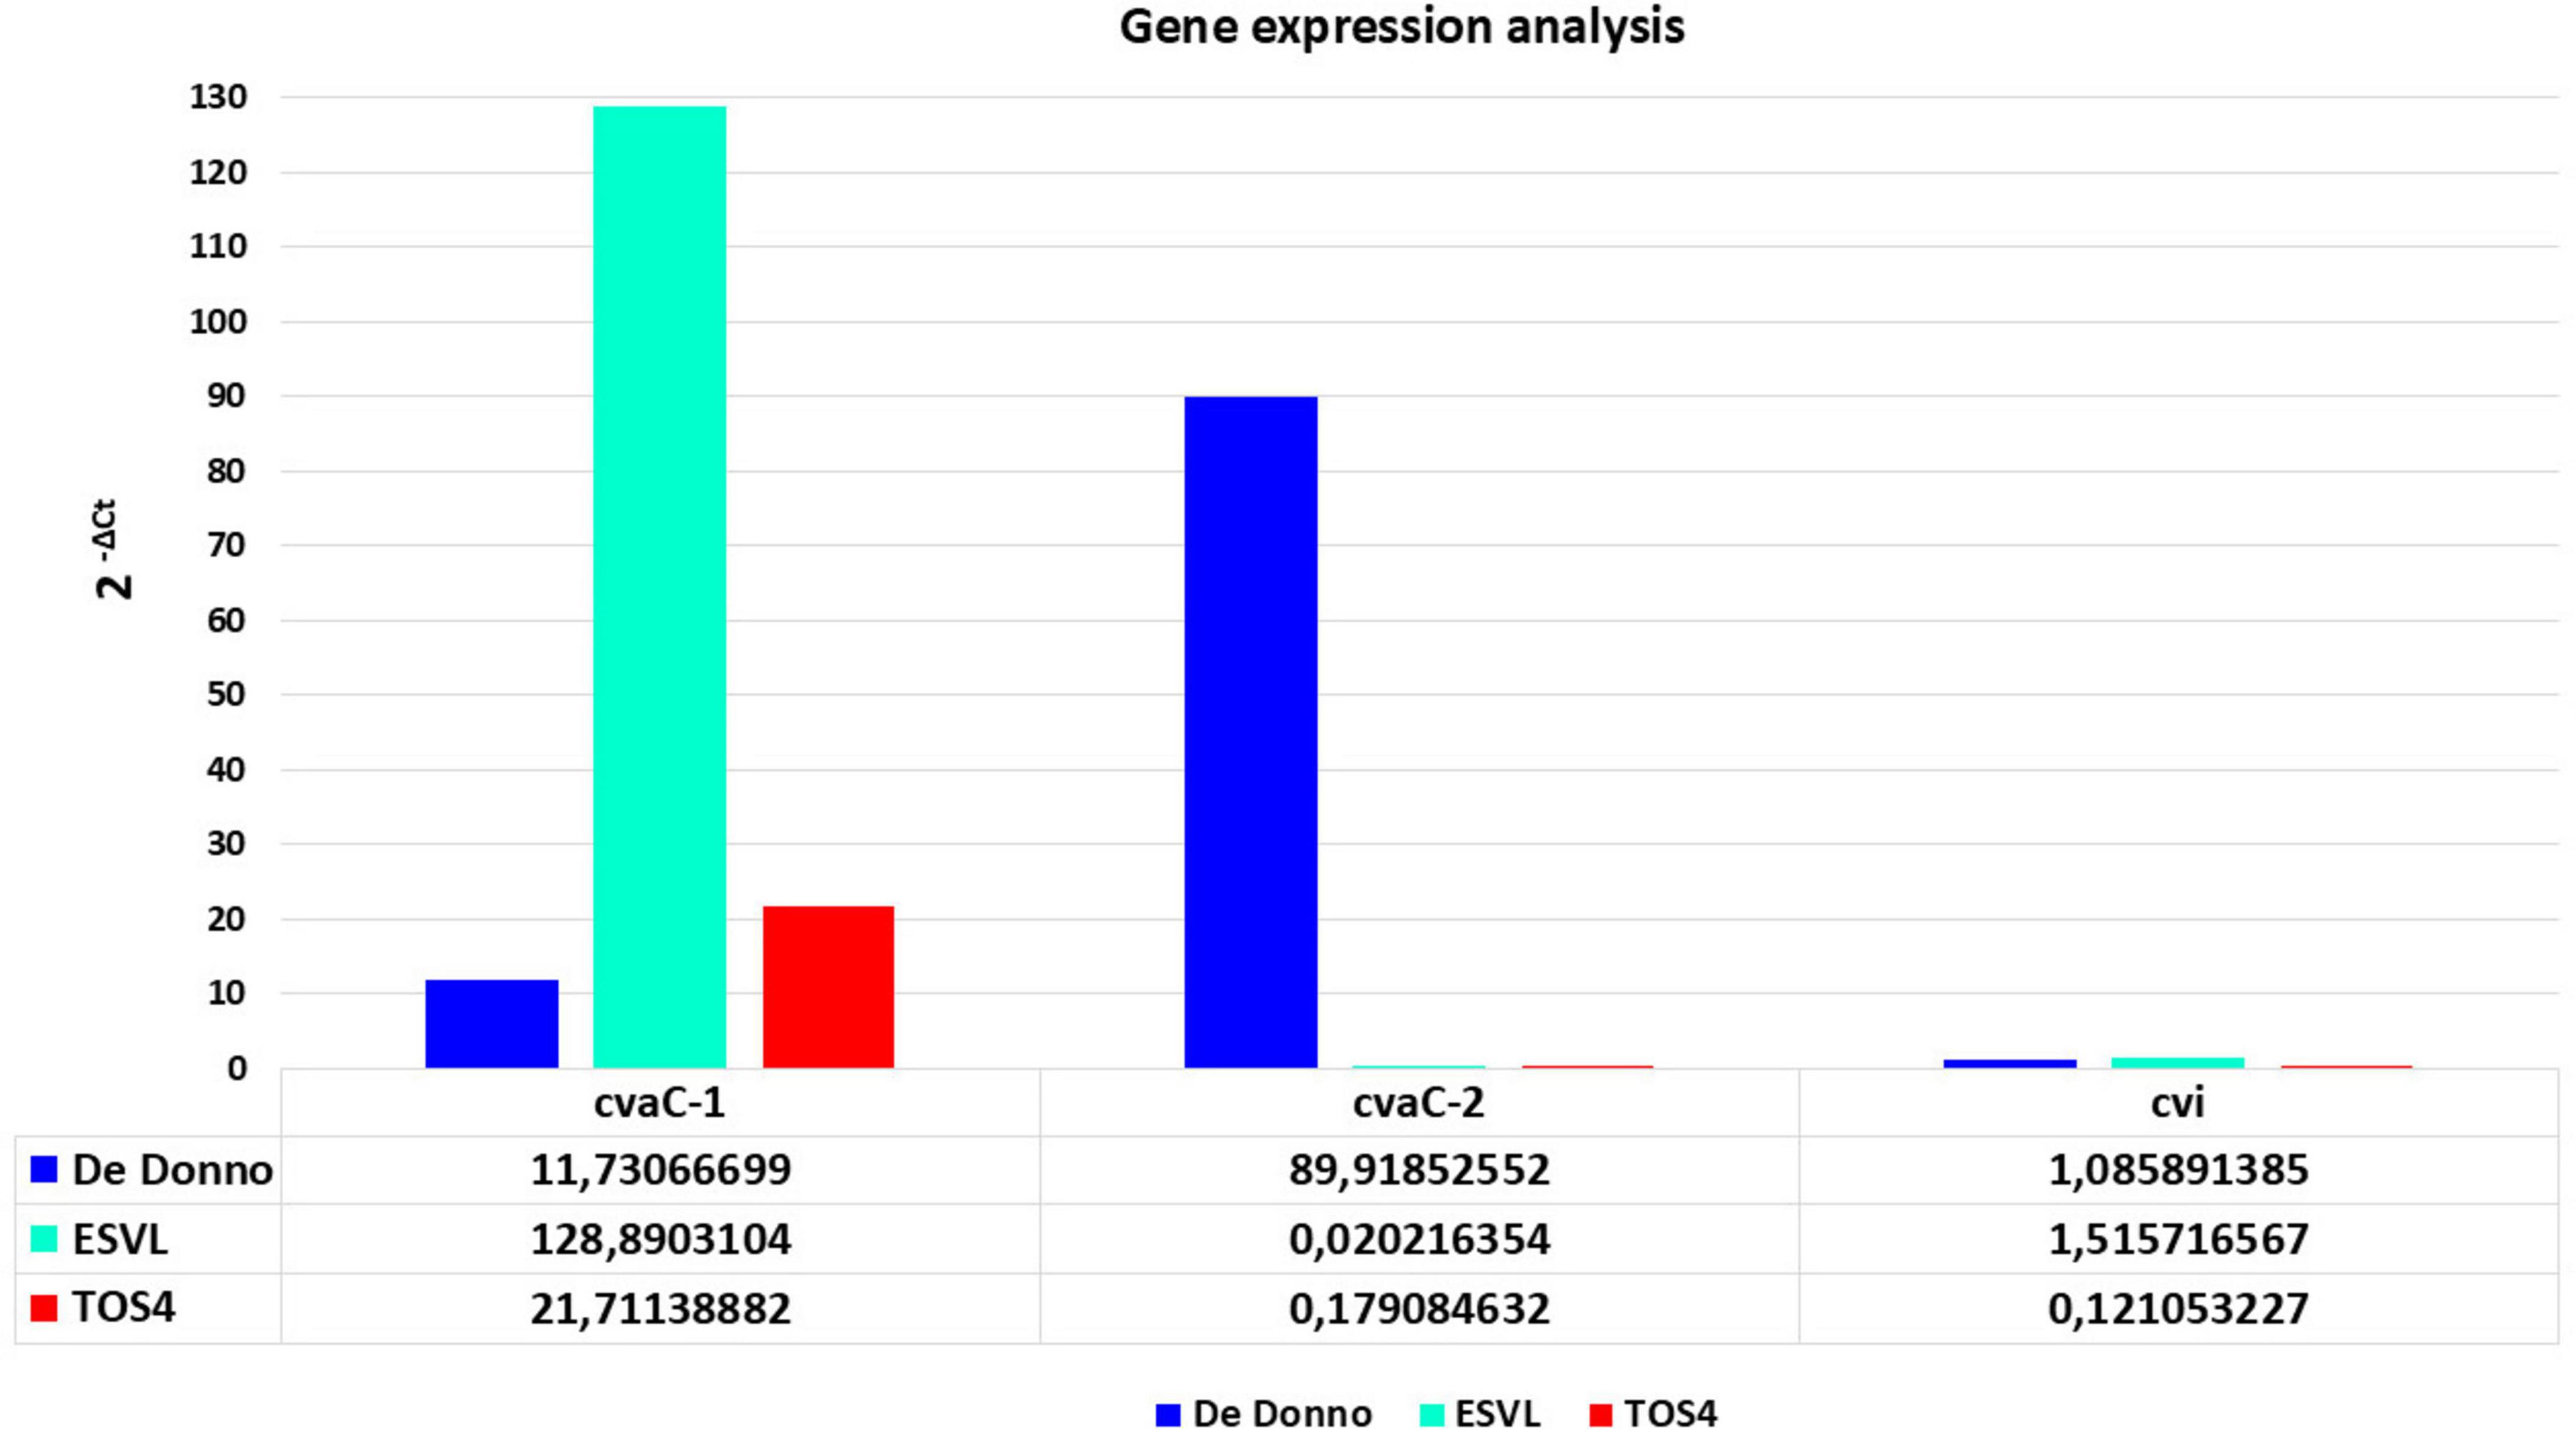
Figure 4. RT-qPCR gene expression analysisof cvaC-1, cvaC-2 and cvi,of in vitro grown bacterial strains of Xf (Xfp DD, Xfm ESVL and TOS4). The 2– ΔCt expression values of the three selected genes, compared to the stable one of housekeeping gene dnaQ, are shown on y-axis. RT-qPCR reactions were done in triplicate.
3.4 In planta confirmation of the expression of cvaC-1 transcriptThe primer pair col_F/R, amplifying a 69 bp fragment, coupled with a TaqMan probe (col_Prb) successfully detected the cvaC-1 transcript by RT-qPCR assays in artificially inoculated plants at different time points post-inoculation. The optimal annealing temperature was defined at 59°C. Thus, the selected RT-qPCR parameters were as follows: an initial reverse transcription step at 50°C for 10 min; polymerase activation and DNA denaturation at 95°C for 3 min followed by 40 cycles of denaturation at 94°C for 15 s and annealing at 59°C for 30 s. No reaction amplifications were observed in negative internal control (NIC) and no template control (NTC). When Cq values were plotted against the logarithm of the dilutions, standard curves with very good linearity and high confidence level, having R2 values of 0.9845 and 0.9972, respectively using the RNA recovered by the CTAB-based method and with the Maxwell® kit, were generated (Figures 5A, B). In both cases, the efficiencies recorded (103.91 and 107.62%) fit in the optimal range of 90–110% (Bustin et al., 2009). These values are similar to those previously reported for the qPCR assay (Amoia et al., 2023). High Pearson’s correlation values (0.9922 and 0.9986, for RNA CTAB-based and Maxwell® RSC Plant RNA kit extracted, respectively) were achieved. The linear regression equations associated with calibration curves are displayed in Figures 5A, B. In addition, primers cvaC-1_F/R designed to amplify the whole gene in RT-PCR, yielding a 309-bp amplicon, successfully identified the entire transcript in systemically infected plant tissues, although as expected, the diagnostic sensitivity of the assay was lower than the RT-qPCR test (Supplementary Figure 4). Even so, this assay proved to be highly specific in identifying cvaC-1 intact and complete transcripts, such as those associated with bacterial multiplication under optimal conditions. Indeed, negative results (no amplifications) were consistently obtained with RT-PCR (i.e., amplifying the whole gene) even if the same total RNAs purified from desiccated tissues, where the bacterial growth and multiplication could be suffering, generated very high Cq values (> 30) in RT-qPCR.
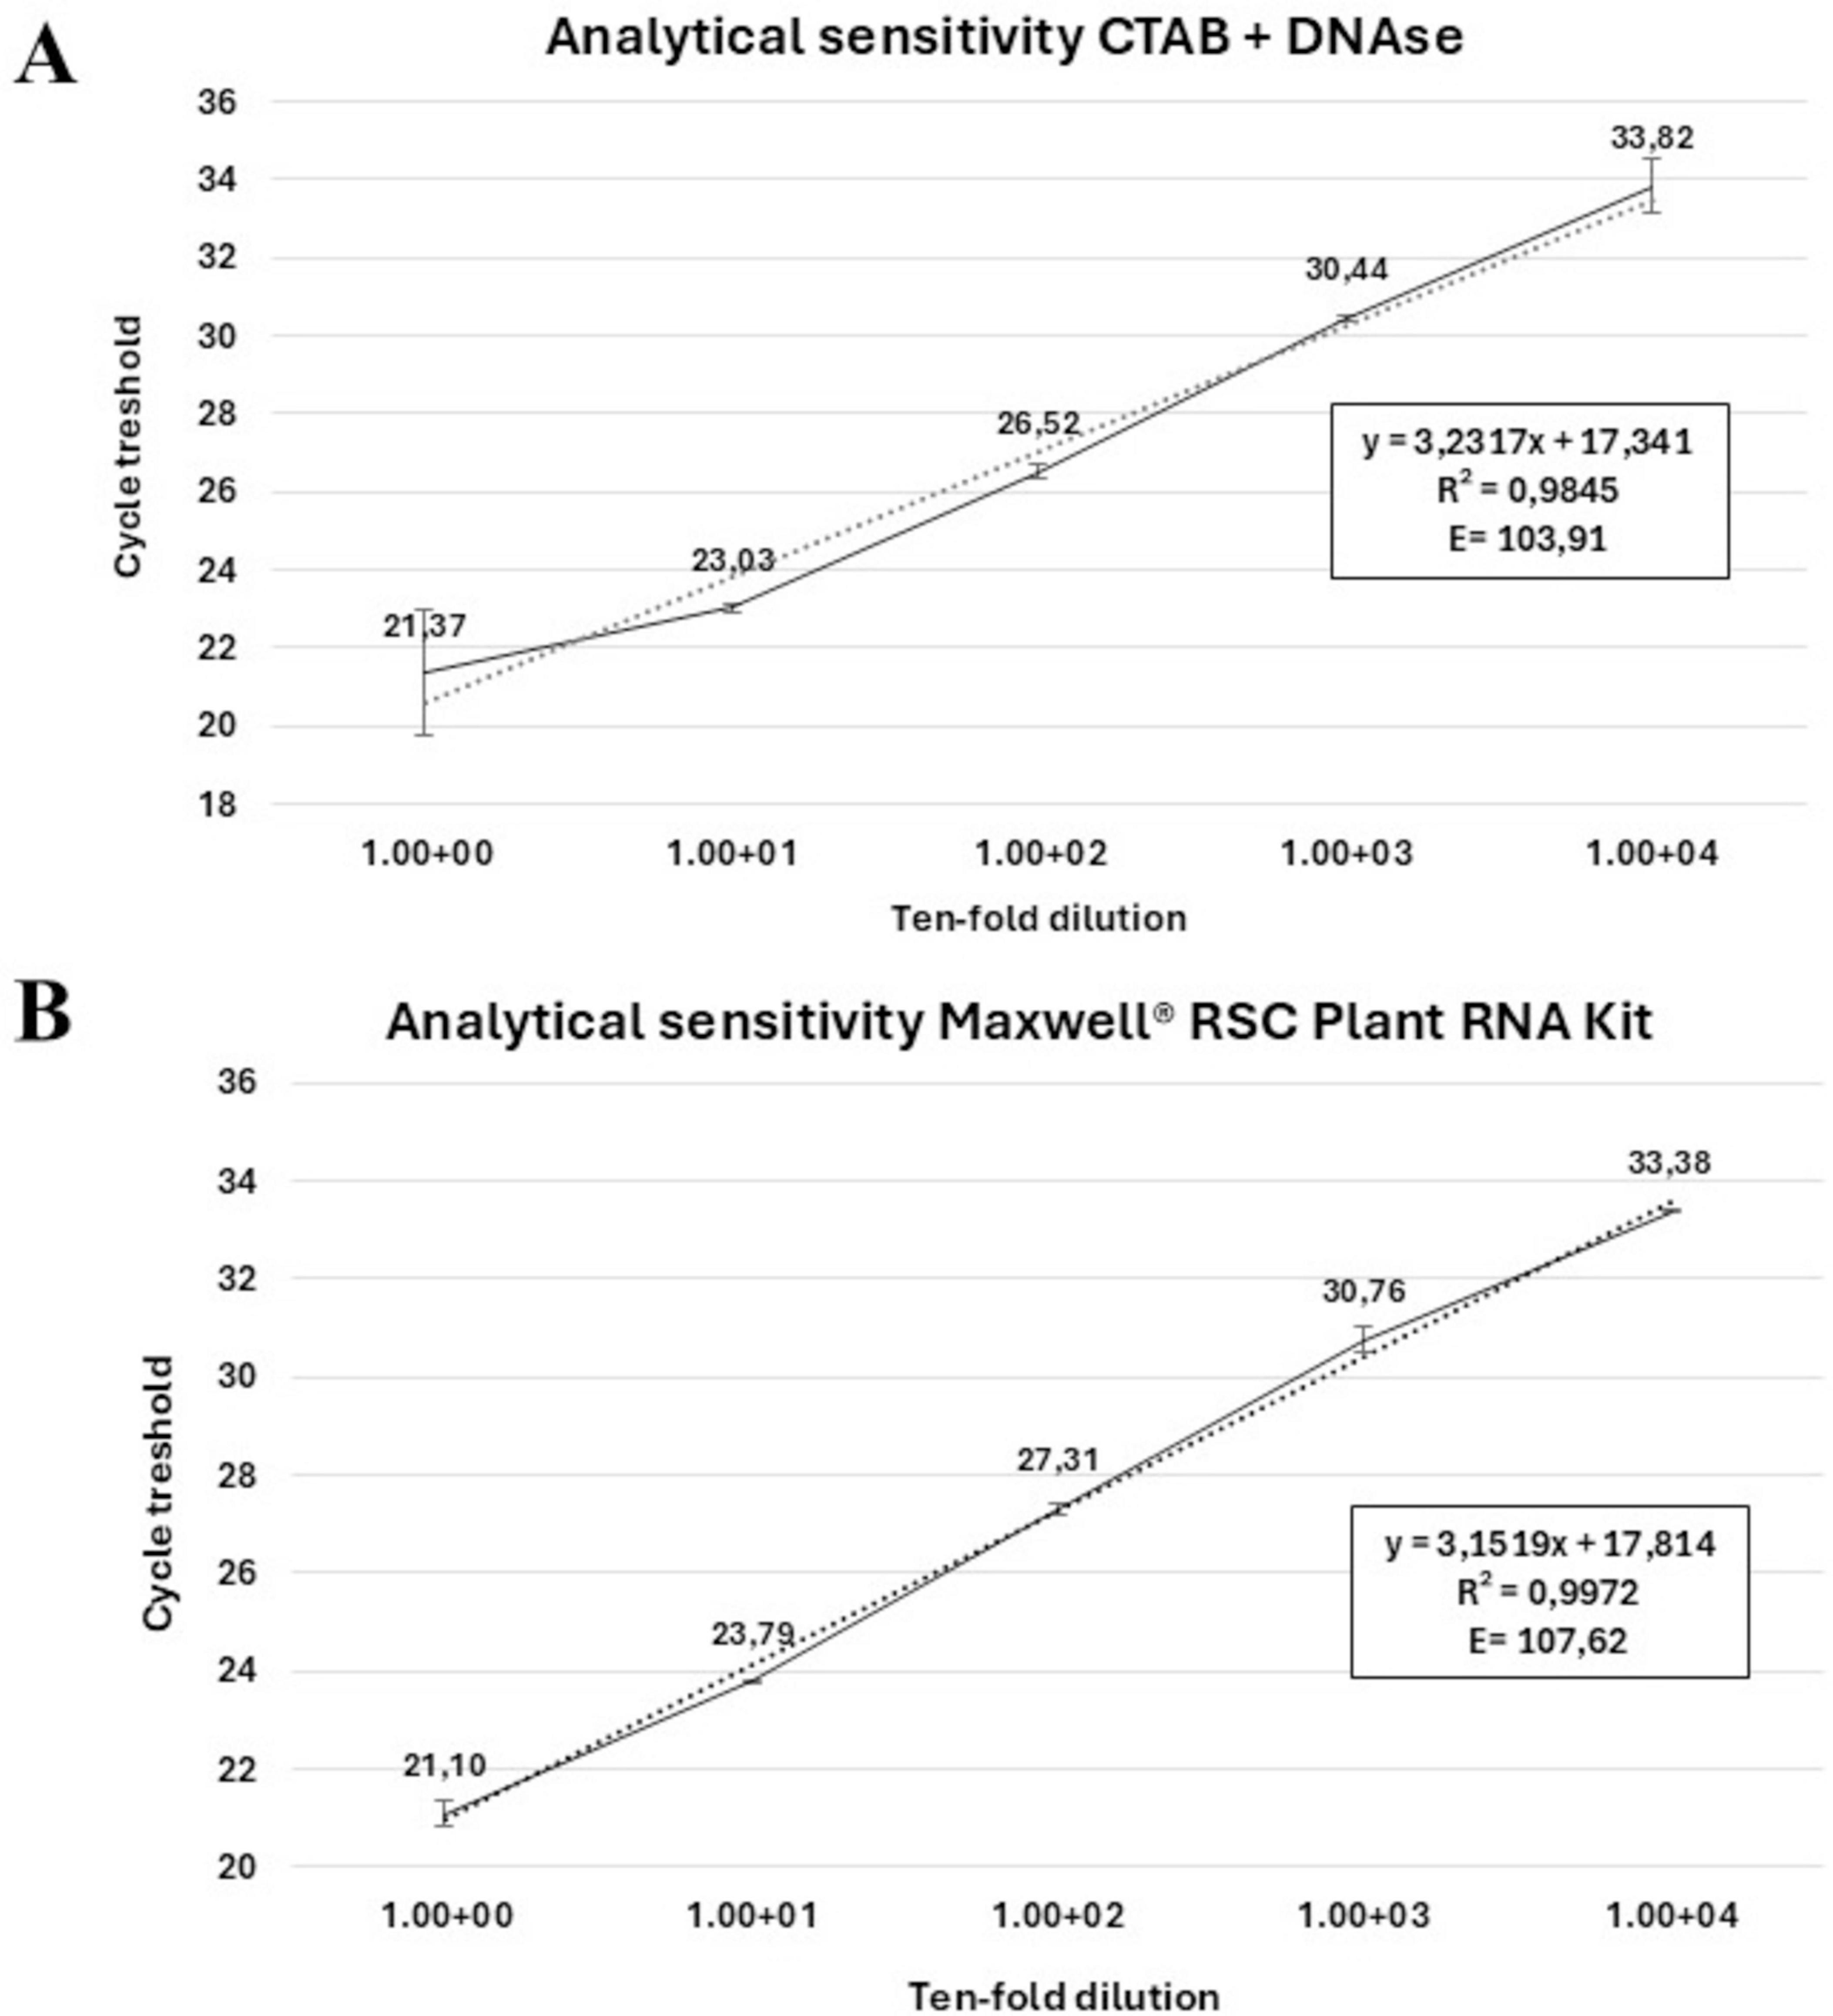
Figure 5. Analytical sensitivity of TaqMan-based RT-qPCR. Linear regression curves of the RT-qPCR assay targeting the cvaC-1 transcript. Standard curves were generated using 10-fold dilution series of the total RNA extracted from a Xfp infected olive twig purified with (A) a CTAB-based protocol with DNA digestion and (B) the RSC Plant RNA kit. Quantification cycles on the y-axis are correlated to the log of dilutions on the x-axis. In both figures, the equation regression, Pearson’s correlation values (R2) and % primer efficiency are also reported.
3.5 cvaC-1 detection in artificially inoculated plantsAltogether, 54 samples/strain (in total 108 for each species) were analyzed during the 6 and 12 months of the trials, respectively for periwinkle, and olive and citrus. Results of the qPCR and RT-qPCR assays for each plant species (olive, citrus and periwinkle) and samples (PI and UP) are reported in detail in Supplementary Figure 5, while Cq values, cumulative from all sampling times, are graphically reported in Figure 6. In Xfp DD-infected olives (Figure 6A), the average Cq values obtained by RT-qPCR were always lower than those recovered by qPCR assay, both for the samples collected at the point of inoculation (samples identified with the suffix PI) (25.69 ± 3.54 vs 28.01 ± 1.88; P-value < 0.001) and 10 cm above the last inoculation point (samples identified with the suffix UP) (27.74 ± 4.64 vs 31.36 ± 3.92; P-value = 0.00161). The opposite was observed in Xfm ESVL-infected olives where the average Cq values of infected sample “PI” were 31.38 ± 2.98 vs 30.38 ± 1.72, with no significant difference between them, and those from “UP” samples corresponding to 32.27 ± 1.74 vs 34.30 ± 2.88 (P-value = 0.008), respectively in the RT-qPCR cvaC-1 amplification vs qPCR (Figure 6). These findings denote that Xfp DD replicates at higher rate than Xfm ESVL in olive trees and corroborate the results of previous works (Nunney et al., 2019); Saponari, personal communication) indicating a reduced rate of olive colonization and pathogenicity of Xfm ESVL in olives. Indeed, Nunney et al. (2019) reported that enzyme-linked immunosorbent assay (ELISA) does not detect any positive olive inoculated with Xfm strain “Dixon,” which belongs to the same ST (ST6) of ESVL used in this study. Citrus species have been proved to be immune to Xfp ST53-isolate and no report of infections caused by strains of the subspecies multiplex have been so far recorded. The results of our experiments are consistent with the predicted immunity to both bacterial strains. More specifically, samples collected at the PI yielded low Cq values in conventional qPCR, i.e., 25.76 ± 2.10 and 27.51 ± 2.00 for Xfp DD and Xfm ESVL inoculated plants, respectively, while generated high Cq values by RT-qPCR targeting cvaC-1 (Xfp DD 30.89 ± 2.60 vs Xfm ESVL 30.20 ± 2.21), indicating that no active bacterial multiplication occurred at the inoculation points following the needle inoculations and that the low Cq values generated in qPCR corresponded to the detection of the cells of the inoculated bacterial suspensions. When the portions collected 10 cm above the point of inoculations were tested, Cq values close to the detection limit were obtained both by qPCR (31.95 ± 2.91 for Xfp DD and 32.86 ± 2.21 for Xfm ESVL) and RT-qPCR (32.87 ± 2.07 for Xfp DD and 33.60 ± 1.12 for Xfm ESVL). Again, the Cq values recorded in RT-qPCR for cvaC-1 were higher than those obtained for the conventional qPCR assay, suggesting the lack of an active multiplication of the bacteria. Moreover, the observed high Cq could be ascribed to the passive translocation of the inoculated bacterium through the xylem flux. Periwinkle confirmed its high susceptibility to the bacterium. For both strains, Cq values obtained at the inoculation points in qPCR were close or lower than 26; while the Cq values generated in RT-qPCR were close or lower than 28, with a P-value = 0.029 vs < 0.001. Tests on the UP portions of the plants showed different results for the two bacterial strains. Plants inoculated with Xfm ESVL strain generated low and equivalent Cq values in qPCR (24.36 ± 2.73) and RT-qPCR (24.94 ± 1.91). Conversely, the comparison of qPCR and RT-qPCR results (32.03 ± 5.01 vs 29.89 ± 3.84; P-value = 0.010) showed that periwinkle is a less conducive host for Xfp DD (Figure 5). Indeed, re-isolation of both bacterial strains was successfully achieved from the distal part of the inoculated plants (UP), obtaining 1.05 × 10⁵ and 5.9 × 10³ CFU/mL, respectively from Xfm ESVL and Xfp DD infected periwinkles.
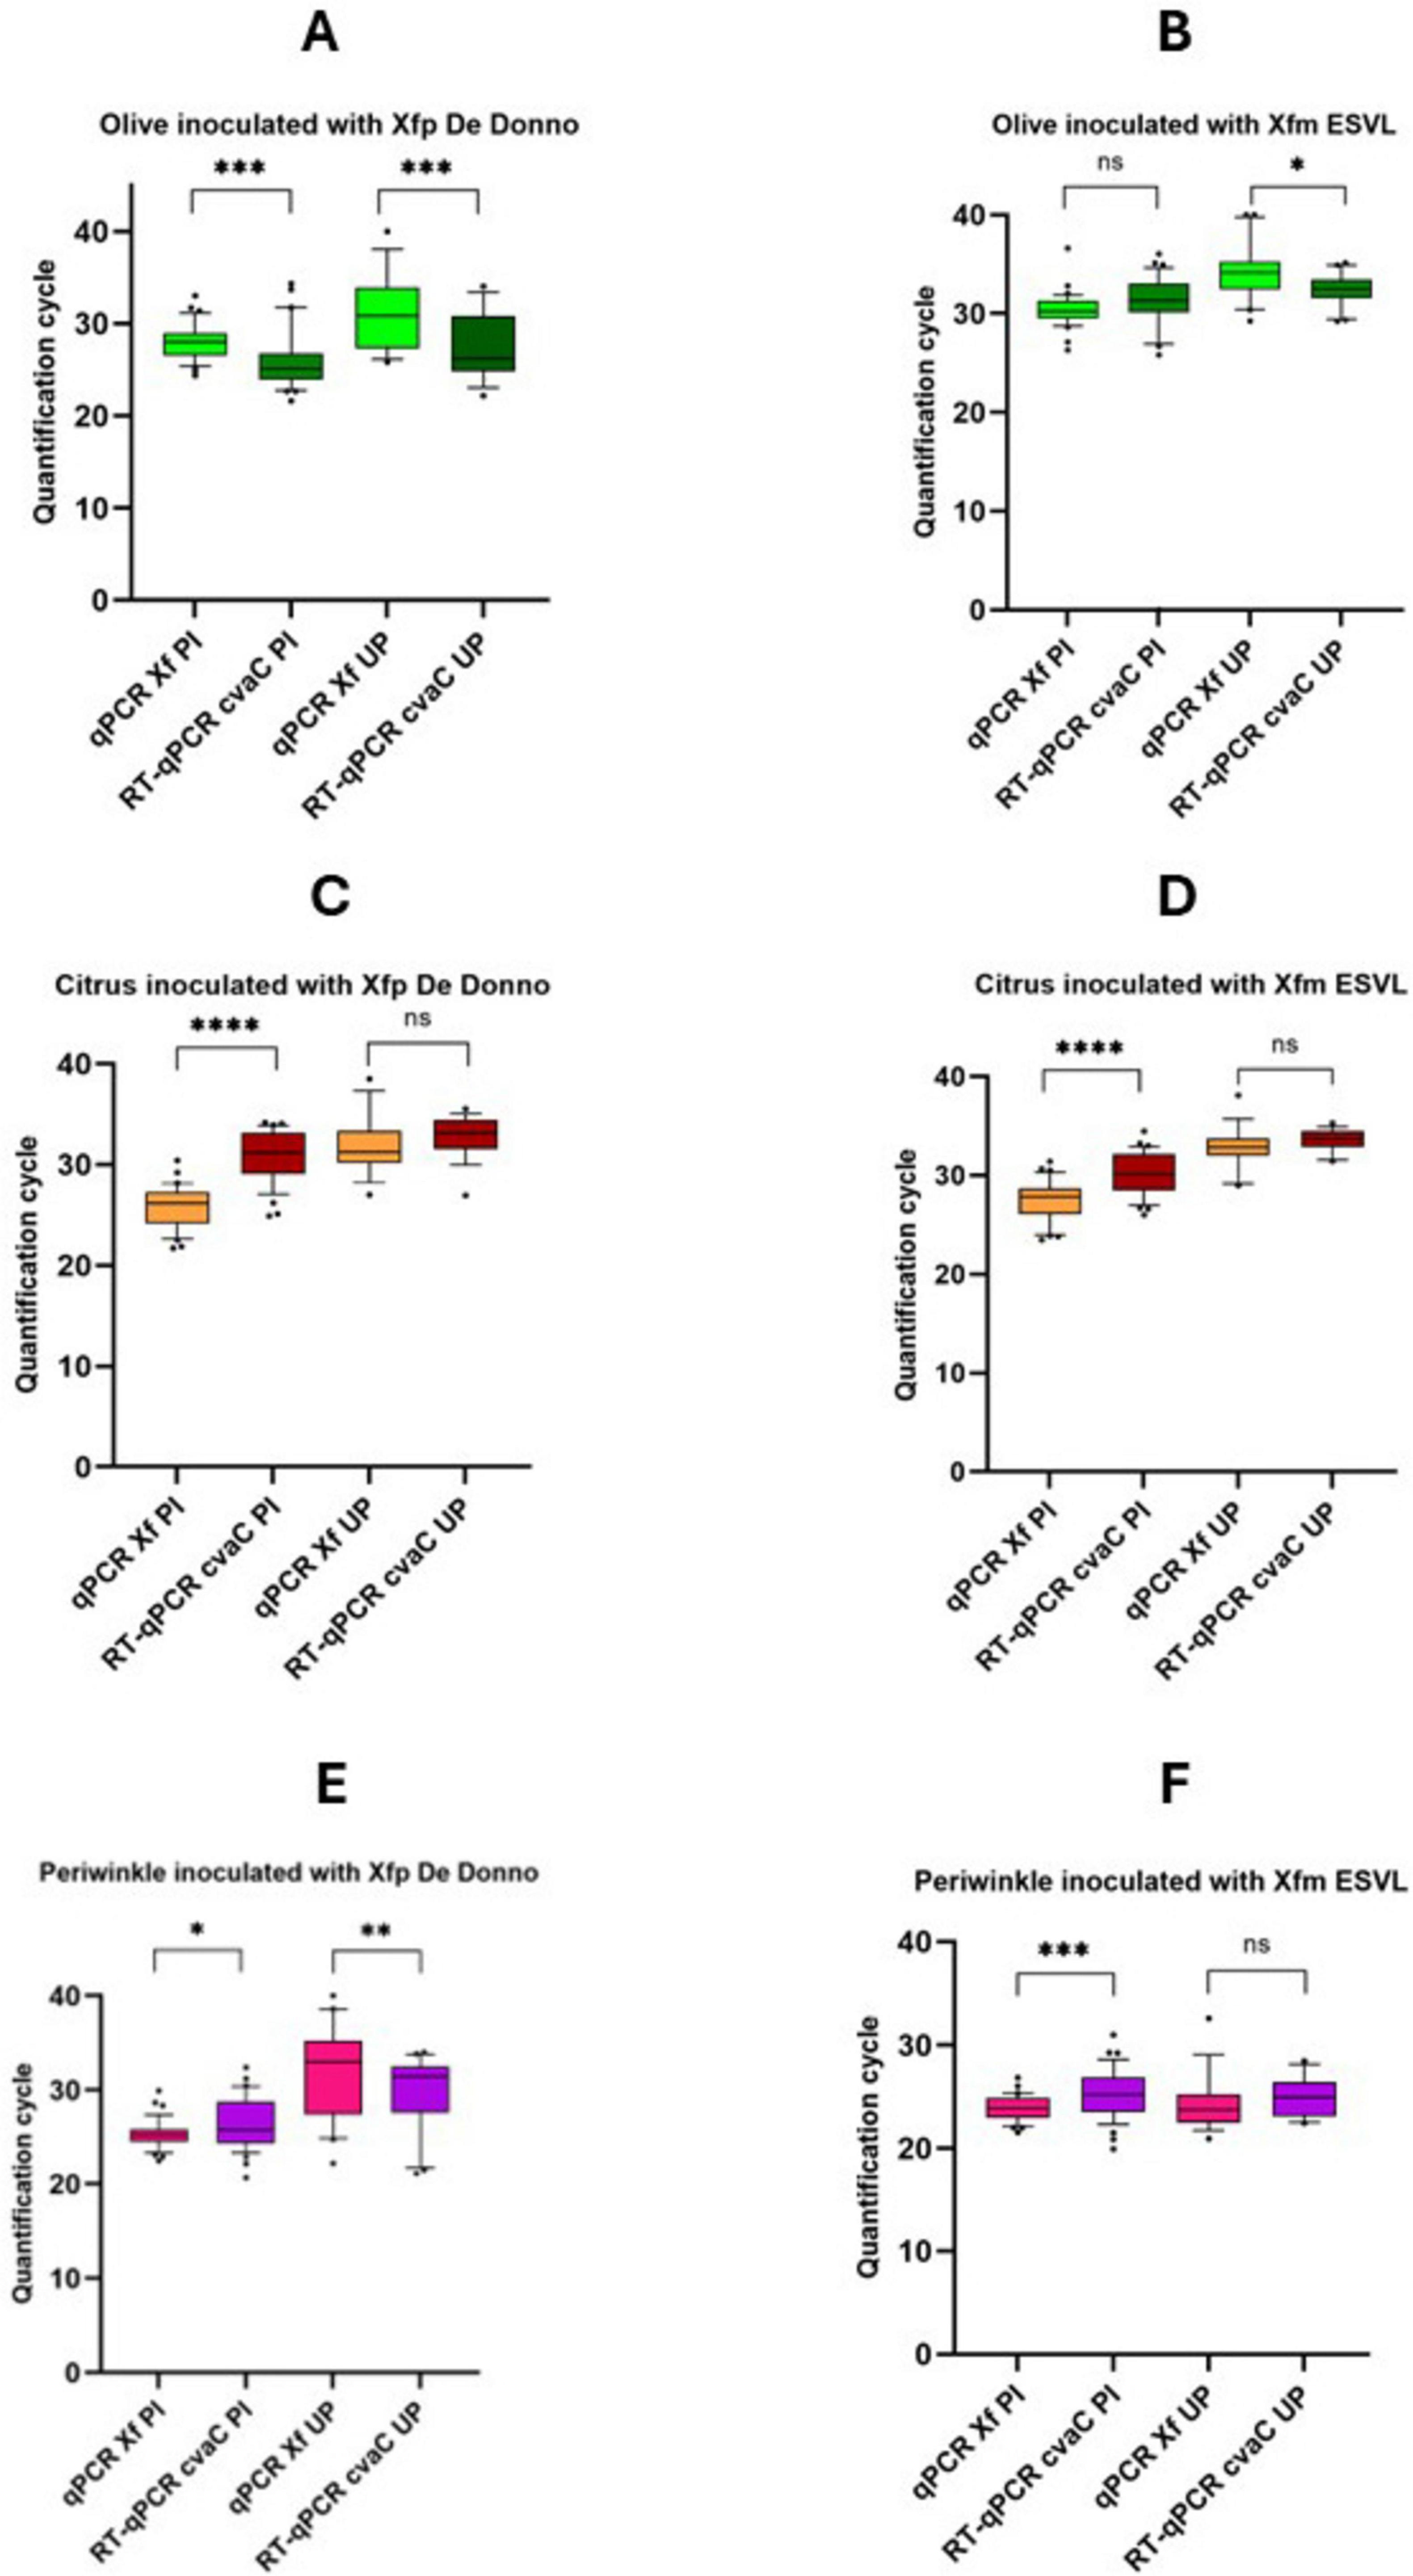
Figure 6. Whisker plots of qPCR and RT-qPCR results. Data are recovered from olive (A,B), citrus (C,D), and periwinkle (E,F) plants artificially inoculated with Xfp DD and Xfm ESVL bacterial suspension (OD600 = 1). Molecular analyses were performed using purified nucleic acid extracts recovered both from stem tissue comprised by two consecutive inoculation points (PI) and twig/stem portions 10 cm far from the last inoculation point (UP). Quantification cycles are indicated on the y-axis. The statistical significance level is also reported above each thesis (****p < 0.0001; ***p < 0.001; **p < 0.01; *p < 0.05; ns, not significant).
3.6 Validation of the cvaC-based detection assays to differentiate growing and non-growing bacterial cellsRegardless of the vitality of the plant tissues (desiccated or vegetating twigs), positive qPCR reactions, targeting the bacterial DNA, were generated for all 42 infected olive plants. More than 50% of the non-tetracycline-treated plants (19 out of 36) had developed shoot dieback and desiccation (Supplementary Figure 3, Supplementary Table 2). As expected, in the samples collected from these plants, Cq values were higher, but still indicating a relevant bacterial DNA accumulation for the withered/desiccated tissues than for the green asymptomatic cuttings (25.18 ± 1.38 vs 20.70 ± 0.91). Values above the Cq negativity threshold were observed in the six Xf-free control plants.
In contrast, the Cq values generated by the cvaC-1 RT-qPCR were significantly different, with an average of 16.65 ± 1.14 for the symptomless plants (i.e., viable and green twigs) and an average Cq of 29.80 ± 1.43 for the desiccated twigs (Supplementary Tables 2, 3). Remarkable results were recorded on the six tetracycline-treated plants which showed broader variation compared to the untreated ones for conventional qPCR and RT-qPCR, respectively (Supplementary Table 3), suggesting that the treatment impacted cell vitality in some plants. Indeed, this issue is also supported by the associated coefficients of variation, which were 13.04% for standard qPCR and 25.35% for RT-qPCR. Only one of these plants showed shoot dieback, and consistently with the results on the non-treated plants, high Cq values (qPCR: 30.56; RT-qPCR: 31.87) were obtained in both assays on the sampled tissues. The remaining five treated and asymptomatic plants could be differentiated into two groups. The first included three plants in which the results were in line with those recorded in vegetating non-treated plants (qPCR: 22.52 ± 0.95; RT-qPCR: 19.05 ± 0.72), thus supporting high bacterial populations and intact cvaC-1 transcript, as demonstrated by the low Cq values in both assays and the positive RT-PCR results with a clear band in agarose electrophoresis gel. The second group encompassed the remaining two asymptomatic antibiotic-treated plants, whose diagnostic results were more similar to those recorded for the desiccated tissues harboring non-growing bacterial cells (qPCR: 25.94 ± 0.31; RT-qPCR: 29.05 ± 2.73), including the lack of amplification in RT-PCR, indicating that the bacterial growth was affected by the antibiotic treatment and its effect could be measured with the tests herein developed.
These results confirm that cvaC-1 transcript accumulates in host tissues with active bacterial multiplication, while desiccated tissues, in which the bacterial multiplication is compromised, generate high Cq values, most likely related to low levels of residual and degraded RNAs. By comparing the qPCR and RT-qPCR results, it appears that when the bacterium is actively colonizing the plant tissues, the Cq values of the RT-qPCR are consistently lower than those obtained using the conventional qPCR targeting the bacterial DNA (rimM gene). Whereas under conditions not favorable for bacterial multiplication and survival, such as in withered and desiccated tissues, RT-qPCR generated Cq values higher than those recorded in qPCR.
Clear-cut results were obtained through RT-PCR. A single DNA band of the expected size was observed in all vegetating shoots tested (Supplementary Table 2), while samples consisting of desiccated and dead tissues did not show any band in the electrophoresed agarose gel. More precisely, no DNA bands were detected in samples that generated Cq values higher than 25 in RT-qPCR assays. Such discrepancy can be attributed most likely to the occurrence of degraded and fragmentary RNA in these tissues, whose small fragments were still detected by RT-qPCR, while the amplification of the whole transcript was impaired, rather than to the lower analytical sensitivity of the RT-PCR compared to the RT-qPCR (Supplementary Figure 4). Further statistical evaluation of the relationships between conventional qPCR and cvaC-1
留言 (0)