
記住我
Diagnostic errors pose significant risks to public health, contributing to adverse patient outcomes and systemic inefficiencies (1). Despite growing recognition of their impact (2, 3), and new studies documenting the aggregate scope of diagnostic errors in the United States (4), there remains a notable paucity of studies quantifying how the risk of diagnostic errors varies among different population subgroups (5). To date, the research demonstrating the heightened vulnerability for some populations is largely based on data from particular practice sites, practice settings, or health conditions (6–8). Because methods are inconsistent across these studies, the evidence on diagnostic inequities remains fragmented and inadequate in several ways.
First and foremost, most extant studies identifying diagnostic inequities do so using clinical markers, rather than patients’ own assessments. Because key aspects of diagnosis—including the effectiveness of clinicians’ communication and their responsiveness to patient-reported symptoms, concerns, and experiences—can only be reliably assessed through patients’ reports, many potential manifestations of diagnostic inequity remain underexamined (5, 9, 10). Moreover, when patients perceive that some personal attribute has deleteriously affected their diagnosis, the potential damage to their relationships with clinicians and/or the wider health care system can lead to persisting loss of trust in medical care, increased concern about misdiagnosis in the future, and weakening of the therapeutic alliance between patients and clinicians essential for accurate and timely diagnosis (11–13).
Second, the handful of published studies that do include patient-reported diagnostic errors and problems (14–17) have relied on relatively small samples. This makes it difficult to sort out which attributes of combined sociodemographic constructs, such as lower socio-economic status (e.g., limited education and limited income reported together in one variable) represent the real predictors of the identified inequities. Because past studies have identified a number of intercorrelated sociodemographic characteristics such as age, gender and sex, race and ethnicity, disability, and economic status—each of which has been individually associated with elevated diagnostic risks—the intersections and interactions of attributes have not, to date, been effectively parsed out (7, 8, 14, 18).
Finally, because the evidence-base currently documenting diagnostic inequities is aggregated from a set of narrowly focused studies, it has been impossible to reliably compare the magnitude of diagnostic shortfalls or harms across different subgroups. This undermines efforts to prioritize among interventions that might reduce diagnostic inequities, because they cannot be sensibly targeted to the groups experiencing the greatest current burdens.
To address these gaps in our understanding of diagnostic disparities and inequities, we developed a novel survey specifically designed for learning more about patients’ and household care partners’ assessments of diagnostic experiences. Our survey, developed and fielded in a national panel, provides the first ever household-reported data set for comprehensive analysis of “diagnostic problems and/or mistakes” (abbreviated as “diagnostic P&Ms”) in the United States to reflect the lived experience of patients and their household care partners. These “diagnostic P&Ms” refer to any problem and/or mistake identified by patients themselves or the people living with them (hereafter referred to as household care partners). They include diagnostic P&M events that “can be caused by not getting enough information from the patient, not ordering the right tests in a timely way, not reading test results correctly, or doctors not sharing information well enough with one another.” (See Exhibit 1.) The broader focus on P&Ms is intended to better align survey responses with elucidating safety threats and informing actions in the quest for diagnostic excellence inclusive of diagnostic equity. Although some diagnostic P&Ms may not equate to clinically adjudicated diagnostic errors, they represent lived experiences with problems and mistakes in the public’s experience of diagnosis that can undergo epidemiologic analysis. With a large sample –almost 4,000 households screened to identify 1,500+ events reported as P&Ms related to diagnosis—we can better distinguish among correlated attributes associated with elevated risks or harm.
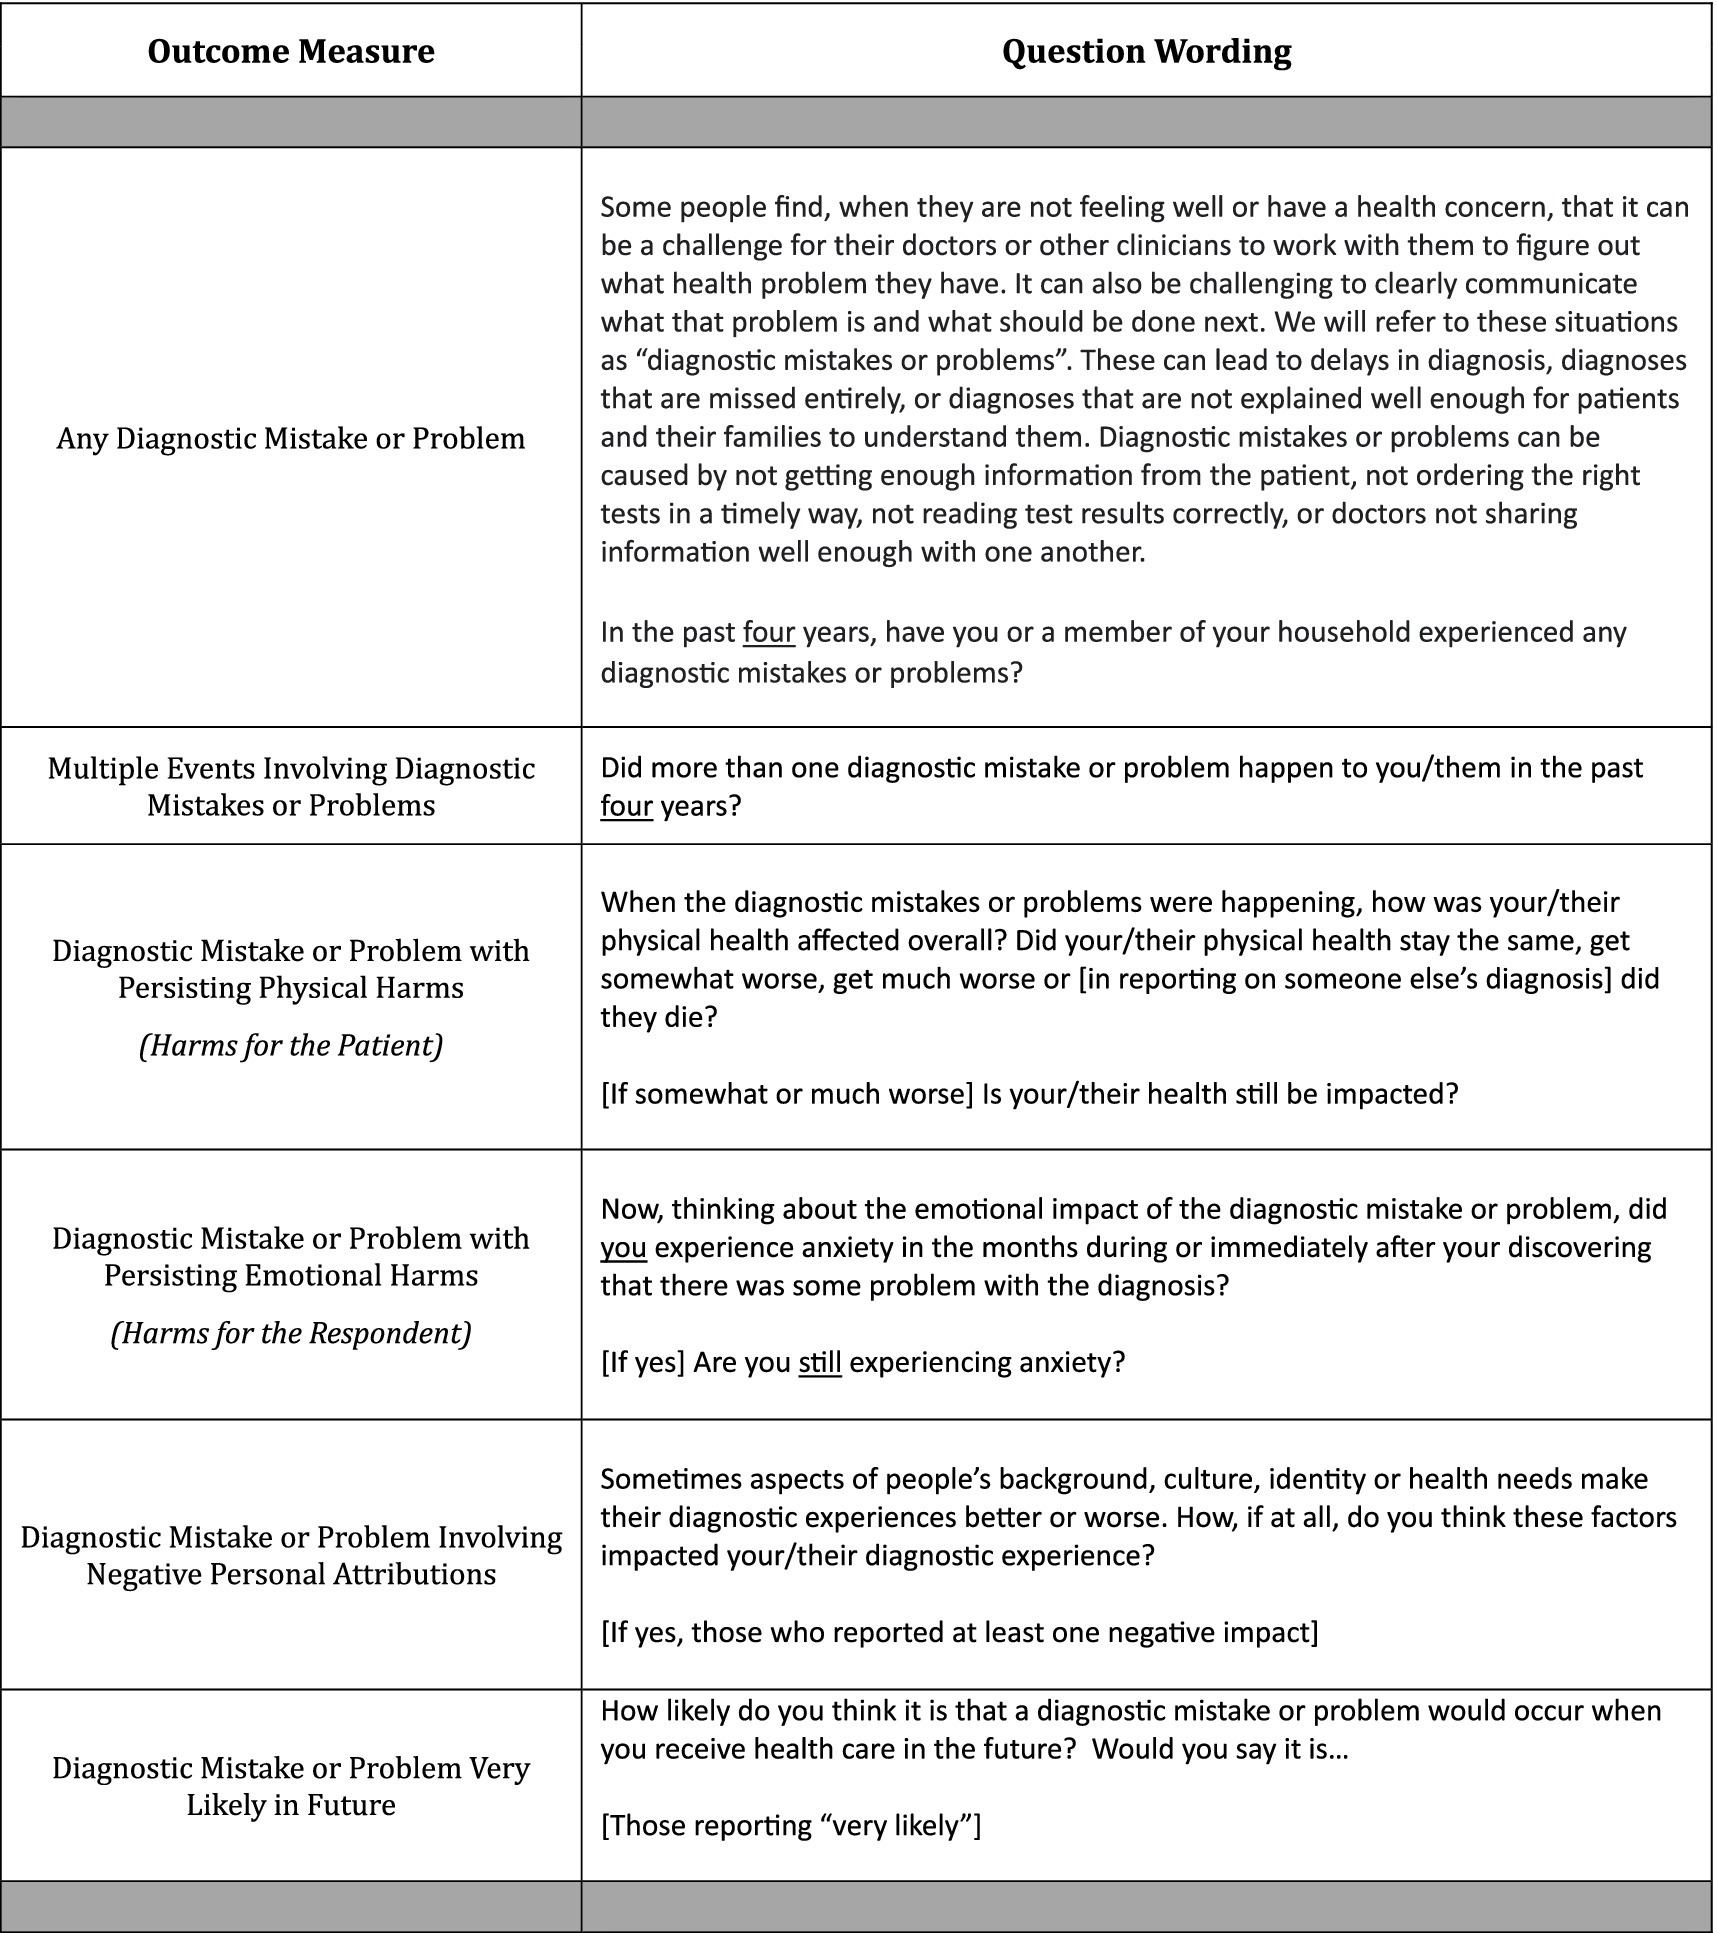
Exhibit 1. Survey question wording for outcome variables.
The analysis presented here assesses the sociodemographic correlates of diagnostic P&Ms at both the household and patient level. In this paper, we present the methodology used to conduct our survey, describe the characteristics of the study population, and analyze the sociodemographic predictors of diagnostic P&Ms along with their subsequent effects on patients. We report on the prevalence of diagnostic P&Ms and persisting harms by sociodemographic factors such as household income, gender identity, age, marital status, education, race and ethnicity, disability work status and urban/rural residence. We also estimate how these same personal attributes are related to respondents’ expectations regarding future diagnostic risks.
Understanding the distribution of diagnostic disparities is crucial to inform development of targeted interventions to reduce diagnostic P&Ms and persisting harms, to surface deficiencies in diagnostic excellence (19), and ultimately to improve healthcare outcomes most equitably (5, 20, 21). Furthermore, we discuss the implications of our findings for healthcare practice, health delivery systems, policy, and directions for future research. Through our analysis, we aim to contribute valuable insights to the complex epidemiology of patient-reported diagnostic P&Ms and advance efforts towards promoting data-informed and patient-centric diagnostic equity.
2 MethodsThe survey that generated the data for the analysis presented below was developed to provide a more robust and patient-centric representation of the diagnostic experiences of the American public. Its conceptual foundation closely accords with the one recently published by Bell and colleagues (10), though our approach (a) operationalizes an alternative way of labeling the sorts of experiences that “count” as diagnostic P&Ms, (b) embodies a commitment to rigorously eliciting narrative accounts about those diagnostic experiences, and (c) incorporates attention to patient experiences, outcomes, and expectations in the aftermath of the diagnostic P&M. We describe below the survey development process and the specific wording of key questions.
2.1 Source of the dataSurvey data were collected from a randomly selected subset of people participating in NORC’s AmeriSpeak® online panel of over 50,000 households, designed to elicit participation from historically underrepresented populations to ensure that respondents are representative of the American public (22, 23). The panel methods used, similar to other online panels, are transparently documented and frequently assessed for reliability and representativeness (24–27). Online surveying options include two response modes: Computer-Assisted Web Interviewing (CAWI) and Computer-Assisted Telephone Interviewing (CATI). NORC collects and regularly updates information on all panelists, which makes it possible to assess the sociodemographic characteristics of respondents who screened out of the full survey because no one in their household had experienced a diagnostic P&M.
Participants in the AmeriSpeak® panel receive participation points for responding to surveys. Those participating in a survey of the length of the NEP-DE study receive compensation worth approximately $5.00.
2.2 Survey developmentThe survey used in this study was developed using a three-stage iterative process that began in April 2022 and ran through May 2023. The initial version of the survey built upon prior work on other patient safety concerns (e.g., treatment and medication errors), literature reviews, and team members’ extensive experience in survey methods and diagnostic care assessment (17, 28–31). We incorporated a rigorous narrative elicitation protocol (NEP) methodology to construct the question sequence including 10 open-ended questions that encourage a robust, balanced, and complete account from respondents (32–34, 75). It centered an inclusive understanding of patients’ and care partners’ lived experiences with the diagnostic process and outcomes, not linked to any particular care setting. The survey went through multiple phases of pilot testing, triangulation with qualitative interview data on a subset of respondents, and revisions to establish a robust and feasible set of survey questions. The novel survey is referred to as NEP-DE (see Supplementary Material). This process was supported by input from an advisory group of patient advocates with lived experience with diagnostic P&Ms, clinicians with expertise in diagnosis and in identifying diagnostic P&Ms, and researchers with expertise in the elicitation and assessment of patient narratives.
2.3 Survey questions assessing outcomesAlthough some previous patient experience surveys have aspired to identify events that the public views as “diagnostic errors” (35), researchers attentive to patient experience have increasingly recognized that the public views adverse diagnostic events in broader terms (36–38). Indeed, the public does not always relate to the concept of a medical error, even when it is defined for them on a survey (10). To provide a more inclusive scope, our survey asked about experiences with “mistakes and/or problems” during diagnosis (see Exhibit 1). In separate analyses of the survey, we have noted that those diagnostic P&Ms identified by patients or care partners as “problems” have, on average, as frequent and substantial harms as those that they view as “mistakes.” In other work, we have also documented that acknowledgement of something going wrong from someone in a healthcare setting occurred in about one out of three P&M reports (39).
To assess the frequency with which diagnostic P&Ms are encountered, we screened respondents aged 18+ from NORC’s AmeriSpeak® online panel regarding the diagnostic experiences of people in their households during the previous 4 years. Extended lookback periods are common for surveys of patient experiences involving safety events. Past surveys included lookback periods of 1, 4, 7 and 10 years (16, 35, 38, 40). Our use of a four-year lookback on this survey corresponds to about the midpoint of this range.
In response to the wording in the screening invitation, respondents initially identified whether anyone in their household had experienced a diagnostic P&M in the previous 4 years. Those who responded affirmatively were then asked if there had been more than one such diagnostic P&M during that time period. About half (51%) of those who reported at least one event indicated that there had been multiple events in their household. These were then prioritized by algorithm—diagnostic P&Ms that involved the respondent’s own health care were given priority, and respondents were directed to describe the most memorable P&M for themselves. Diagnostic P&Ms in which the respondent had been a household care partner were included only if the respondent had no personal experience about themselves to report. For household care partner reported events, respondents were again guided to select the most memorable P&M to further elaborate what had happened on a single P&M.
Respondents were asked multiple questions about the selected diagnostic safety event. As shown in Exhibit 1, these included whether the event had induced physical harms for the patient that still persisted at the time of the survey, emotional harms for the respondent that still persisted at the time of the survey, and whether the diagnostic experience had been negatively affected by the system or clinicians in relationship to one or more of the patient’s personal attributes. This final outcome was quantified on the basis of coding responses to the last open-ended question from the sequence of 10 questions incorporated into the NEP (see Supplementary Material). Finally, patients were asked about their expectations regarding future diagnostic risks; responding on a four-point scale that ranged from “very likely” to “not at all likely” (Exhibit 1).
For illustrative purposes, we assembled excerpts from the open-ended questions (see Supplementary Material) and the responses that related to selected outcomes: diagnostic P&Ms, persisting physical and emotional harms (an indicator of severe impact), and respondent perception that personal attributes impaired diagnosis. Three steps were required to provide examples of each outcome from the two perspectives: patient reports and care partner reports. First, we selected a subset of responses to represent all outcomes of interest. Second, we selected excerpts to reflect a range of writing styles and narrative lengths. Third, we crafted each excerpt using verbatim text with only minor revisions for readability (e.g., capitalizations where appropriate, but no changes to phrasing or words used), and assembling narrative segments for conciseness and continuity without necessarily reflecting the exact order or full text available in the original open-ended response.
2.4 Survey questions assessing sociodemographic predictorsThe sociodemographic characteristics used to identify patterns of disparities in diagnostic experiences rely on information collected from all AmeriSpeak® panelists, as well as additional information collected during the survey process (Exhibit 2). Past studies relying on smaller scale or setting-specific samples suggest that certain subgroups of respondents are likely to be at heightened risk for diagnostic P&Ms, including patients from ethnic or racial minority groups (8), those with physical disabilities (18), patients from sexual and gender minority groups (41), women (7), younger and older adults (7), and those from disadvantaged socioeconomic households (14). We also include two additional sociodemographic variables that are plausibly related to so-called “upstream” determinants of diagnostic inequities (5, 42): rural residents (who face larger travel burdens in seeking out diagnoses, particularly when these involve specialists) and respondents with more limited educational attainment. Finally, we include marital status as this social factor has been shown to be protective for health outcomes in other contexts (43).
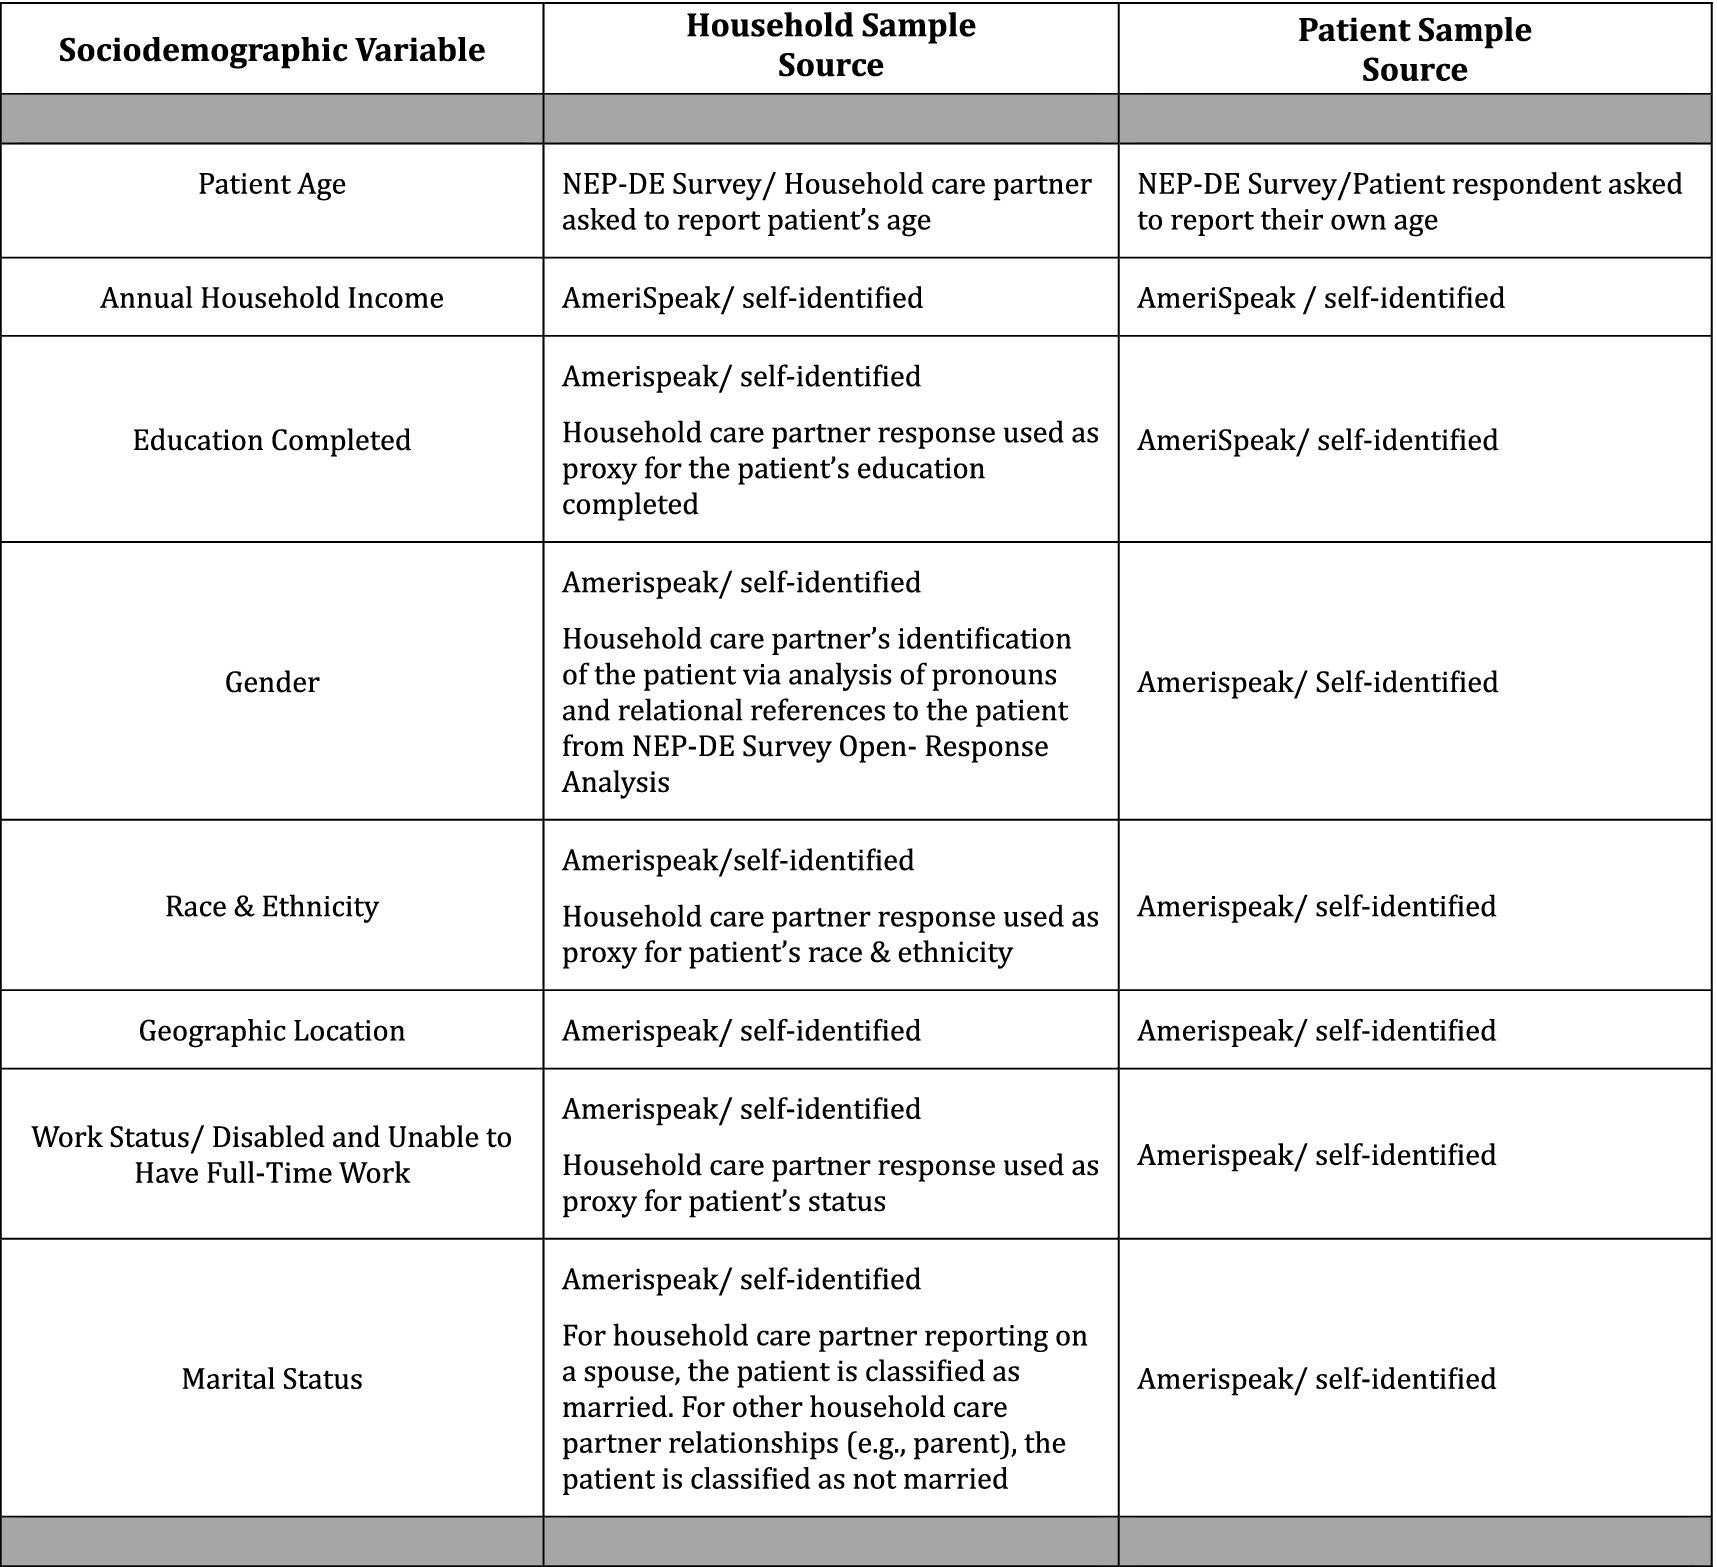
EXHIBIT 2. Sources for sociodemographic variables.
The terminology for sociodemographic categories (Exhibit 2) were chosen to align with NORC’s questions and response options (22). In addition, terminology for several subgroups was adapted based on additional sources (44, 45). For example, while we refer to a gender category, we use terminology for three population subcategories to be inclusive of populations who have non-binary gender identities: cis-male, cis-female, and transgender and gender independent (44). This choice aligns with the panelist responses to four choices for the question “how do you describe yourself?”—male, female, transgender or do not identify as male, female or transgender. The multiple races category refers to two or more races, and we use the term multiracial when referring to individuals in this population (45).
2.5 Sample selectionThe AmeriSpeak® national panel was utilized to recruit participants for the survey. Panelists were offered the opportunity to complete a “survey about healthcare experiences”; 26.5% of those offered agreed to participate. Out of this participant pool, 43.6% reported having had a household member (oneself or someone else in the household) with some form of diagnostic mistake or problem during the previous 4 years. Of those who screened into the survey based on having a health care experience and then agreeing to participate, 95.4% completed the entire set of questions about adverse experiences with diagnosis.
Because the survey incorporated an extensive set of open-ended questions, which described the nature of the reported diagnostic event, we were able to further screen the reported P&M to ensure that the problems were in fact associated with diagnosis rather than treatment. Based on analysis of the narrative responses, we excluded 5.6% of the cases reported from the AmeriSpeak® respondents; these can be viewed as “false positives.”
The analytic sample was further restricted by two additional considerations. First, because income is reported at the household (shared residence) level, we excluded all P&Ms reported among family members who no longer shared the residence—this excluded a total of 270 reported P&Ms. Second, because the AmeriSpeak® panel includes only respondents 18 and older, we also excluded all cases reported by household care partners that involved patients under the age of 18—this excluded an additional 45 reported P&Ms from this analysis.
2.6 Data collectionWe fielded the survey in three waves, the first in April of 2022, the last in May of 2023. After each of the first two waves of data collection, we further refined the question wording and sequencing. The median time to complete the survey was 23 min. Debriefing questions situated at the end of the survey suggested few difficulties in understanding or completing any of the questions.
Changes to the survey included: (a) after the first wave of the survey, altering the way in which respondents identified when they first began to search for a diagnosis in the sentinel case, so that the response included the month as well as the year of initiation, (b) altering the sequencing and/or wording of three of the prompts for the open-ended questions between the second and third waves, and (c) introducing a new question in the second wave which asked respondents to identify whether, at the time they completed the survey, the uncertainties associated with their diagnosis had been fully resolved.
The narrative elicitation sequence on this survey included 10 open-ended questions, six related to the diagnostic process, four to experiences after the respondent had determined that there had been a mistake or problem related to the diagnosis (see Supplementary Material). The mean response time for the open-ended question sequence was 8.5 min, the median 7 min.
2.7 Statistical analysisWe estimated two different sets of regressions. The first set estimated the prevalence of any patient-reported diagnostic P&Ms or persistent harms. Slightly more than half (54.5%) of the cases of diagnostic P&Ms involved respondent-reported care for themselves. The second set of models estimated the prevalence of P&Ms and persistent harms from the full sample for any member of the respondent’s household, including reports from both patients and household care partners in the sample.
Multivariate regression models were estimated to identify the relationship between sociodemographic factors and diagnostic outcomes. For binary outcome variables (any P&M, multiple P&Ms, any persisting physical harms, any persisting emotional harms, any evidence that diagnosis was impaired by inappropriate attention to one or more of patient’s personal attributes) the regressions were estimated as logistic models. When the perceived future risk of a diagnostic problem was the outcome, the models were estimated as ordered logistic regression.
2.8 Ethical considerationsThe study was deemed exempt by the IRBs at Yale (#2000032012) and Johns Hopkins (IRB00322791) universities. The study fell under the umbrella exemption granted by the University of Wisconsin IRB to qualitative projects conducted by the Qualitative and Health Experiences Research Laboratory in the Department of Family Medicine.
2.9 Data availabilityData from this study will be made available upon request from the corresponding author, after June 1, 2025.
3 Results 3.1 Respondent characteristicsA total of 3,995 AmeriSpeak® panelists responded to the screening questions. As shown in Table 1, the sociodemographic characteristics of these respondents mirrored those of the general U.S. adult population as of 2020 with some modest divergences.
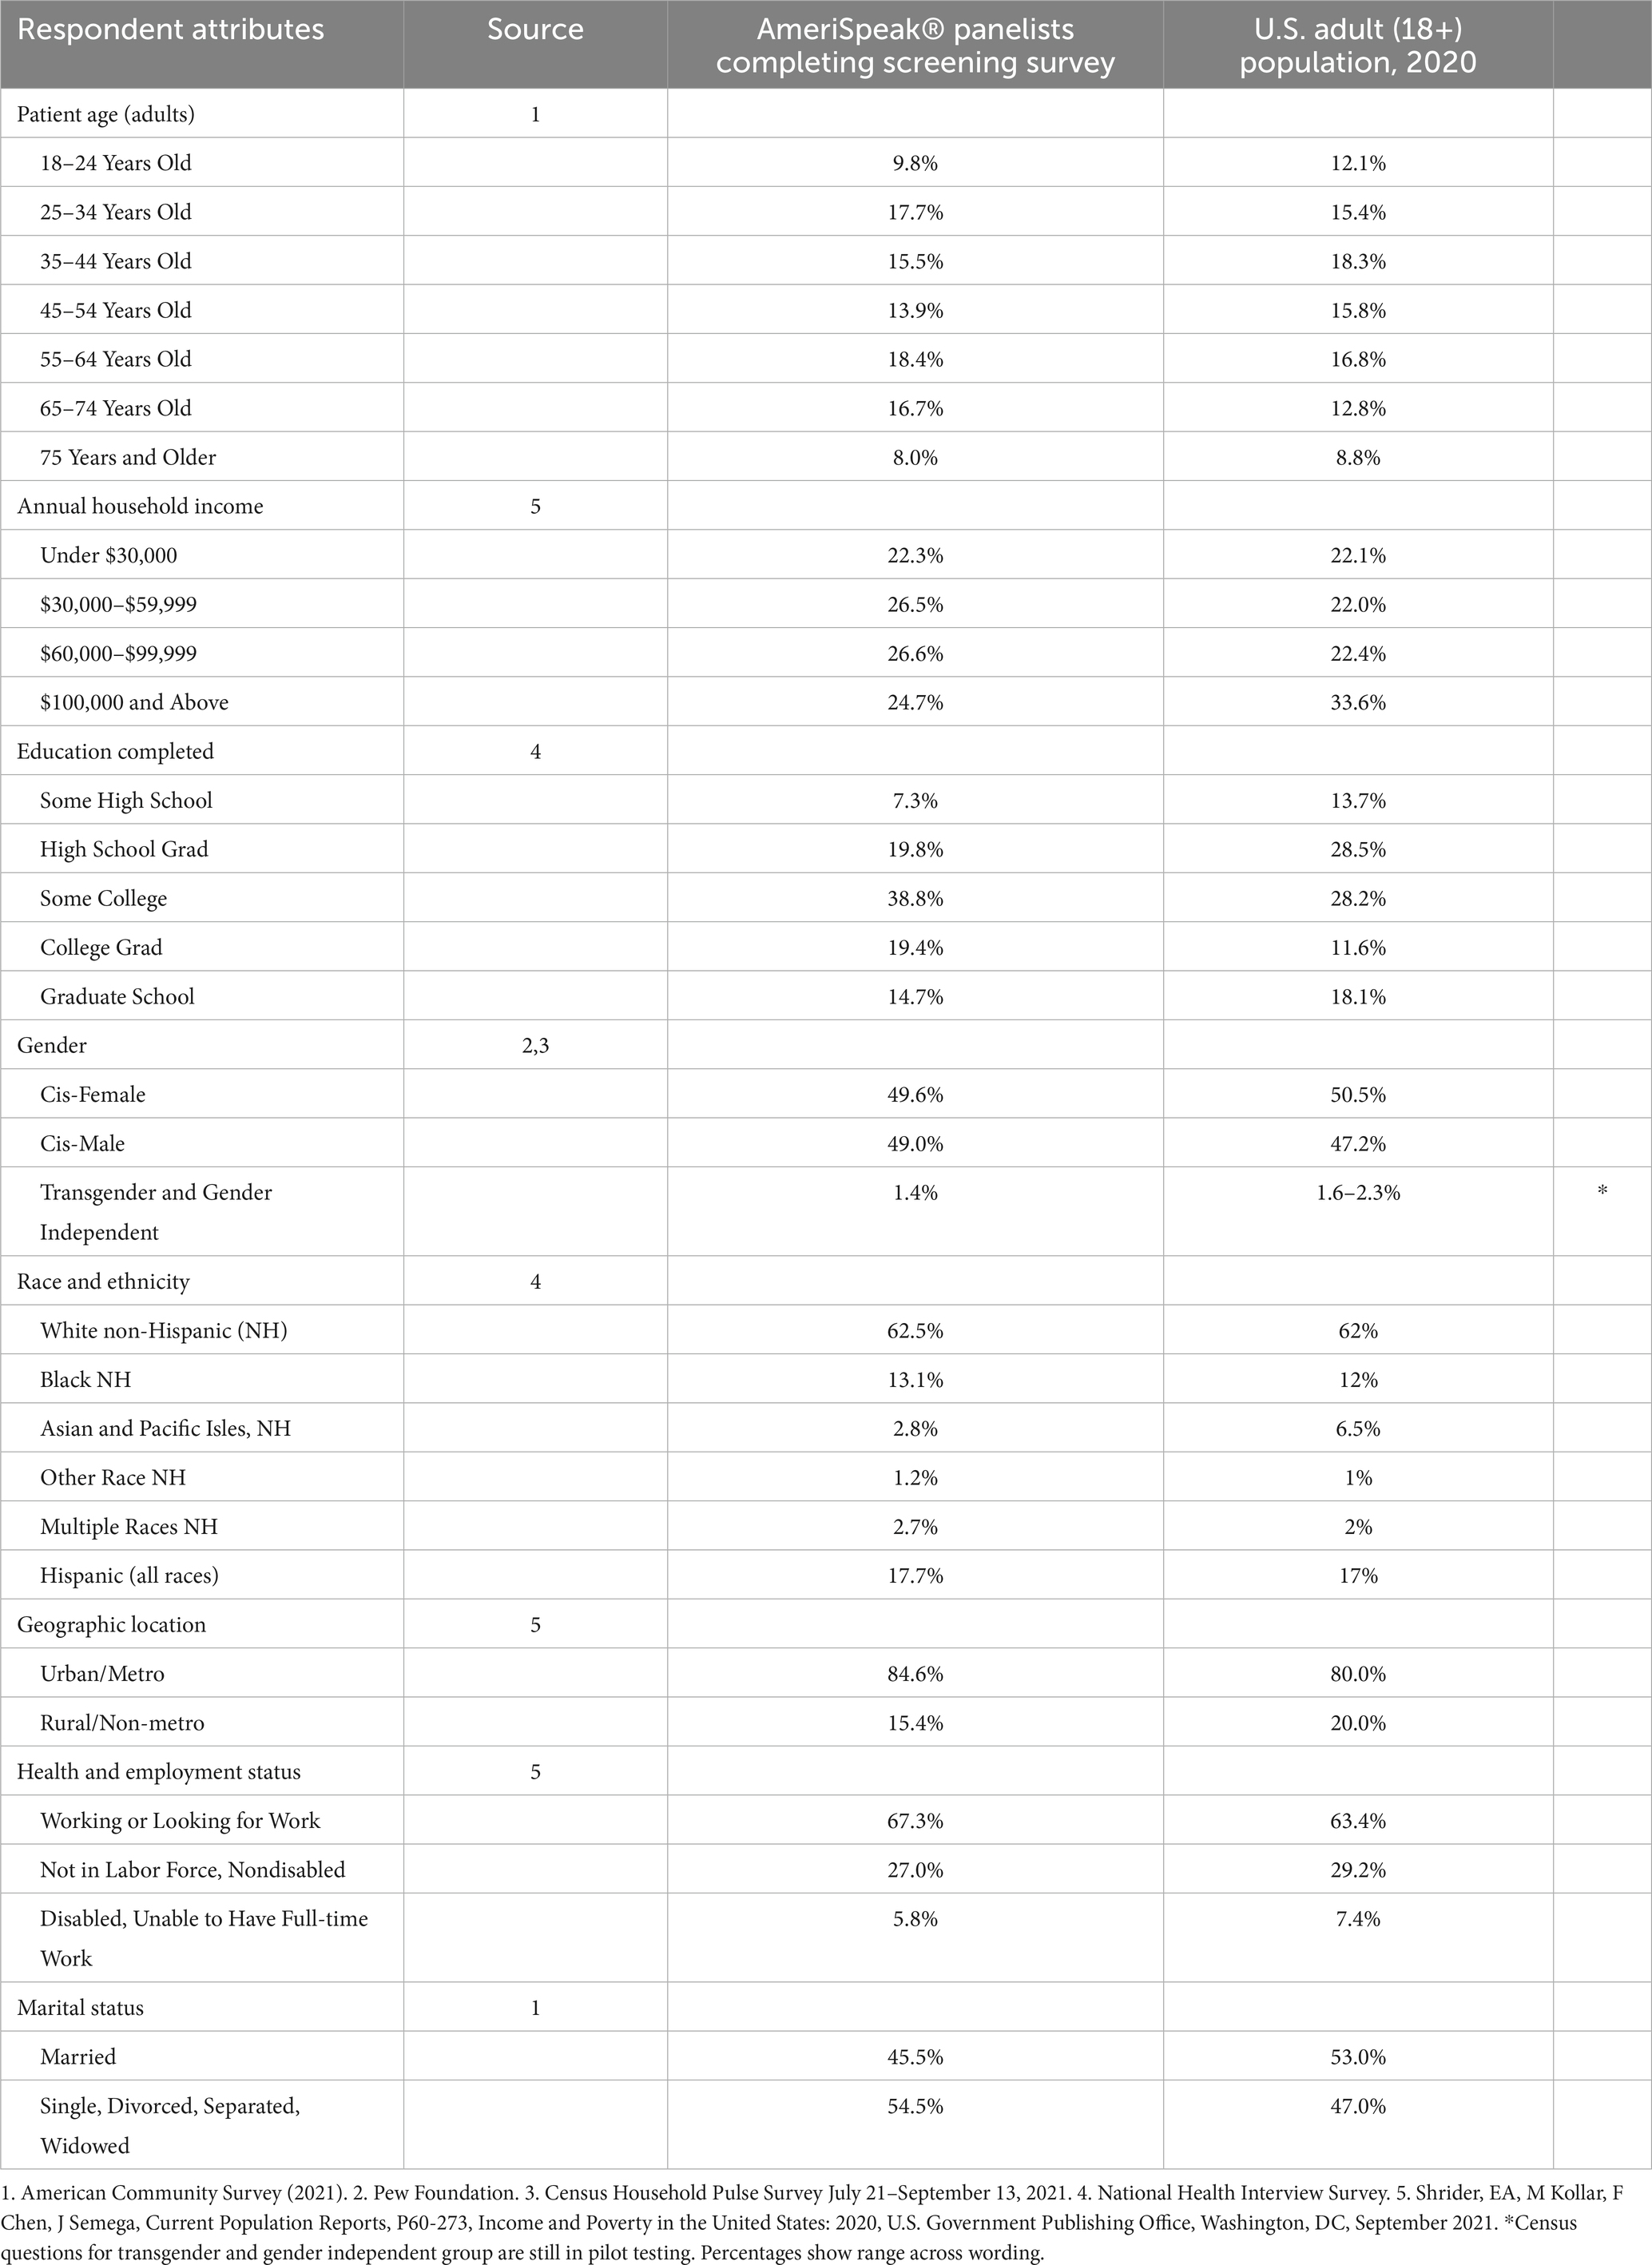
Table 1. Respondent characteristics compared to general U.S. population [unweighted sample].
The respondents were slightly older with the most marked difference in the 65 and older groups (24.7% versus 21.6% in the general population). Although there were fewer of the youngest adults (18 through 24 years old) (9.8% versus 12.1%), the proportions of those under the age of 35 years old was the same for respondents versus the general population, 27.5% in each case.
Annual household income distribution was notably similar to the general population for the lowest income group of under $30,000 (22.3% versus 22.1%). There were fewer respondents reporting incomes above $100,000 compared to the general population (24.7% vs. 33.6%), and more respondents in the two middle income brackets (roughly 26% vs. 22% for each).
The educational attainment of respondents tended to be higher than the general population with more completing some college or graduating from college (58.2% vs. 39.8% combining these two categories), but fewer completing graduate school (14.7% versus 18.1%). Fewer respondents were at the low end of the educational attainment distribution (some high school or high school graduate with 27.1% versus 42.2% combined categories for respondents compared to the general population).
The distribution of gender among respondents closely aligns with that of the general population, with roughly equal proportions of cis-females and cis-males. The transgender and gender independent group is also similar to the low end of the Census estimates (1.4% versus 1.6%).
While the distribution of race and ethnicity among respondents mostly reflects that of the general population, the proportion of Asian and Pacific Islander individuals is substantially lower compared to the general population (2.8% versus 6.5%). The proportions of several other race and ethnicity groups are slightly higher among respondents compared to the general population (e.g., 17.7% versus 17% for Hispanics [all races], 13.1% versus 12% for Black, and 2.7% versus 2% for those reporting multiple races).
Although the majority of respondents reside in urban or metro areas, consistent with the distribution in the general population, there were fewer respondents from rural or non-metro locations (15.4% versus 20% in the general population). The distribution of health and employment status among respondents is largely comparable to that of the general population, with a somewhat lower proportion of individuals reporting disabled status (unable to have full-time work) among respondents compared to the general population (5.8% vs. 7.4%). The respondent sample had a smaller proportion of those currently married than did the general population, though in each case the sample was fairly evenly divided between those who were married and those not.
Overall, the comparison between respondent characteristics and the general U.S. adult population suggests that the sample captured a diverse and representative population, enhancing the generalizability of the study findings.
3.2 Illustrative examples of study outcomesTable 2 presents narrative examples excerpted from patient and care partner reports to illustrate study outcome variables. Examples of diagnostic P&Ms include delays in diagnosis, problems with diagnostic testing, nonspecific diagnosis, and unresolved diagnosis. Examples of persisting physical harms reflecting severe impact of the diagnostic P&M include chronic pain, damage to extremities and nerves, and continuing functional limitations. Examples of persisting emotional harms indicative of severe impact of the diagnostic P&M include significant frustration, anger, feelings of invisibility, and stigmatization for patients reporting about themselves. Similarly, care partners experiences of persistent emotional harms include expressions such as “it broke my heart” and “it has affected the family and myself in ways words cannot express.” Examples of a personal attribute or combination of personal attributes that impaired diagnosis and suggest diagnostic inequity include gender, too young an age for the diagnosis ultimately determined, being a person with a disability, weight (“because you are fat”), and being Latina.
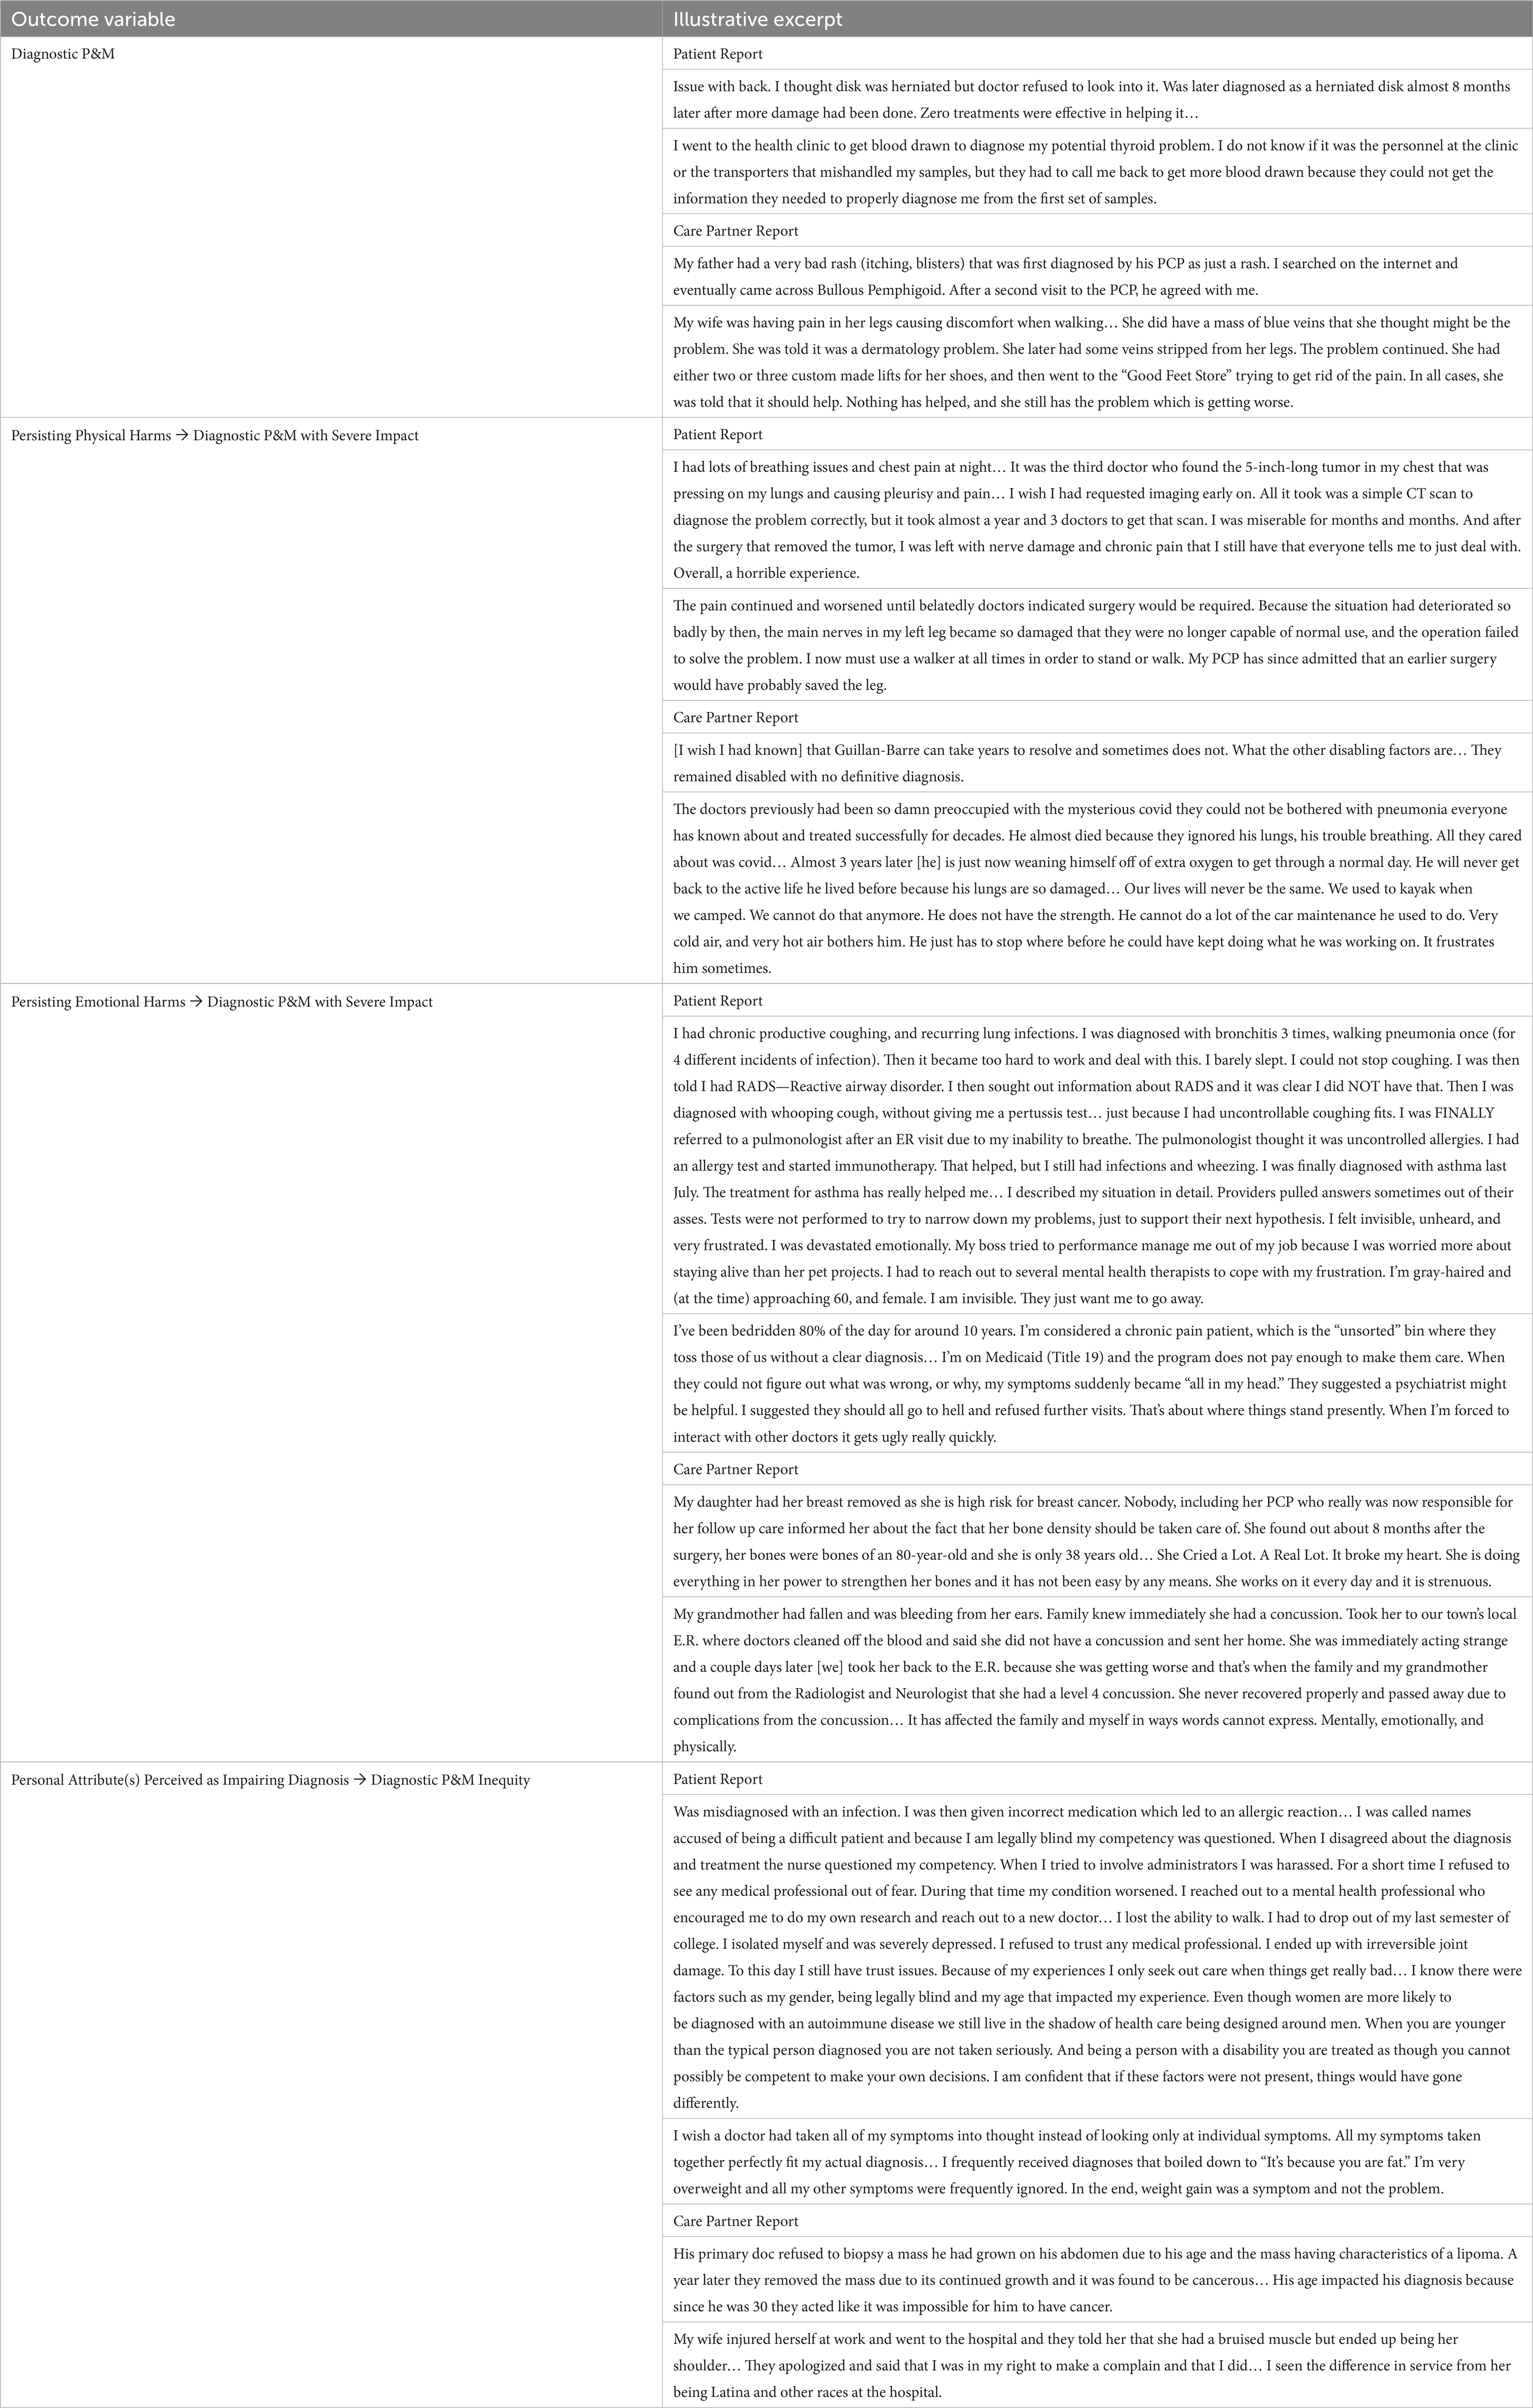
Table 2. Illustrative excerpts of outcome variables.
3.3 Prevalence of diagnostic P&Ms and their effectsAmong the 3,995 survey respondents in the household sample, Figure 1 shows that 37.7% reported experiencing at least one diagnostic P&M as a care partner or as a patient in the past 4 years, while 19.2% reported experiencing multiple P&Ms during the same period. Among respondents reporting on their own diagnostic P&Ms (only patients), 20.9% reported experiencing at least one diagnostic P&M in the past 4 years, while 10.3% reported experiencing multiple P&Ms during the same period. The population rate of perceiving personal attributes as impairing diagnosis was 6.6% of household respondents and 4.4% of patients themselves. Figure 1 also shows the prevalence of concerns about having a future diagnostic P&M being very likely in each sample.
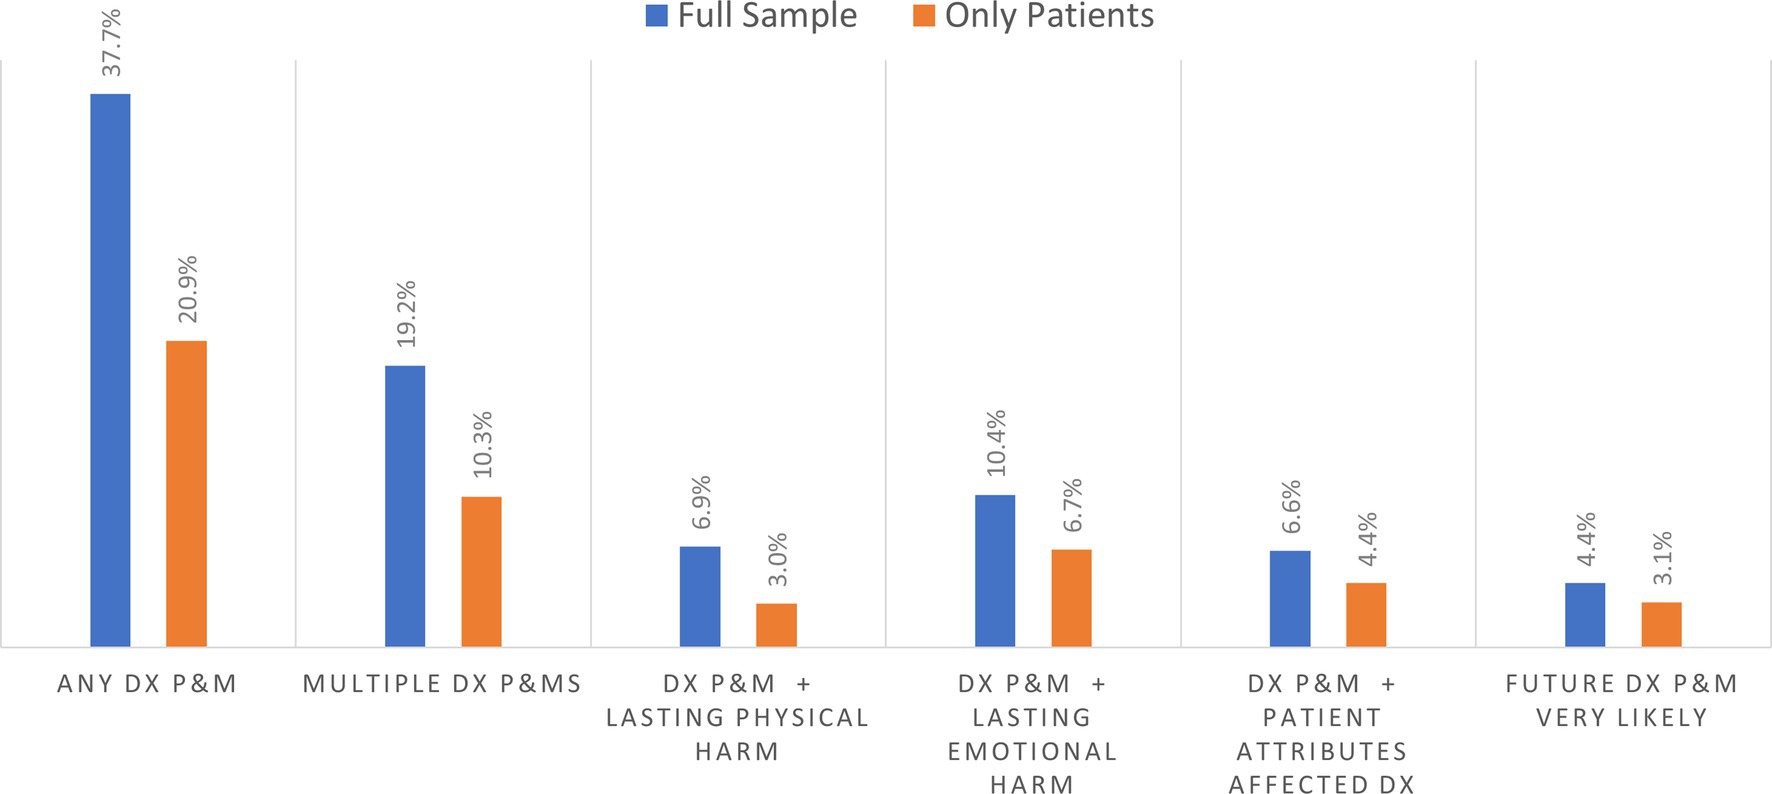
Figure 1. Prevalence of diagnostic problems and mistakes (DX and P&MS) in past 4 years and related outcomes.
3.4 Outcomes among respondents who experienced at least one P&MAmong the 1,506 patient and household care partner respondents reporting on diagnostic P&Ms within their household, Figure 2 shows that about 50% of respondents had experienced multiple P&Ms in the past 4 years. Based on responses for the selected P&M explored in detail in the survey, the longer-term effects resulting from that diagnostic P&M included persisting emotional harm (anxiety) and lasting physical harm. Among household respondents, about 29.2% reported persistent emotional harm, while 20.1% reported persistent physical harm of the person who experienced a P&M (Figure 2). Based on the subsample of patients reporting on themselves, 35.3% reported persisting anxiety, and 17.2% experienced persistent adverse physical effects. Almost 15% of those who experience a P&M thought it was very likely that they would experience another diagnostic P&M in the future.
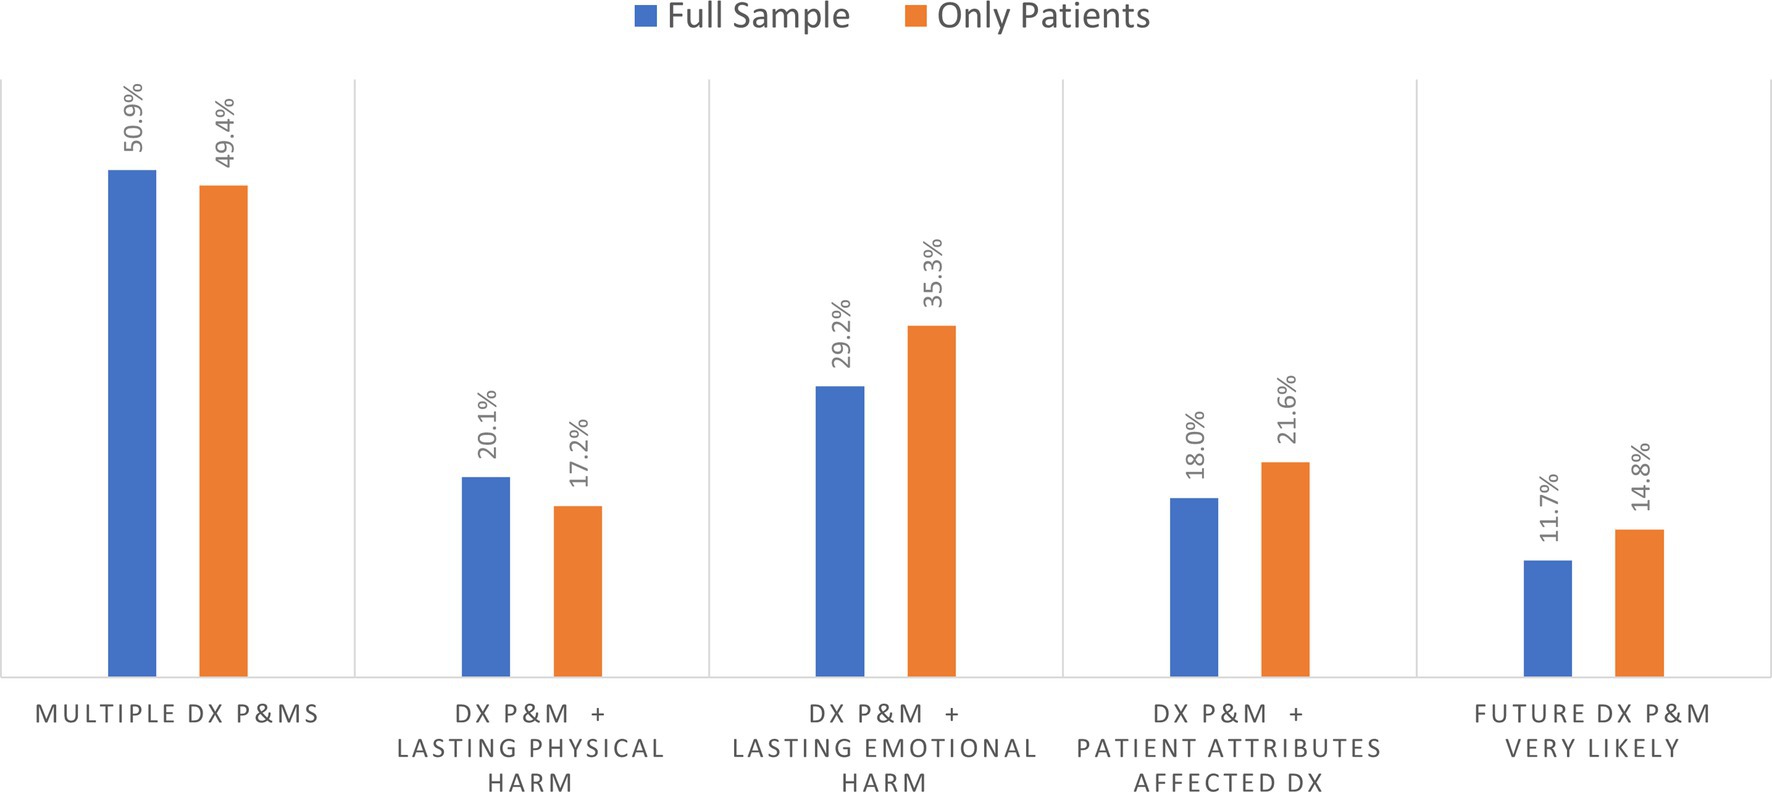
Figure 2. Percentage of outcome for those experiencing at least one diagnostic problem and mistake (DX and P&MS).
Almost 22% of patients and 18.0% of the household respondents who reported a diagnostic P&M indicated that a personal attribute had played a role in their problematic diagnostic experience. The personal attributes associated with these pernicious effects sometimes corresponded to sociodemographic categories commonly used in social surveys and identified as sources of disparities in prior studies, but the diagnostic narratives also reported on more finely grained racial, ethnic and cultural identities or other characteristics (e.g., prior diagnosis of mental illness or substance use disorder, large body size). These self-reported attributes and their relationships to diagnostic experiences and outcomes will be examined separately in a forthcoming publication based on the open-ended narrative data.
3.5 Sociodemographic predictors of diagnostic P&MsTable 3 shows that regression results for both the household level (i.e., respondents reporting either about their own diagnosis or that of another person in their household) and patient subsample (i.e., patients reporting about their own diagnosis) analyses are similar in terms of significant sociodemographic predictors of P&Ms, though some results differ. We report results for each analytic frame separately since strategies for addressing diagnostic inequities may be targeted to individuals or households or both.
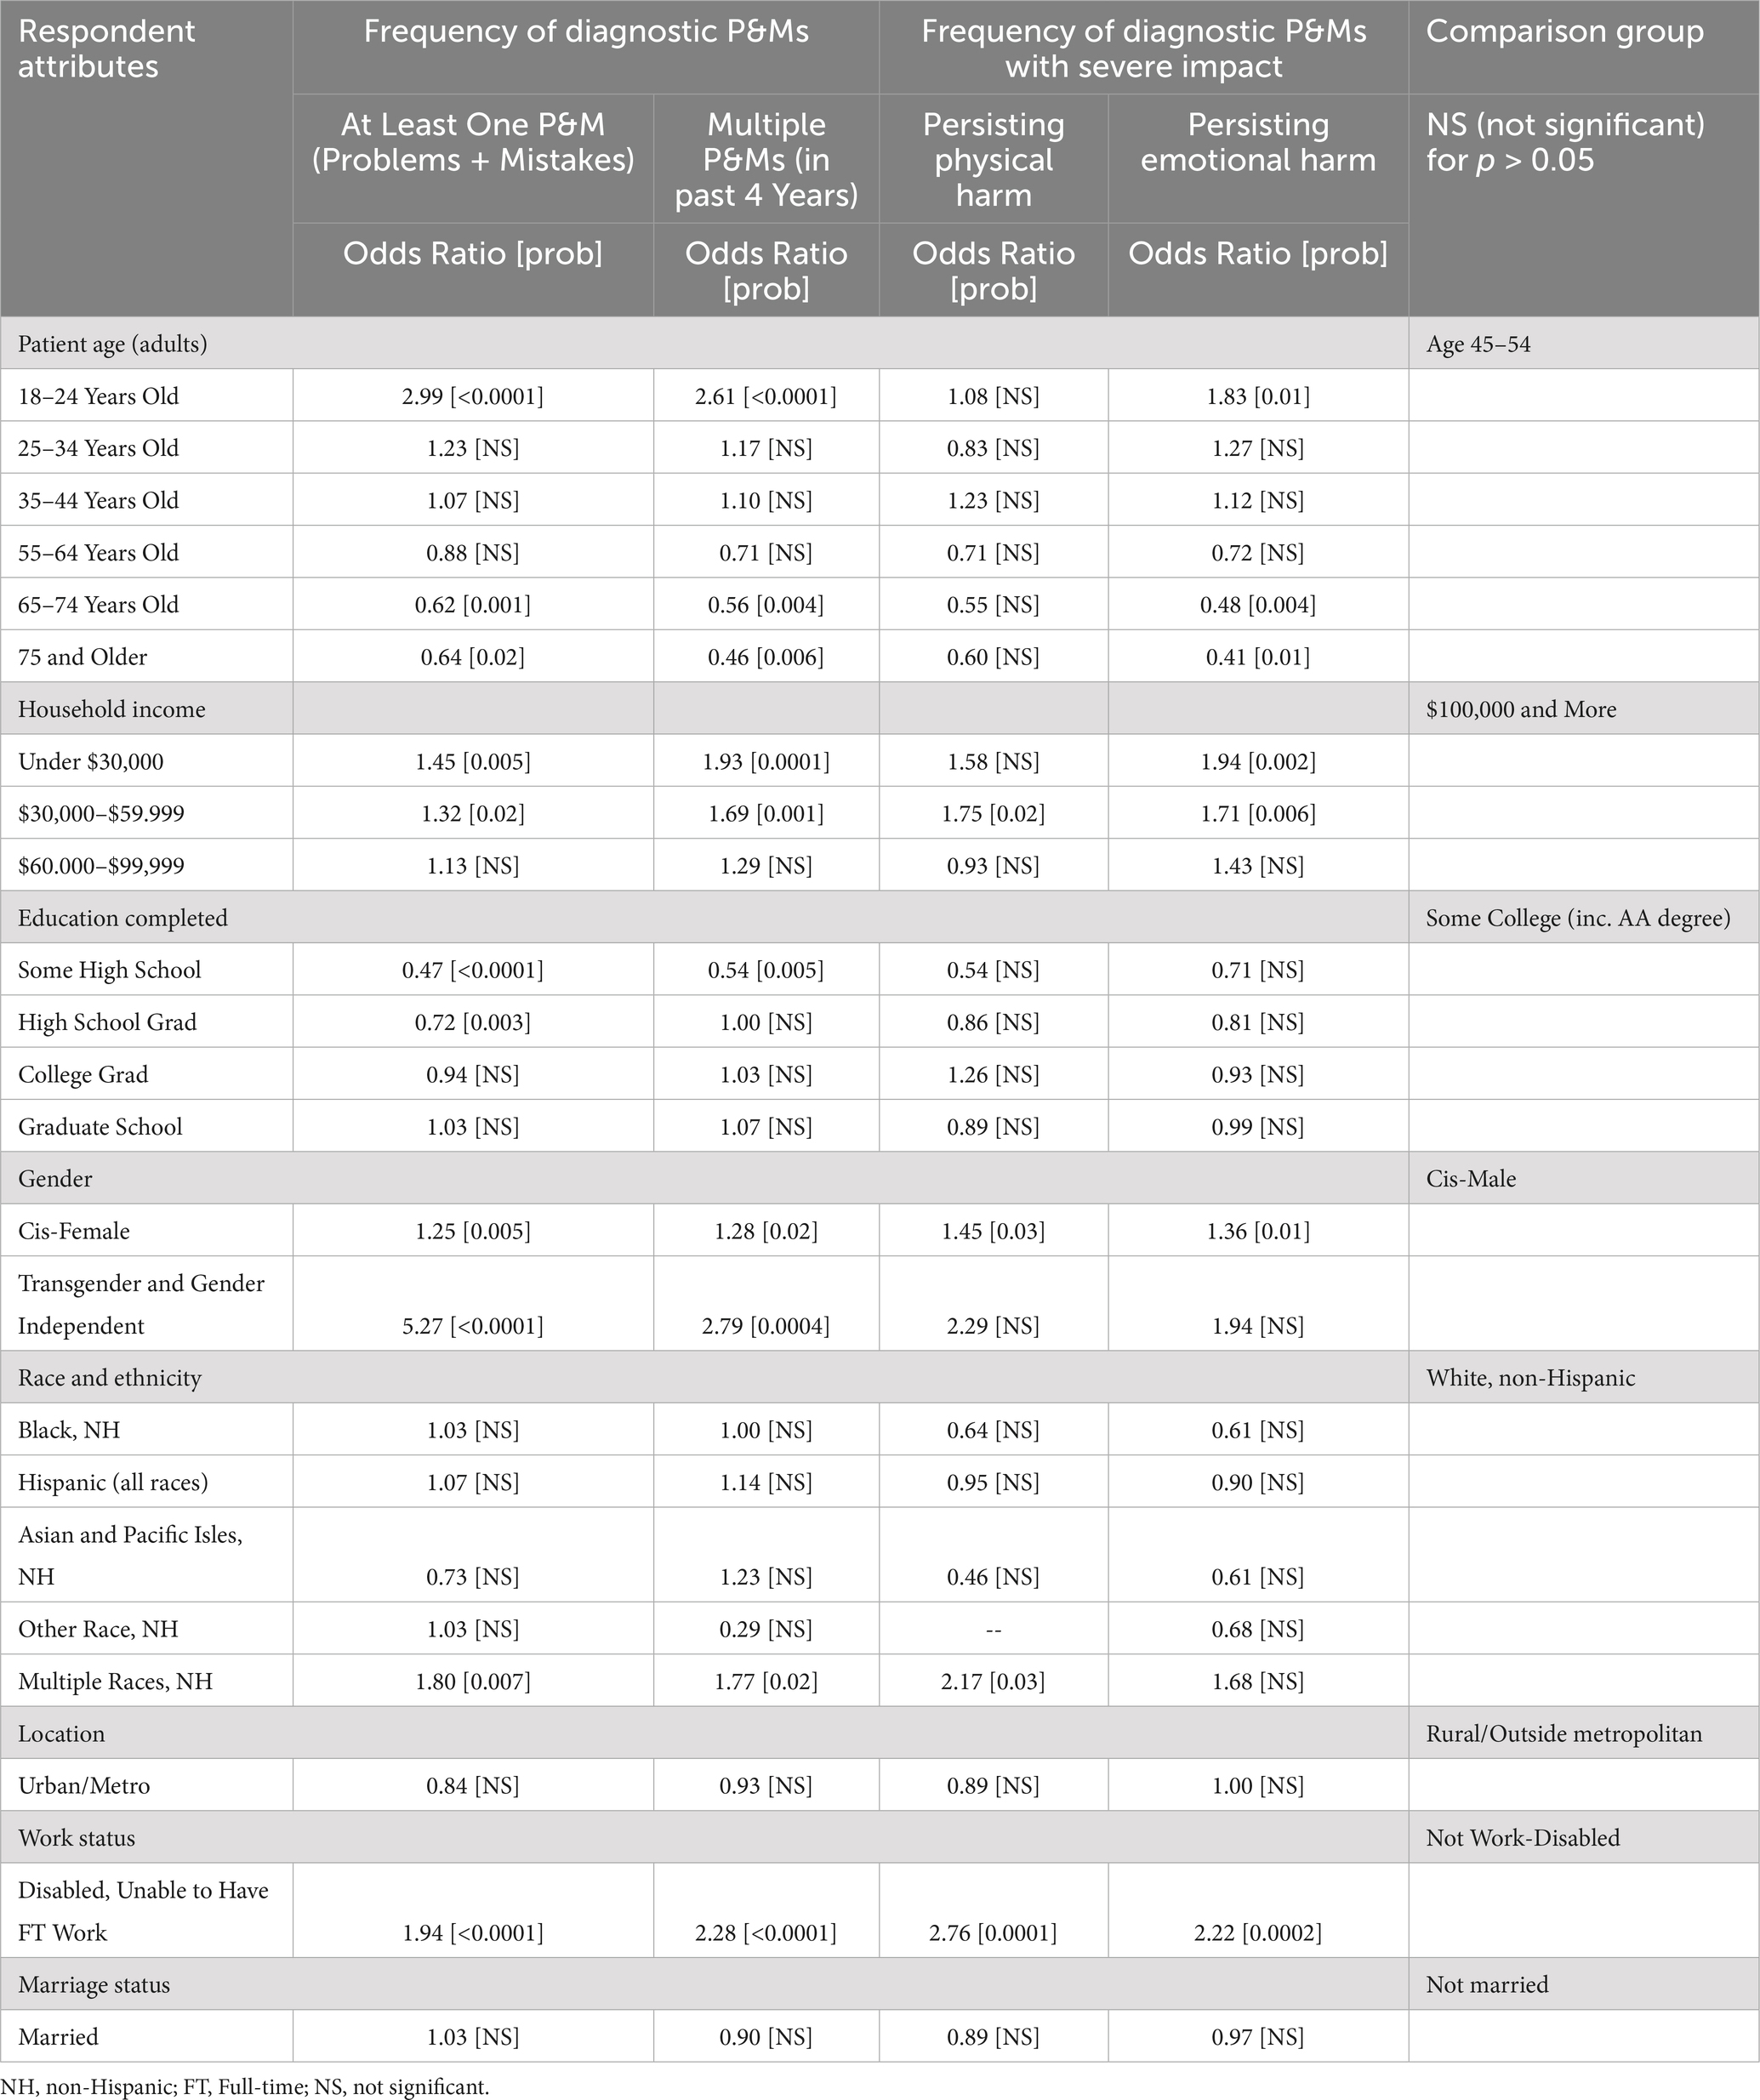
Table 3. Disparities in prevalence of diagnostic P&Ms within respondent’s household.
3.5.1 Household level analysis (full sample of all reported P&Ms)At the household level, younger patients (18–24 years old) exhibited significantly higher odds of experiencing at least one diagnostic P&M (odds ratio 2.99, p < 0.0001) and multiple P&Ms (odds ratio 2.61, p < 0.0001) compared to those aged 45–54 years old. Conversely, older patients reported significantly lower odds of experiencing at least one P&M (odds ratio 0.62, p = 0.001 for those 65–74 years old and 0.64, p = 0.012 for 75 and older) and multiple P&Ms (odds ratio 0.56, p = 0.004 for the 65–74 group; and 0.46, p = 0.006 for those 75 and older) compared to the reference group (age 45 to 54).
Respondents from households with below average income (under $30,000 and $30,000–$59,999) exhibited significantly higher odds of experiencing at least one diagnostic P&M and multiple P&Ms compared to those from households with incomes of $100,000 and above. The odds ratios followed a consistently inverse gradient with higher and more significant odds for P&Ms (at least one and multiple) as income levels decreased.
Respondents with less education completed, specifically those with only some high school education or high school graduation, exhibited significantly lower odds of experiencing at least one diagnostic P&M compared to those in the reference group of those who had completed some college (odds ratio 0.47, p < 0.0001 for some high school; odds ratio 0.72, p < 0.003 for high school graduation). Only the lowest educational attainment groups (some high school) reached statistical significance in predictions of multiple P&Ms, and similarly had lower odds compared to the reference group (odds ratio 0.54, p = 0.005).
Other significant sociodemographic predictors of increased risk of diagnostic P&Ms are related to gender, race and ethnicity, and disability. Cis-female respondents were significantly more likely to report experiencing any P&M (odds ratio 1.25, p = 0.005) and multiple P&Ms (odds ratio 1.28, p = 0.02) compared to cis-males. Transgender and gender independent individuals exhibited the highest risks: compared to cis-males (odds ratio 5.27, p < 0.0001 for at least one P&M and odds ratio 2.79, p = 0.0004 for multiple P&Ms). Disparity predictions for most racial and ethnic groups did not reach statistical significance. However, individuals identifying as multiracial exhibited significantly higher odds of P&Ms compared to non-Hispanic White individuals (odds ratio 1.80, p = 0.007 for at least one P&M; and odds ratio 1.77, p = 0.02 for multiple P&Ms). Individuals who identified their work status as disabled (unable to have full-time work) had significantly higher odds of experiencing diagnostic P&Ms compared to those in the reference group (odds ratio 1.94, p < 0.0001 for at least one P&M; and odds ratio 2.28, p < 0.0001 for multiple P&Ms).
Overall, the findings highlight the presence of disparities in the prevalence of diagnostic P&Ms within households, with significant associations observed for patient age, household income, education, gender, race and ethnicity, and disability status.
3.5.2 Patient-level analysis (subsample reporting about their own diagnosis)Table 3 also shows the regression analysis for patients reporting about themselves. As with the household analysis, there were no significant differences in the prevalence of diagnostic P&Ms between respondents residing in urban/metro areas compared to those in rural/non-metro areas. Nor were disparities predicted based on marital status (married versus not married).
Both patient age and household income predictions remained similar to the household analysis as expected, given that these sociodemographic characteristics are consistently identified in both samples (Exhibit 2). Patient age was a significant predictor of diagnostic P&Ms, both at least one and multiple P&Ms in the past 4 years. Younger patients (under 25) exhibited significantly higher odds of experiencing at least one diagnostic P&M (odds ratio 3.98, p < 0.0001) and multiple P&Ms (odds ratio 3.48, p < 0.0001) compared to those aged 45–54. Both these point estimates were higher than in the household analysis. Conversely, older patients (65 and older) had significantly lower odds of experiencing both at least one P&M (odds ratio 0.60, p = 0.006 for those 65 to 74; odds ratio 0.58, p = 0.03 for those 75 and older) and multiple P&Ms (odds ratio 0.48, p = 0.005 for those 65 to 74; odds ratio 0.43, p = 0.02 for 75 and older), compared to the reference group.
Respondents with below average incomes again reported more diagnostic P&Ms. Those living in households with the lowest incomes (under $30,000) exhibited significantly higher odds of experiencing P&Ms compared to those from households with incomes of $100,000 and above (odds ratio 1.59, p = 0.003 for at least one P&M; odds ratio 2.39, p < 0.0001 for multiple P&Ms). For those with household incomes in the next lowest bracket of $30,000–$59,999, respondents reporting about themselves also had significantly greater risk of at least one P&M (odds ratio 1.35, p = 0.03) and multiple P&Ms (odds ratio 1.81, p = 0.002).
Respondents with lower levels of education, specifically those with only some high school education or high school graduation, exhibited significantly lower odds of experiencing at least one diagnostic P&M compared to the reference group of those who had some college (odds ratio 0.30, p < 0.0001 for some high school; odds ratio 0.56, p < 0.0001 for high school graduation). Those with some high school also had significantly lower odds of multiple P&Ms (0.37, p = 0.003). The differences in point estimates were more pronounced at the patient level compared to the household analysis.
Cis-female respondents had significantly higher odds of experiencing diagnostic P&Ms compared to cis-male respondents (odds ratio 1.2, p = 0.04 for at least one P&M; odds ratio 1.35, p = 0.02 for multiple P&Ms). Transgender and gender independent individuals also exhibited significantly higher odds of experiencing at least one P&M compared to cis-males (odds ratio 2.04, p = 0.05). Although the direction of the effects in the patient analysis were again consistent with the household analysis, the point estimates indicated either the same or less separation from the reference group.
As with the household analysis of racial and ethnic predictors, only individuals identifying as multiracial exhibited significantly higher odds of experiencing P&Ms compared to non-Hispanic White individuals (odds ratio 1.80, p = 0.03 for at least one; odds ratio 2.00, p = 0.03 for multiple P&Ms). Point estimates in the household and patient analyses were quite similar.
Disabled (unable to have full-time work) respondents had significantly higher odds of experiencing diagnostic P&Ms compared to the reference group (odds ratio 2.27, p < 0.0001 for at least one; odds ratio 2.66, p < 0.0001 for multiple P&Ms).
Overall, the findings highlight the presence of disparities in the prevalence of diagnostic P&Ms affecting respondents’ own healthcare, with significant associations observed for patient age, household income, education completed, gender, race and ethnicity, and disability in both analyses (household and patient only).
3.6 Persistent harms from diagnostic P&MsTable 4 presents the regression results of sociodemographic predictors of diagnostic P&Ms with severe impacts for both the full household sample and the patient subsample. While the direction of effects of sociodemographic predictors by subgroups is similar in both analyses, there are some predictors that are only statistically significant in one of the analyses.

Table 4. Disparities in prevalence of diagnostic P&Ms affecting respondents’ own health care.
3.6.1 Household level analysisAs shown in the Table 4 household regression results, being cis-female or disabled (unable to have full-time work) was associated with significantly higher odds of both persistent emotional harm (anxiety of the respondent) and persistent physical harm (for the patient) compared to the reference group. For emotional harm, being cis-female increased odds to 1.36 (p = 0.01) and being disabled (unable to have full-time work) increased odds to 2.22 (p = 0.0002) compared to the reference groups. Being cis-female, disabled or multi-racial was also associated with significantly higher frequencies of persistent physical harm, with odds ratios of 1.45 (p = 0.03); 2.76 (p = 0.0001); and 2.17 (p = 0.03), respectively.
For the lowest income group (under $30,000), only persisting emotional harms exhibited statistically significant increased likelihood (odds ratio 1.94, p = 0.002) compared to the highest household bracket of $100,000 or more. Increased odds of persisting physical and emotional harm were each significant for the $30,000 to 59,999 group (odds ratio 1.75, p = 0.02; and odds ratio 1.71, p = 0.006, respectively) compared to the reference group. Respondents reporting on patients in the lowest age group (18 through 24 years old) had significantly higher odds of persisting emotional harm (odds ratio 1.83, p = 0.01).
Significant predictors of decreased odds of persisting emotional harm after diagnostic P&Ms were seen for older age groups (odds ratio 0.48, p = 0.004 for those 65 to 74 years old and 0.41, p = 0.01 for those 75 and older).
3.6.2 Patient level analysisSimilar to the household level regression analysis results, the odds of higher frequencies of persisting harm (physical or emotional) were significant for lower income, cis-female, and disabled (unable to have full-time work) work status (Table 4). The highest and most significant odds of both persisting physical and emotional harms were experienced in the disabled (unable to have full-time work) group compared to the reference group (odds ratio 4.11, p < 0.0001 for physical harm; odds ratio 2.55, p = 0.0002 for emotional harm). Significantly lower odds for older adults for persisting emotional harms were also present in the patient subsample.
Unlike the household sample, Table 4 shows higher prevalence of persisting physical harms for the 65–74 years old age group compared to those 45 to 54 (odds ratio 0.26, p = 0.006). Lower educational attainment significantly predicted reduced odds of physical harm for those with some high school (odds ratio 0.37, p = 0.05), and reduced emotional harm for high school graduates (odds ratio 0.66, p = 0.04) compared to the reference group.
The significant race and ethnicity predictors were not the same in the patient subsample. Patients who identified as Black, non-Hispanic were also at significantly lower risk of reporting persisting physical harm about oneself (odds ratio 0.41, p = 0.03 compared to reference group), as well as persisting emotional harm (odds ratio 0.46, p = 0.004). The disparity in prevalence of statistically significant higher odds of persisting physical harm noted for those identifying as multiracial in the household sample was not seen in the patient subsample (odds ratio 1.19 [not significant] versus 2.17, p = 0.03 in the household analysis).
3.7 Diagnosis impaired by personal attributes: household and patient-level analysesTable 5 displays regression results for both analytic frames. For respondents in both samples, the youngest patient group (18–24 years old) was twice as likely to endorse perceiving that a personal attribute impaired diagnosis compared to the reference group (odds ratio 1.84, p = 0.04 for household sample; odds ratio 2.02, p = 0.04 for patient sample). The two oldest age categories had significantly lower odds of perceiving that a personal attribute impaired diagnosis with the lowest odds for patients 75 and older.
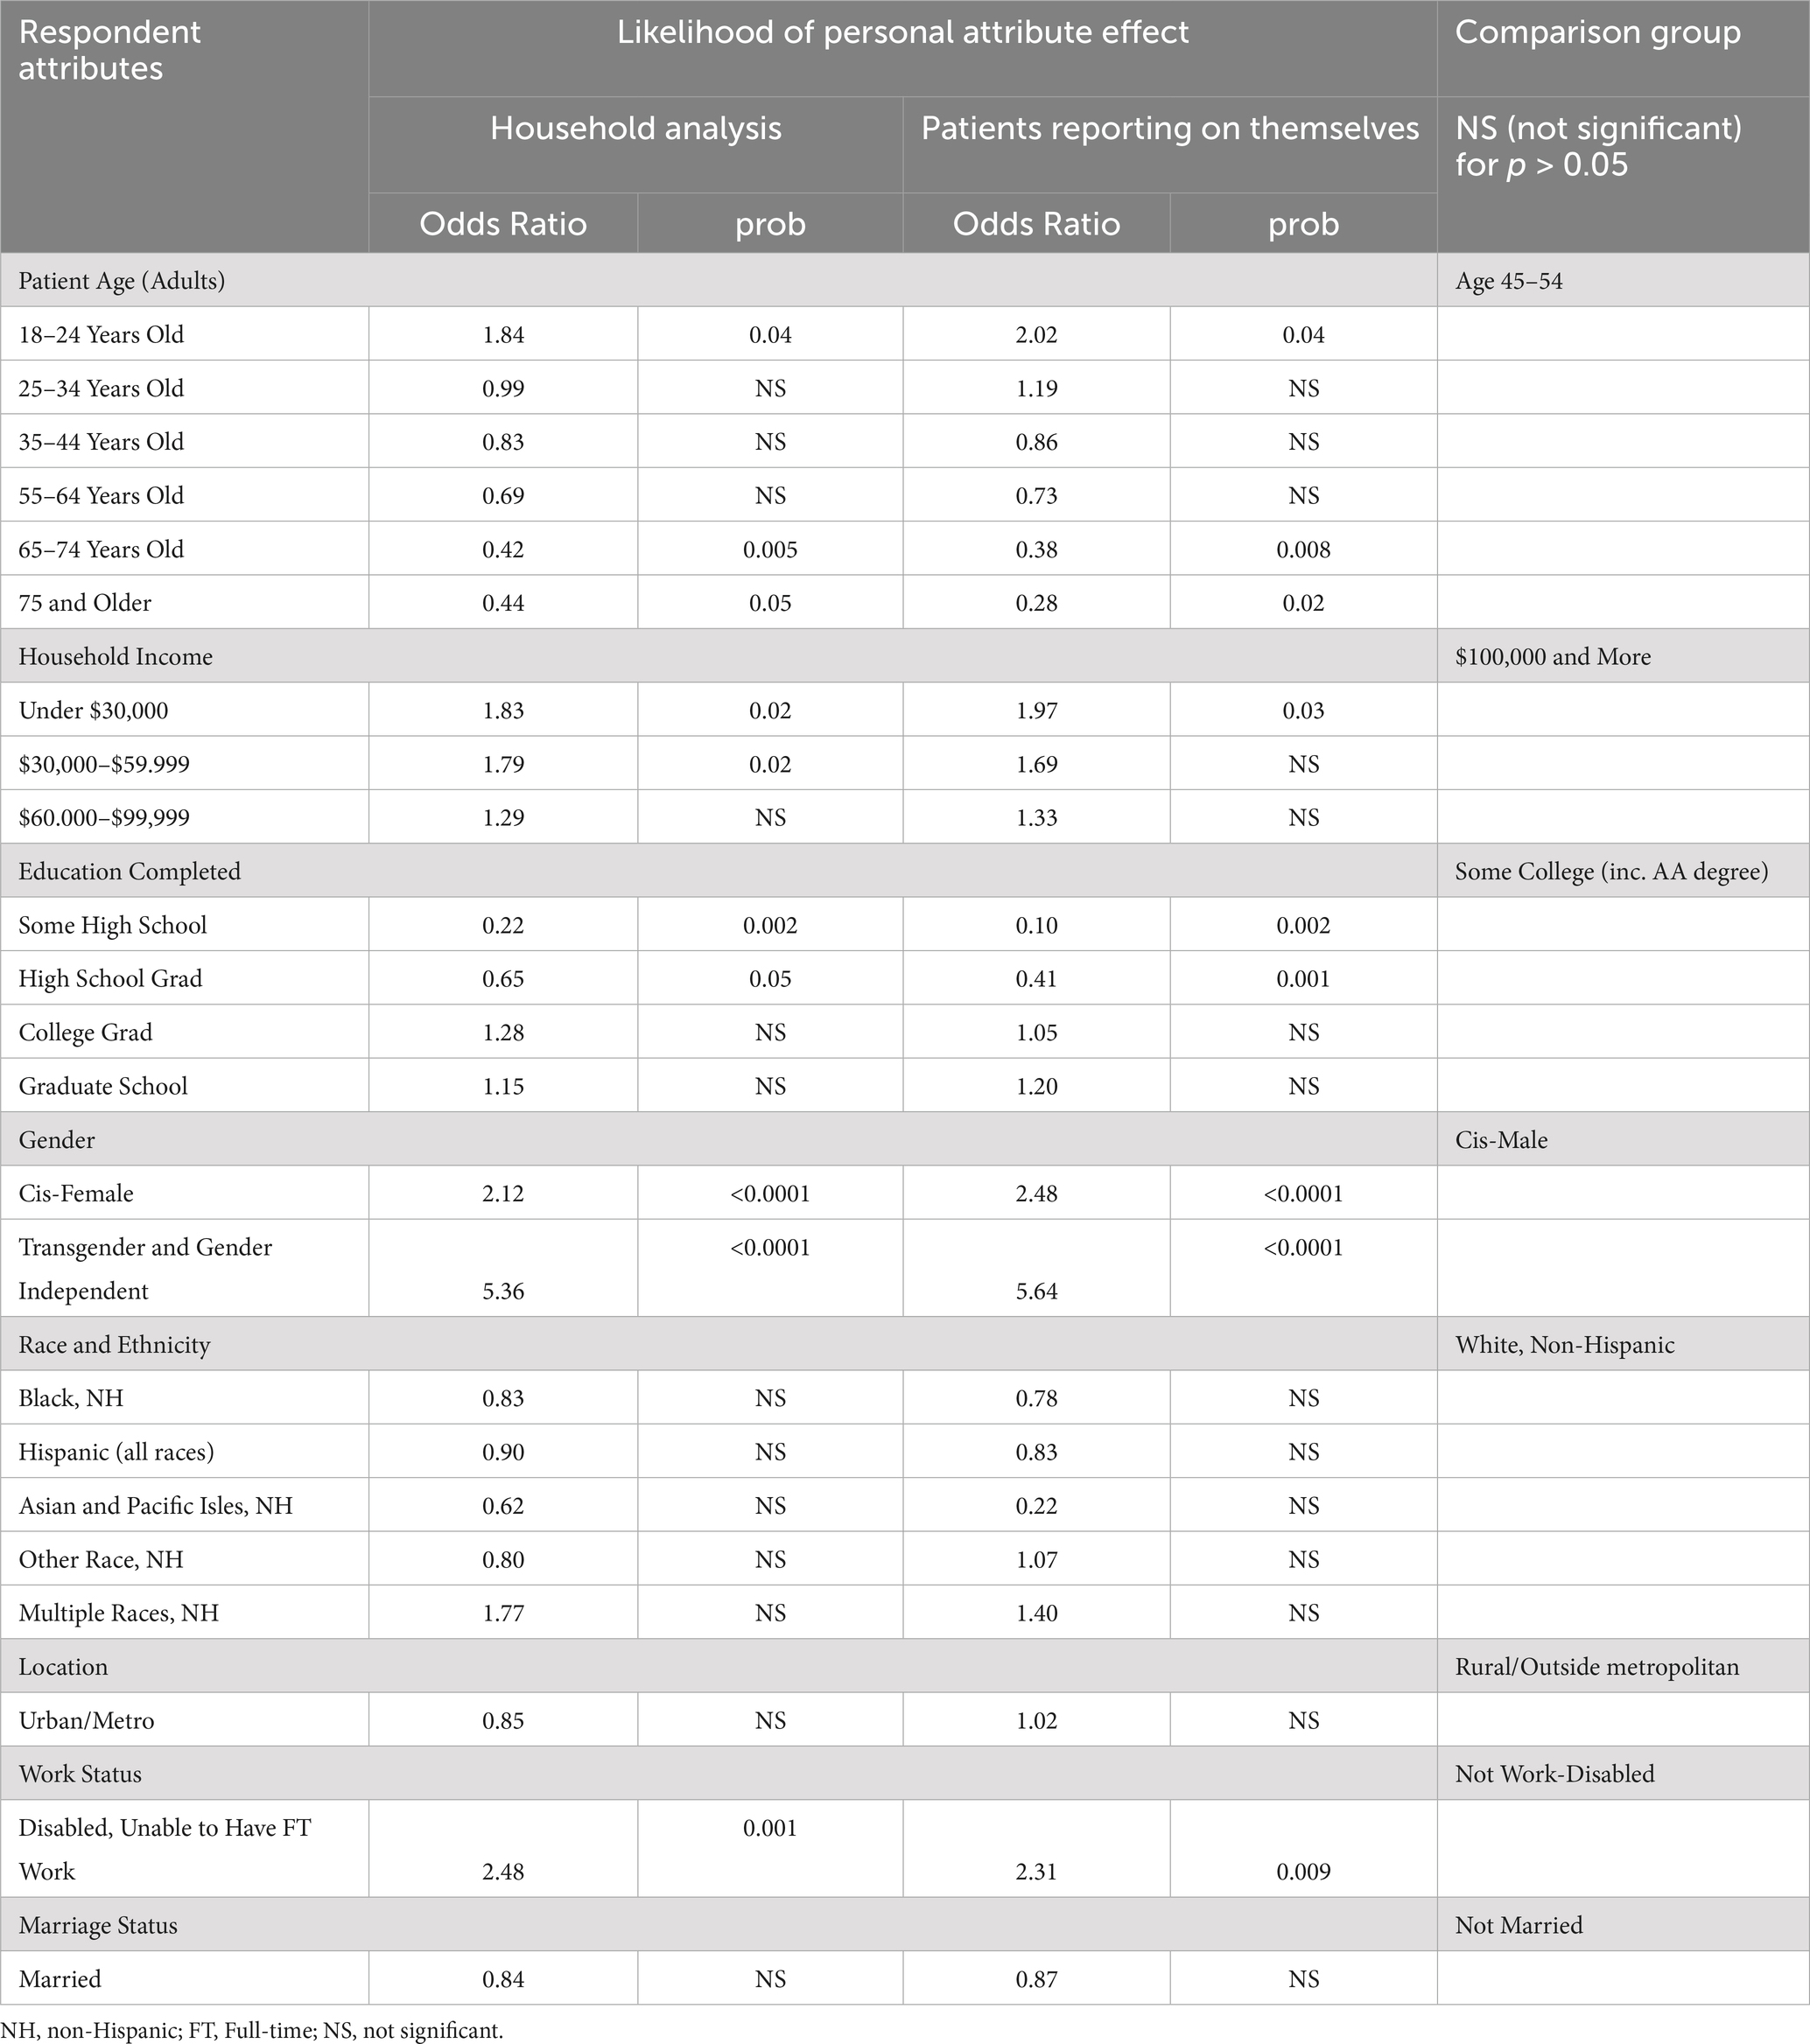
Table 5. Personal attribute perceived as impairing diagnosis during diagnostic P&M.
In both the household and patient samples, higher odds of experiencing an impaired diagnosis based on personal attributes were significantly predicted at almost twice the odds for the lowest income brackets (under $30,000) as well as for the next lowest bracket ($30,000–$59,999) for the household sample compared to reference group ($100,000 and more). Lower levels of educational attainment significantly predicted much lower likelihood of perceived personal attribute effect, with the lowest odds reported by patients themselves with some high school (odds ratio 0.10, p = 0.002) compared to the reference group (some college education).
Higher rates of perceiving a personal attribute impaired diagnosis were predicted for cis-female gender and transgender and gender independent groups compared to the cis-male group in both samples (odds ratio 2.48, p < 0.0001 and odds ratio of 5.64, p < 0.0001, respectively). Inability to work due to a disability was also consistently associated with an elevated rate of reporting that diagnosis had been disrupted by a personal attribute.
3.8 Expectations for future diagnostic risksTable 6 illustrates several disparities in expectations for future diagnostic risks among respondents, as assessed by the likelihood of the respondent anticipating a future diagnostic P&M occurring when receiving health care. We report both household and patient-level analyses in the table side-by-side.
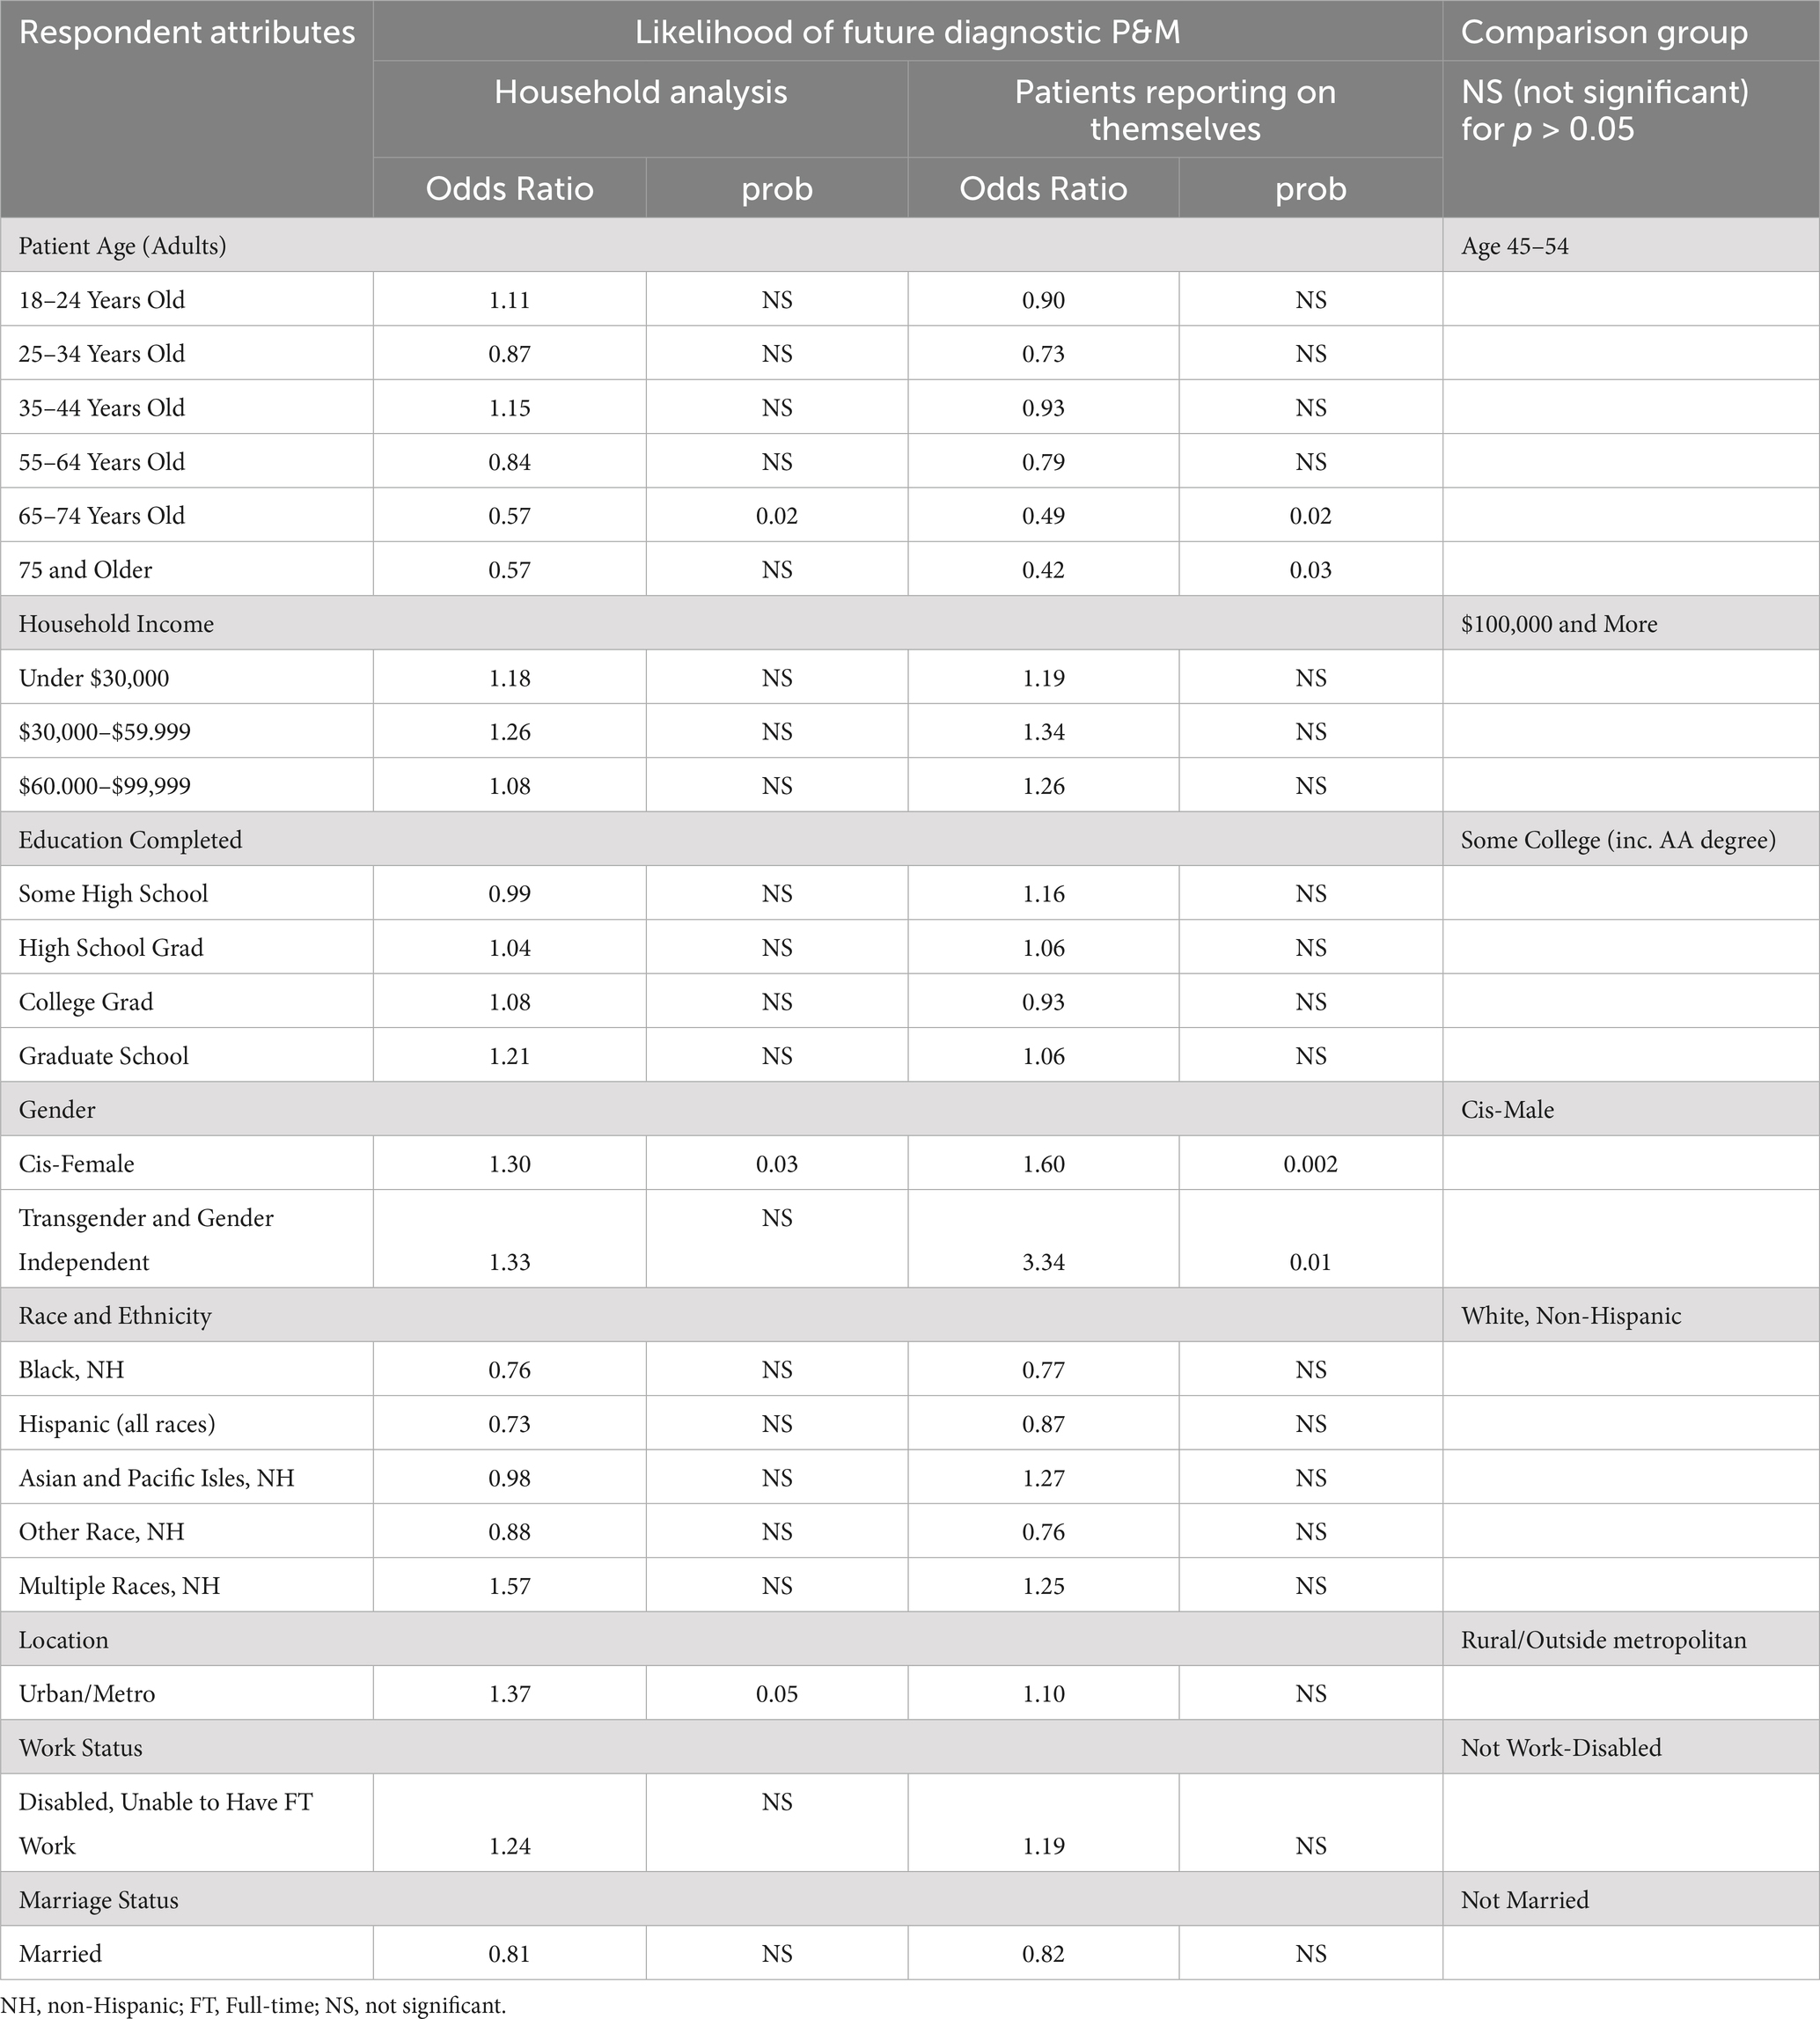
Table 6. Disparities in expectations for future diagnostic risks.
Older age groups had significantly lower odds of expecting a future diagnostic P&M compared to the reference group (odds ratio 0.49, p = 0.02 for 65–74; odds ratio 0.42, p = 0.03 for 75 and older for patients reporting on themselves). A similar pattern holds for the household level data, which include expectations reported by care partners. Within this sample, only the 65 to 74 group had statistically significantly lower odds of concern (odds ratio 0.57, p = 0.02).
In comparison to cis-males, cis-females and transgender and gender independent individuals who had experienced a diagnostic P&M had significantly higher odds of expecting future diagnostic P&Ms (odds ratio 1.60, p = 0.0002 for cis-females; odds ratio 3.34, p = 0.01 for transgender and gender independent in the household analysis). In the household sample, the cis-female group, but not the transgender and gender independent group, had statistically significant higher odds of concern.
In both cases, the gender-related differences in future risk were consistent with the differences in P&M and harm experiences reported in Tables 3, 4. By contrast, households in urban/metro areas reported statistically higher odds of concern about future diagnostic P&Ms (odds ratio 1.37, p = 0.05). though these elevated risk perceptions were not matched by any comparable geographic differences in the experience of diagnostic P&Ms or harms.
4 DiscussionOur study aimed to fill several noteworthy gaps in the literature on diagnostic safety. First, it enriches our understanding of patient-reported diagnostic P&Ms by augmenting earlier findings estimating the national prevalence of harmful diagnostic events by incorporating multiple P&Ms, harmful consequences, and P&Ms attributable to differential treatment based on identified personal attributes. These new findings offer valuable insights into the prevalence of diagnostic breakdowns and their distribution across various sociodemographic groups, shedding light on disparities that may exist in healthcare experiences and outcomes related to diagnosis. The consistency of findings across multiple outcomes increases our confidence that these at-risk groups merit greater attention and protections.
Second, we successfully demonstrated the feasibility of obtaining patient-reported data from a national sample to better understand diagnostic P&Ms and their sociodemographic predictors. This includes responses from population subgroups that have historically had limited opportunities to voice problems and mistakes during their diagnostic experiences. And it includes data from narrative accounts that illuminate interactions within the diagnostic process in ways not previously visible to researchers.
Our analyses revealed several types of noteworthy findings that we group into three clusters. The first set involves results that are broadly consistent with findings from past studies, but which highlight nuances not identified in previous research. The second set of findings illuminate new sources of disparities for which we have not previously had reliable national estimates of magnitude, and fresh aspects or perspectives that more fundamentally alter how we should think about or address diagnostic inequities. The final cluster is in some ways the most generative, raising a variety of questions or puzzles that merit attention in future research.
In discussing our findings, we utilize definitions of health equity, diagnostic equity, health disparities and diagnostic disparities summarized in the public briefing book for the National Academies Workshop: “Advancing Equity in Diagnostic Excellence to Reduce Health Disparities.” (46) Specifically, health equity is “the state in which everyone has a fair and just opportunity to attain their highest level of health.” (47), while diagnostic equity is defined as “providing everyone with a fair and just chance of receiving a timely, accurate diagnosis to lead to appropriate inter
留言 (0)