
記住我

Salmonella enteritidis (SE) is a significant zoonotic pathogen that not only inflicts substantial economic losses on the livestock industry but has also emerged as one of the predominant serotypes causing salmonellosis in humans in recent years (Zhou et al., 2023; Chousalkar et al., 2018). While strict biosecurity measures can create Salmonella-free poultry farming environments, such measures are often economically unfeasible in many countries. Moreover, the widespread emergence of multidrug-resistant strains has raised concerns about the use of antibiotics. Vaccination remains a primary strategy for controlling Salmonella infections. Currently, inactivated vaccines, subunit vaccines, and live attenuated vaccines represent the major categories of Salmonella vaccines under development (Huberman et al., 2019).
Studies indicate that inactivated vaccines primarily induce humoral immunity and fail to elicit robust cell-mediated immune responses. As a result, booster immunizations are often required to achieve long-term protection (Deguchi et al., 2009). Subunit vaccines, while safe, typically require multiple doses to extend the duration of immunity and necessitate suitable adjuvants to trigger effective cellular immune responses. In contrast, live attenuated vaccines, when administered orally, adhere to the intestinal mucosa and mimic natural infection, thereby eliciting strong humoral and cell-mediated immune responses (Van Immerseel et al., 2005). The identification of virulence genes is crucial for developing gene-deletion-based live vaccines. This approach has been successfully employed in the development of various vaccines, including those for Brucella spp., Salmonella Typhimurium, Yersinia pestis, Vibrio anguillarum, and Edwardsiella tarda (Yang et al., 2015; Liu et al., 2018; Park et al., 2020; Cote et al., 2021; Zabalza-Baranguá et al., 2023).
SE must overcome multiple defense mechanisms inside and outside the gastrointestinal tract to establish infection in the host. Upon entering the digestive system, the first challenge it encounters is the bactericidal effect of gastric acid. Gastric acid, being a strongly acidic environment, inhibits or kills most microorganisms that reach the stomach. To survive, SE expresses high levels of acid shock proteins, such as ATPase, which help maintain intracellular pH balance and enhance its resistance to gastric acid. In the intestine, SE defends itself against bile and digestive enzymes by regulating its lipopolysaccharide (LPS) structure and producing anti-bile proteins, such as TolC. In the small intestine, it utilizes a type III secretion system (T3SS) to secrete effector molecules, including SipA, SipB, and SipC, which facilitate its invasion of intestinal epithelial cells. Within host cells, Salmonella forms a specialized membrane-bound compartment called the Salmonella-containing vacuole (SCV), which protects it from lysosomal degradation. After being phagocytosed by macrophages, SE injects T3SS effectors like SifA and SipC to inhibit the fusion of SCVs with lysosomes. Additionally, Salmonella can evade autophagy-mediated clearance by secreting effectors such as SseJ, allowing it to persist and proliferate within the SCV. In summary, the infection process of SE involves adapting to gastric acid, resisting bile, invading intestinal epithelium, evading the immune system, surviving intracellularly, and inducing inflammation. Each step relies on specific virulence factors and adaptive mechanisms, enabling Salmonella to establish infection in the gastrointestinal tract and beyond, leading to host disease. The loss of these virulence factors significantly attenuates the pathogen’s virulence. Consequently, researchers have utilized these virulence factors to develop various gene-deletion vaccines, achieving promising immune protection results.
Methyl-accepting chemotaxis protein C (McpC) is a methylation-based chemotaxis protein involved in bacterial chemotaxis, enabling directional movement in response to chemical gradients. By sensing and transmitting environmental chemical signals, McpC helps bacteria regulate their motility. This chemotactic ability is crucial for pathogenic bacteria to colonize and spread within the host, thereby playing a significant role in virulence. Additionally, McpC is involved in regulating biofilm formation, flagellar biosynthesis, and toxin production (Hickman et al., 2005; Berleman and Bauer, 2005; Harkey et al., 1994). As such, modulating McpC expression or function in pathogens may impact their infection efficiency and pathogenicity, making McpC a key target for studying bacterial virulence and infection mechanisms. Previous studies have demonstrated the role of methyl-accepting chemotaxis proteins (MCPs) in the pathogenicity of various bacteria, including Pseudomonas aeruginosa, Campylobacter jejuni, and Vibrio cholerae (Li et al., 2014; Sampedro et al., 2014; Nishiyama et al., 2016). Based on these findings, it is hypothesized that McpC contributes to the virulence of SE, a hypothesis that requires further experimental validation. By precisely deleting the mcpC gene, the pathogen’s virulence is significantly reduced while retaining its immunogenicity, thereby greatly enhancing safety and efficacy. Moreover, the vaccine strain produced by deleting the presumed virulence-associated gene mcpC can induce robust mucosal, cellular, and humoral immune responses, making it suitable for non-injection administration methods such as oral or spray vaccination, which facilitates large-scale application.
In this study, we constructed an mcpC gene deletion strain (ΔmcpC) using homologous recombination techniques and investigated its impact on SE virulence. The evaluation included analyses of stress resistance, biofilm formation, motility, adhesion, invasion, intracellular survival in macrophages, LD50, expression levels of virulence genes, and bacterial load in host organs. Additionally, we assessed the ability of ΔmcpC to induce immune responses and its protective efficacy in mice using an infection model. The findings provide a foundational basis for the development of genetically engineered live-attenuated vaccines targeting SE.
Materials and methods Bacterial strains, cells and plasmidsBacterial strains and plasmids used in this study are listed in Table 1. Salmonella enteritidis strain C50336, a wild-type strain, was preserved in the Key Laboratory of Preventive Veterinary Medicine, Hebei Province, and used for constructing the ΔmcpC strain. The mcpC gene deletion strain in this study was constructed using the λ-Red recombinase-mediated gene replacement method (Datsenko and Wanner, 2000). The bacteria were cultured in Luria-Bertani (LB) broth (Haibo Biotechnology Co., Ltd.) at 37°C unless otherwise specified. Human epithelial Caco-2 BBE cells and mouse macrophage RAW264.7 cells used in this study were provided by BeNa Culture Collection (Shanghai, China). Both cell types were cultured in DMEM (Thermo Fisher Scientific Co., Ltd.) supplemented with 10% fetal bovine serum (Thermo Fisher Scientific Co., Ltd.). Antibiotics were added as necessary, such as 50 μg/mL streptomycin and 50 U/mL penicillin, or 50 μg/mL gentamicin, in an incubator with 5% CO₂.
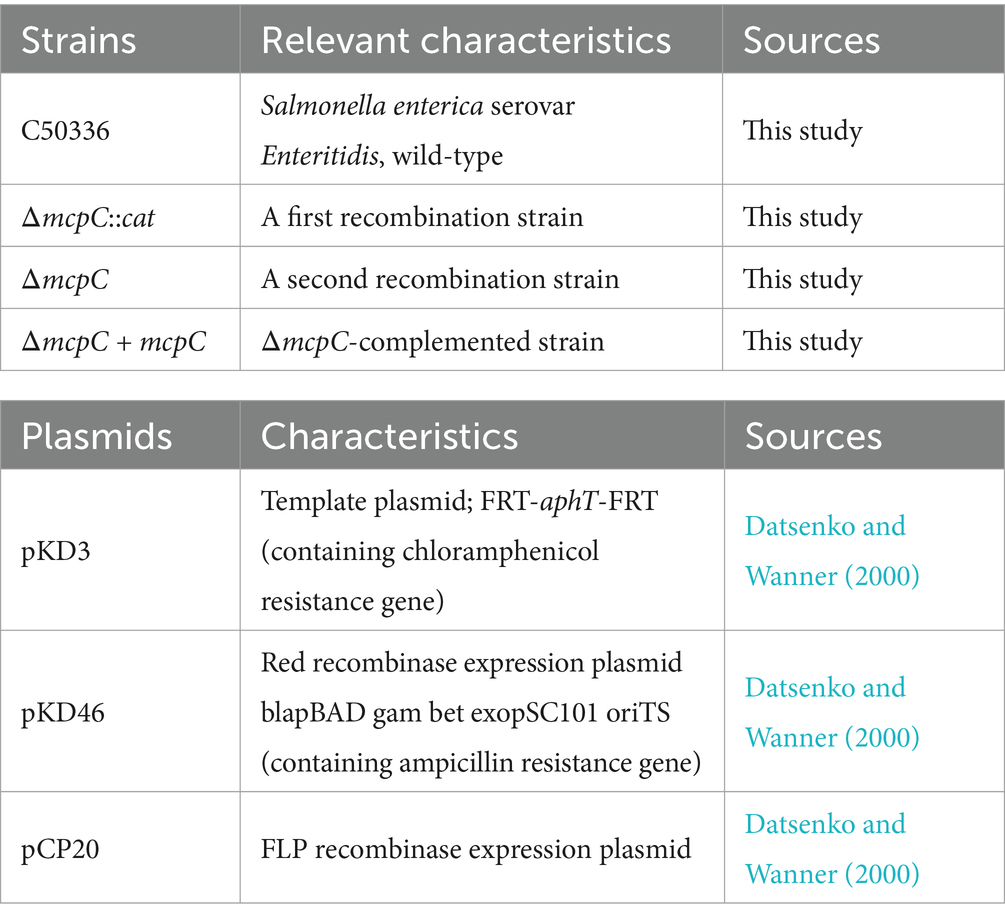
Table 1. Bacterial strains and plasmids used in this study.
Experimental animals and ethical statementKunming (KM) mice were obtained from Beijing Speifu Biotechnology Co., Ltd. All animal experiments were conducted in full compliance with international ethical standards and the Experimental Animal Regulation Ordinances (HPDST 2020-17) as stipulated by the Hebei Provincial Department of Science and Technology. The study protocol was reviewed and approved by the Animal Care and Use Committee of Hebei Normal University of Science and Technology.
Construction of the mcpC deletion strain and complemented strainC50336 (pKD46) was cultured in Luria-Bertani agar (LBA) containing 225 mg/mL L-arabinose at 30°C until the optical density (OD) at 600 nm reached 0.6–0.8. The cells were then washed three times with pre-chilled autoclaved ultrapure water to prepare electrocompetent cells. Using DH5α (pKD3) as a template, a homologous targeting fragment was amplified with specific primers P1 and P2 (Table 2). The purified fragment was electroporated into electrocompetent C50336 (pKD46) cells. Subsequently, 1 mL of LB broth was added, and the cells were incubated at 30°C for 2 h. The culture was then plated onto LB agar containing 50 μg/mL chloramphenicol (Cm). Colonies were identified using primers P3 and P4 (Table 2). Positive strains were cured of the pKD46 plasmid by incubation at 42°C and were designated as ΔmcpC::cat.
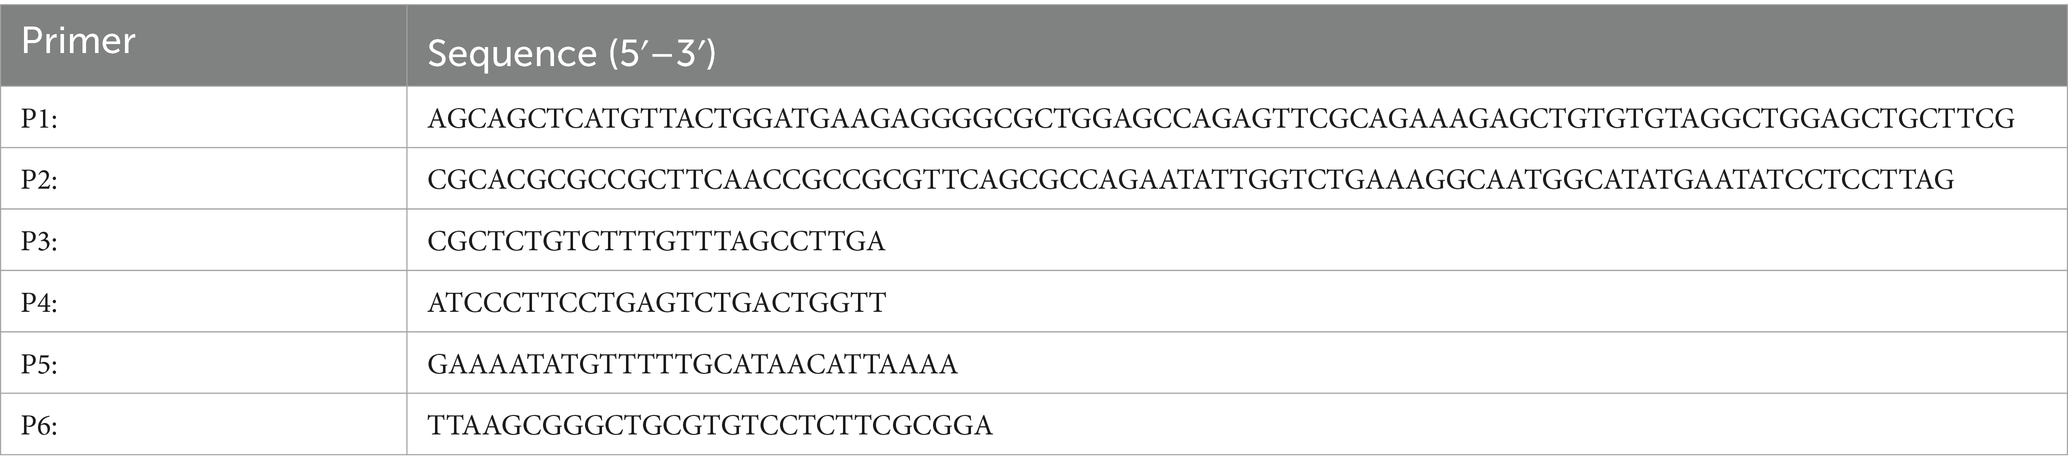
Table 2. Primers used for constructing the mutant and the complemented strain.
To remove the Cm cassette, the pCP20 plasmid was introduced into ΔmcpC::cat via electroporation. Mutants were identified using primers P3 and P4, and positive strains were cured of the pCP20 plasmid by incubation at 42°C, resulting in the final ΔmcpC strain.
For the construction of the complemented strain, the open reading frame of the mcpC gene was amplified using primers P5 and P6 (Table 2). The purified PCR product was cloned into the pMD-19 T vector [Takara Biomedical Technology (Beijing) Co., Ltd.], resulting in the recombinant plasmid pMD-19 T-mcpC. This plasmid was then introduced into ΔmcpC by electroporation, and transformants were confirmed using primers P5 and P6. The complemented strain was designated as ΔmcpC + mcpC.
In vitro stress simulation experimentsOvernight cultures of C50336, ΔmcpC and ΔmcpC + ΔmcpC were washed three times with physiological saline and enumerated using the traditional plate counting method to determine the initial bacterial count. The bacterial suspensions were then subjected to static incubation under various stress conditions: physiological saline at pH 3.5, physiological saline at pH 10, and at 42°C for 1 h. Additionally, the bacterial suspensions were exposed to physiological saline containing 10 mmol/L H2O2 for 10 min. After stress treatment, bacterial counts were determined, representing the post-stress bacterial count. The survival rate of each strain under different conditions was calculated as follows: survival rate = (post-stress bacterial count)/(initial bacterial count).
Biofilm formation assayThe crystal violet (CV) staining method was used to assess biofilm formation (Zhang et al., 2020). Bacterial suspensions of C50336, ΔmcpC, and ΔmcpC + mcpC were inoculated at a 1:100 ratio into glass tubes containing 6 mL of LB broth and incubated statically at 28°C for 3 days. The tubes were washed 2–3 times with PBS, fixed with anhydrous methanol for 15 min, and stained with 2% CV for 15 min. The presence and thickness of stained bacterial rings on the tube walls were observed.
For quantitative analysis, a 96-well plate assay was performed. Each well was inoculated with 150 μL of bacterial suspension and stained as described above. After staining, 200 μL of anhydrous ethanol was added to each well to dissolve the CV. Absorbance at 570 nm was measured, and the experiment was repeated three times.
To detect two major components of the biofilm, curli fimbriae and cellulose, 5 μL of bacterial suspension from C50336, ΔmcpC, and ΔmcpC + mcpC was spotted onto salt-free LB agar containing 160 mg/L Congo red and 10 mg/L Coomassie brilliant blue (for curli detection) or onto agar containing 200 mg/L Calcofluor White Stain (CWS) for cellulose detection. Plates were incubated at 28°C for 2 days. Colony color, morphology, and fluorescence intensity under UV light (366 nm) were observed (Dong et al., 2011).
Motility assayBacterial motility was assessed using semi-solid agar plates (0.3% agar). Briefly, 5 μL of overnight bacterial culture was carefully inoculated into the center of the semi-solid agar plate by gently stabbing it with a pipette tip to avoid agitation. Plates were incubated upright at 37°C for 5–6 h. Motility was determined by observing the migration of bacteria from the inoculation site toward the periphery of the plate. The experiment was repeated three times (Eakley et al., 2011).
Adhesion, invasion, and intracellular survival assaysBacterial suspensions of C50336, ΔmcpC, and ΔmcpC + mcpC were washed three times with PBS and enumerated using CFU calculations from serial dilutions on agar plates. Caco-2 BBE cells were seeded into 12-well plates at a density of 105 CFU/well and cultured overnight in antibiotic-free DMEM supplemented with 10% FBS to achieve 80% confluence. The cells were washed three times with sterile PBS, and 1 mL of bacterial suspension was added to each well at a multiplicity of infection (MOI) of 100. Plates were centrifuged at 1,000 rpm for 5 min and incubated in a 37°C, 5% CO₂ incubator for 1 h (Xiong et al., 2023).
Adhesion assayAfter a 1-h incubation, the cells were washed three times with PBS and lysed with 1% Triton X-100 for 8 min. The cell lysates were serially diluted and plated on SS agar for bacterial enumeration. Adhesion rate = (number of adhered bacteria/number of bacteria in the inoculum per well) × 100%.
Invasion assayAfter a 1-h incubation, the cells were washed three times with PBS and further incubated for 1 h in DMEM containing gentamicin (100 μg/mL) to kill extracellular bacteria. The cells were then lysed with 1% Triton X-100 for 8 min, and the lysates were plated for bacterial enumeration. Invasion rate = (number of intracellular bacteria/number of bacteria in the inoculum per well) × 100%.
For the intracellular survival assay, RAW264.7 cells were seeded at a density of 105 cells per well into two 12-well plates. Cells were infected with bacteria at an MOI of 100 and incubated at 37°C with 5% CO₂ for 2 h. Non-adherent and non-invaded bacteria were removed by washing the cells twice with PBS. The cells were then incubated for 1 h in DMEM containing 100 μg/mL gentamicin to eliminate remaining extracellular bacteria. The cells were lysed with 1% Triton X-100, and intracellular bacteria were enumerated, representing the bacterial count at 3 h post-infection. For the second plate, the cells were further incubated in DMEM containing 10 μg/mL gentamicin for 20 h. Cells were then lysed with 1% Triton X-100, and intracellular bacteria were enumerated to represent the bacterial count at 23 h post-infection. Intracellular survival rate = (intracellular bacteria at 23 h/intracellular bacteria at 3 h) × 100%.
Determination of LD50 in miceEighty KM mice aged 4 to 6 weeks were randomly divided into 16 groups (n = 5). The first five groups were intraperitoneally (i.p.) injected with C50336 at doses of 2 × 10⁷, 2 × 10⁶, 2 × 10⁵, 2 × 10⁴, and 2 × 10³ CFU/mouse, respectively. The second five groups were i.p. injected with ΔmcpC at doses of 3.8 × 10⁹, 3.8 × 10⁸, 3.8 × 10⁷, 3.8 × 10⁶, and 3.8 × 10⁵ CFU/mouse, respectively. The third five groups were i.p. injected with ΔmcpC + mcpC at doses of 2 × 10⁷, 2 × 10⁶, 2 × 10⁵, 2 × 10⁴, and 2 × 10³ CFU/mouse, respectively. The remaining group was i.p. injected with an equal volume of PBS. The mortality of the mice was observed and recorded over a 14-day period following the injection (Yin et al., 2019).
The LD50 value was calculated using the formula of log10 (50% endpoint) = A + (B × C), where A = log10 (infectious dose showing a mortality next below 50%), B = difference of logarithms = [50% − (mortality at infectious dose next below 50%)]/[(mortality next above 50%) − (mortality next below 50%)], and C = log10 (difference between serial infectious doses used in challenge studies) (Park et al., 2022).
RNA extraction and quantitative real-time PCRTo further investigate the effect of the mcpC gene on the virulence of SE, quantitative real-time PCR (qPCR) was employed to analyze the expression levels of SE virulence-related genes after the deletion of the mcpC gene. The procedure was as follows: RNA was extracted using a bacterial RNA extraction kit (Beijing Aidlab Biotechnologies Co., Ltd.), and genomic DNA was removed via DNase I treatment. The RNA was then reverse-transcribed into cDNA using a reverse transcription kit (Bohang Biotechnology Co., Ltd.). This cDNA was used as the template for qPCR analysis with the SYBR Green dye method. The UltraSYBR Mixture used in this method is from Jiangsu Cowin Biotech Co, Ltd. Virulence factor-related genes and their primers were selected based on previously reported literature (Table 3), with the 16S rRNA gene serving as the internal control (Frye et al., 2006; Upadhyaya et al., 2013). The qPCR thermal cycling conditions were as follows: initial denaturation at 95°C for 10 min, followed by 40 cycles of 95°C for 15 s and 60°C for 1 min.
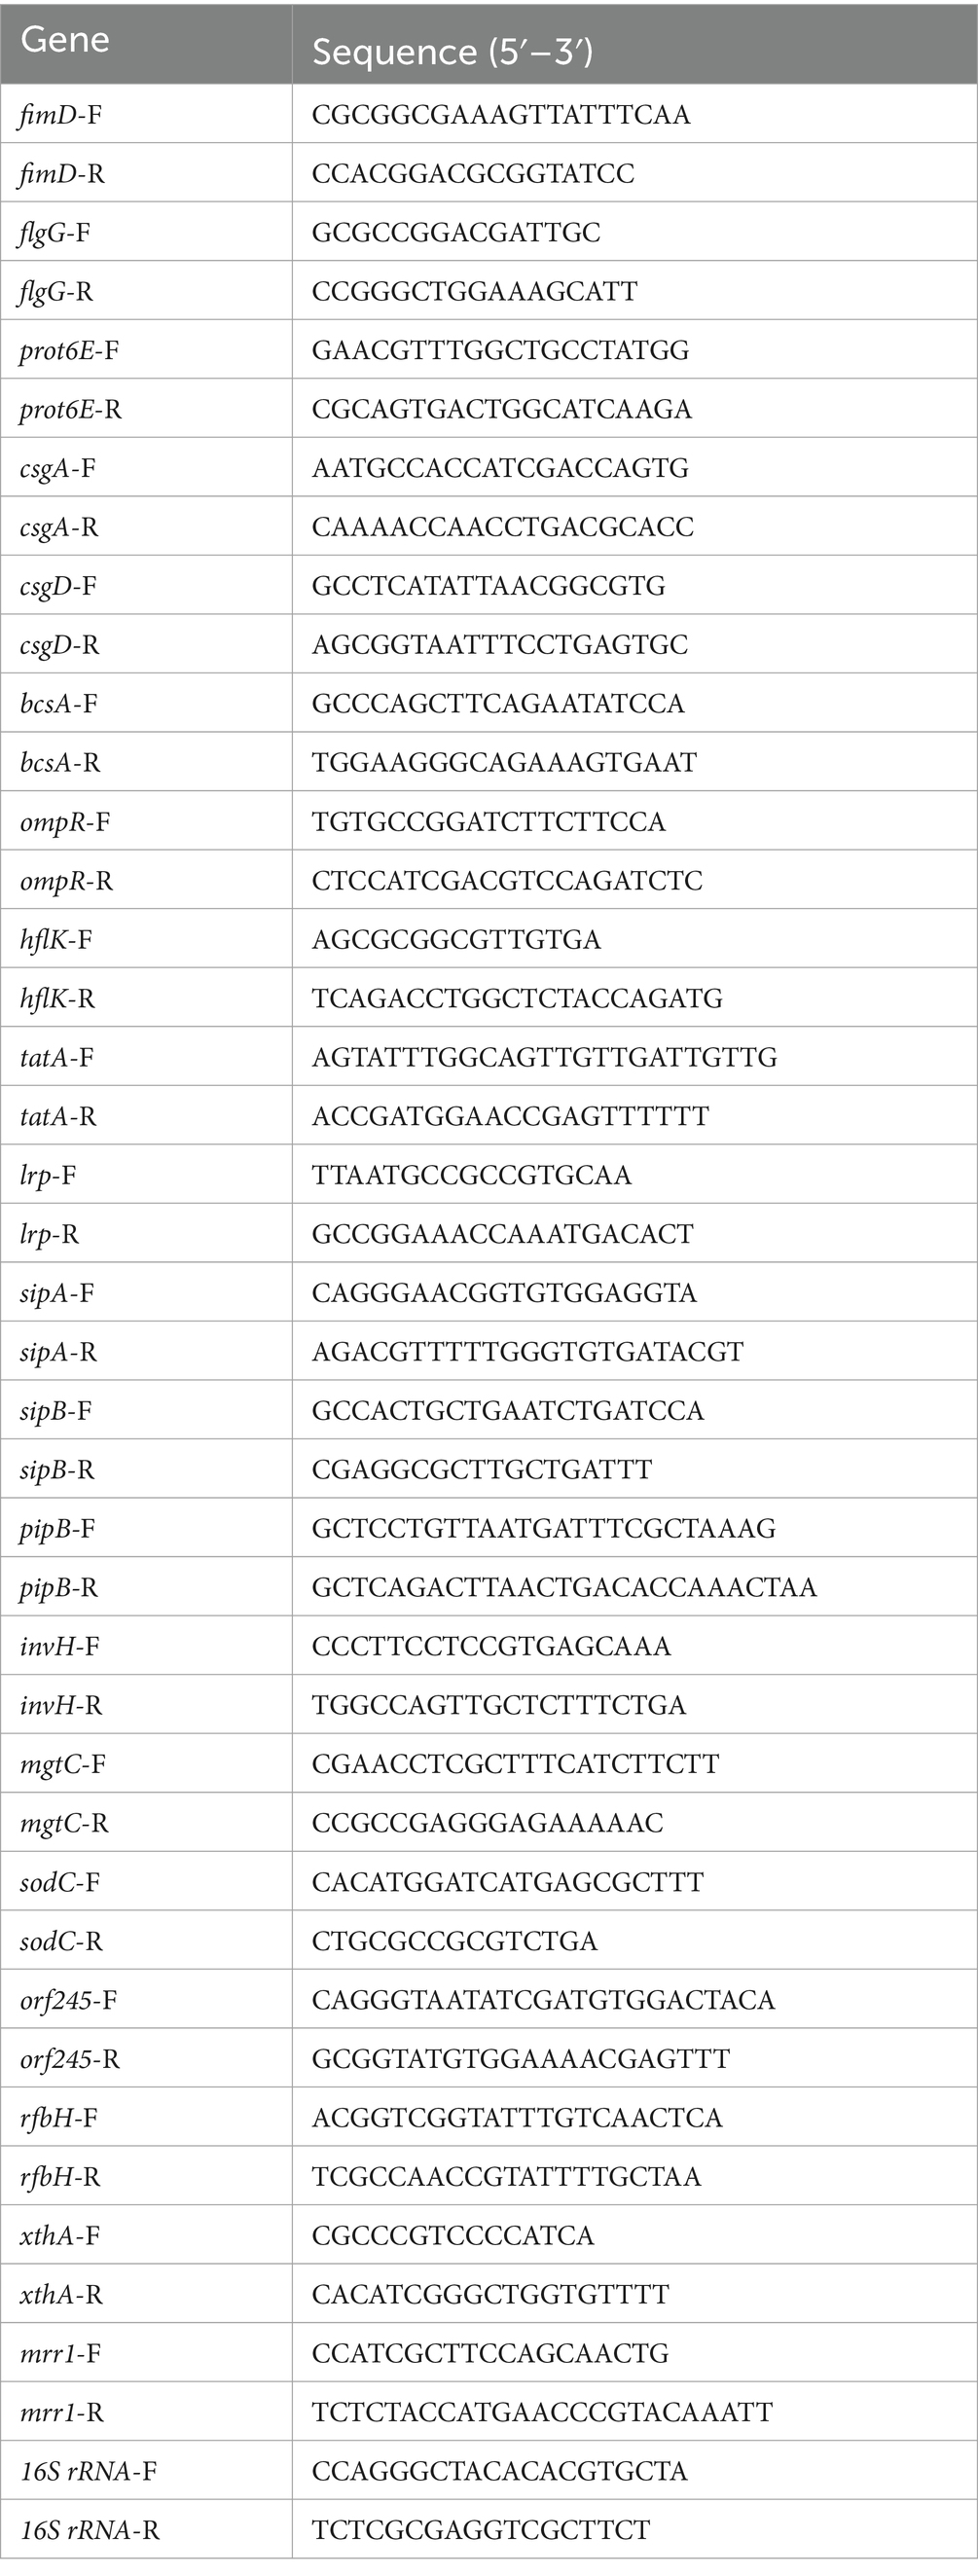
Table 3. Primers used for qPCR.
Bacterial colonization and persistence in organsThirty-five 4–6-week-old KM mice were randomly divided into two groups: the C50336 infection group (Group A, n = 20) and the ΔmcpC infection group (Group B, n = 15). Mice in Group A were i.p. injected with the wild-type strain C50336, while mice in Group B were i.p. injected with the gene-deleted strain ΔmcpC. The injection dose for both groups was 2 × 10⁵ CFU/mouse. On days 3, 7, and 14 post-infection, five mice were randomly selected from each group and euthanized. Under sterile conditions, the liver, spleen, and cecum were collected, weighed, and homogenized in 1 mL of sterile PBS. Serial dilutions of the homogenate were plated on SS agar for bacterial enumeration. The bacterial load in each organ was calculated using the formula log10 CFU/g (Negi et al., 2007; Milanez et al., 2018).
Immunization with ΔmcpC in miceTwenty-four 6 to 8-week-old female KM mice were randomly divided into two groups: the immunized group (n = 12) and the control group (n = 12). The immunized group received an oral dose (p.o.) of 2 × 10⁷ CFU/mouse of the ΔmcpC strain. The procedure was as follows: after fasting and water deprivation for 6 h, each mouse was orally administered 100 μL of 5% NaHCO₃ to neutralize gastric acid. Two hours later, oral inoculation was performed using a gavage needle. On day 14 post-immunization (dpi), a booster immunization with the same dose was administered. The control group received an equivalent volume of PBS via oral administration.
Detection of IgG and IgAThe indirect ELISA method was employed to detect SE-specific IgG and IgA in the serum and feces of immunized mice. The strain C50336 was cultured to the logarithmic growth phase, washed twice with PBS, and resuspended. The suspension was ultrasonically lysed for 30 min at 4°C, followed by centrifugation at 8,000 rpm for 10 min. The supernatant was collected and stored at −80°C for use as the coating antigen (Ji et al., 2022). At 14 dpi and 28 dpi, blood samples were randomly collected from three mice in the immunized group and three in the control group. The blood was centrifuged to separate the serum, which was stored at −80°C for IgG detection. Fecal samples were also collected from the same three mice. Five fecal pellets from each mouse were suspended in 0.5 mL of extraction buffer containing 0.1 mg/mL soybean trypsin inhibitor (Shanghai Yuanye Bio-Technology Co., Ltd.), 10 mg/mL bovine serum albumin (Biofroxx), and 30 mM EDTA disodium (pH 7.6). After homogenization and centrifugation, the supernatant was collected and stored at −80°C for IgA detection (Nandre et al., 2011; Pasquevich et al., 2011).
Using a checkerboard titration method, the optimal antigen coating concentration and sample dilution were determined. The coating antigen (500 ng/100 μL) was added to a 96-well microtiter plate and incubated overnight at 4°C. Blocking was performed using 5% skim milk (prepared in PBS containing 0.05% Tween 20, PBST) at 37°C for 4 h (200 μL/well). After removing the blocking solution, the plate was washed three times with PBST. Serum samples diluted 1:400 or undiluted fecal supernatant (100 μL/well) were added and incubated at 37°C for 1 h. The plate was then washed three times with PBST. HRP-conjugated goat anti-mouse IgG (diluted 1:10,000, Beijing Solarbio Science & Technology Co., Ltd.) or HRP-conjugated goat anti-mouse IgA (diluted 1:10,000, Beijing Pulilai Gene Technology Co., Ltd.) was added at 100 μL/well and incubated at 37°C for 1 h. Following another washing step, 100 μL of TMB substrate solution (Beijing Solarbio Science & Technology Co., Ltd.) was added to each well and incubated at 37°C for 10 min. The reaction was terminated by adding 50 μL of 2 M H2SO4 to each well, and the OD450nm was measured (Park et al., 2022).
Lymphocyte proliferation assayThe C50336 bacterial antigen was prepared following the previously described method and used as a stimulant for the lymphocyte proliferation assay. At 14 dpi and 28 dpi, three mice from each group were euthanized. The spleens of the immunized mice were aseptically isolated, homogenized, and filtered through a 70 μm cell strainer (Beijing Labgic Technology Co., Ltd.) to obtain spleen cells. Red blood cells were lysed using a red blood cell lysis buffer (Beijing Solarbio Science & Technology Co., Ltd.). The spleen lymphocytes were suspended in RPMI Medium 1,640 (Thermo Fisher Scientific Co., Ltd.) supplemented with 10% fetal bovine serum (FBS), 50 U/mL penicillin, and 50 μg/mL streptomycin. Cell viability was assessed using the trypan blue exclusion test, and cells were counted using a hemocytometer.
In a 96-well tissue culture plate, 105 cells/100 μL of cell suspension were added to each well. For the stimulation group, bacterial antigen was added at a final concentration of 7.5 μg/mL (11 μL/well). For the non-stimulation group, 11 μL of RPMI Medium 1,640 containing 10% FBS, 50 U/mL penicillin, and 50 μg/mL streptomycin was added to each well. A medium-only control group was also included (111 μL/well). The 96-well tissue culture plates were incubated at 37°C in a humidified environment with 5% CO₂ for 72 h. Lymphocyte proliferation was measured using the MTT Cell Proliferation and Cytotoxicity Assay Kit (Shanghai Beyotime Biotechnology Co., Ltd.). Absorbance was measured at 450 nm, and the stimulation index (SI) was calculated as follows (Lin et al., 2017):
SI=MeanODvalue of stimulation group−MeanODvalue of medium−only group/MeanODvalue of non−stimulation group−MeanODvalue ofmedium−only group The expression of cytokines in the spleenqPCR was used to evaluate the expression levels of cytokines IL-1β, IL-2, IL-4, IL-6, IL-10, IFN-γ, and TNF-α in the spleen of immunized mice. At 14 dpi and 28 dpi, three mice from each group were randomly selected. Spleens were aseptically isolated, and total RNA was extracted using the TriQuick Total RNA Extraction Kit (Beijing Solarbio Science & Technology Co., Ltd.). DNA was removed by DNase I treatment, and RNA was reverse transcribed into cDNA using a reverse transcription kit (Bohang Biotechnology Co., Ltd.). Samples were stored at −80°C until use. RT-PCR for gene expression studies was performed using UltraSYBR Mixture (Jiangsu Cowin Biotech Co, Ltd., China).
The primers used for the qPCR are shown in Table 4. Cytokine expression levels were normalized to the internal control gene gapdh and β-actin and calculated using the 2−ΔΔCT method. Thermal cycling conditions: initial denaturation at 95°C for 10 min, followed by 40 cycles of 95°C for 15 s and 60°C for 1 min (Wang et al., 2021; Kang et al., 2022).

Table 4. Primers used for the qPCR amplification of cytokines.
Immune protection assessment in miceForty 6 to 8-week-old KM female mice were randomly divided into four groups (n = 10): the immunization groups (Group A and Group B), the challenge group (Group C), and the control group (Group D). Mice in Group A were orally administered 2 × 10⁷ CFU/mouse of ΔmcpC, with a booster immunization at the same dose at 14 dpi. Mice in Group B were orally administered 2 × 10⁶ CFU/mouse of ΔmcpC, also with a booster immunization at the same dose at 14 dpi. Mice in Groups C and D were orally administered an equivalent volume of PBS. At 28 dpi, mice in the immunization groups (Groups A and B) and the challenge group (Group C) were i.p. injected with 2 × 10⁷ CFU/mouse of C50336, while mice in the control group (Group D) were i.p. injected with an equivalent volume of PBS. For 14 days post-challenge, mouse mortality was recorded daily, and the relative survival rate was calculated as follows:
Relative survival rate=Mortality rate of thecontrol group−Mortality rate of theexperimental group/Mortality rate of thecontrol group×100% Statistical analysisData are expressed as the mean ± standard error of the mean (SEM). All statistical analysis were two-way ANOVA and post-test. Differences between two samples were evaluated using Student’s t-test. Significant differences are indicated with an asterisk (*), where *p < 0.05, **p < 0.01, and ***p < 0.001 are considered to represent statistically significant differences in mean values. Statistical analyses were conducted using IBM SPSS Statistics 26.
Results The ΔmcpC mutation results in a reduced stress defense capacityGenomic DNA from the strains C50336, ΔmcpC::cat, and ΔmcpC was used as templates for PCR identification with primers P3 and P4. The results (Figure 1A) showed bands at 1203 bp, 1,506 bp, and 489 bp, respectively, consistent with the expected sizes, indicating the successful knockout of the mcpC gene. Genomic DNA from the suspected complemented strain was used as a template, and primers P5 and P6 were employed for PCR identification. The results (Figure 1B) revealed a target band at approximately 1,572 bp, matching the expected size, confirming the successful construction of the mcpC complemented strain, designated as ΔmcpC + mcpC.
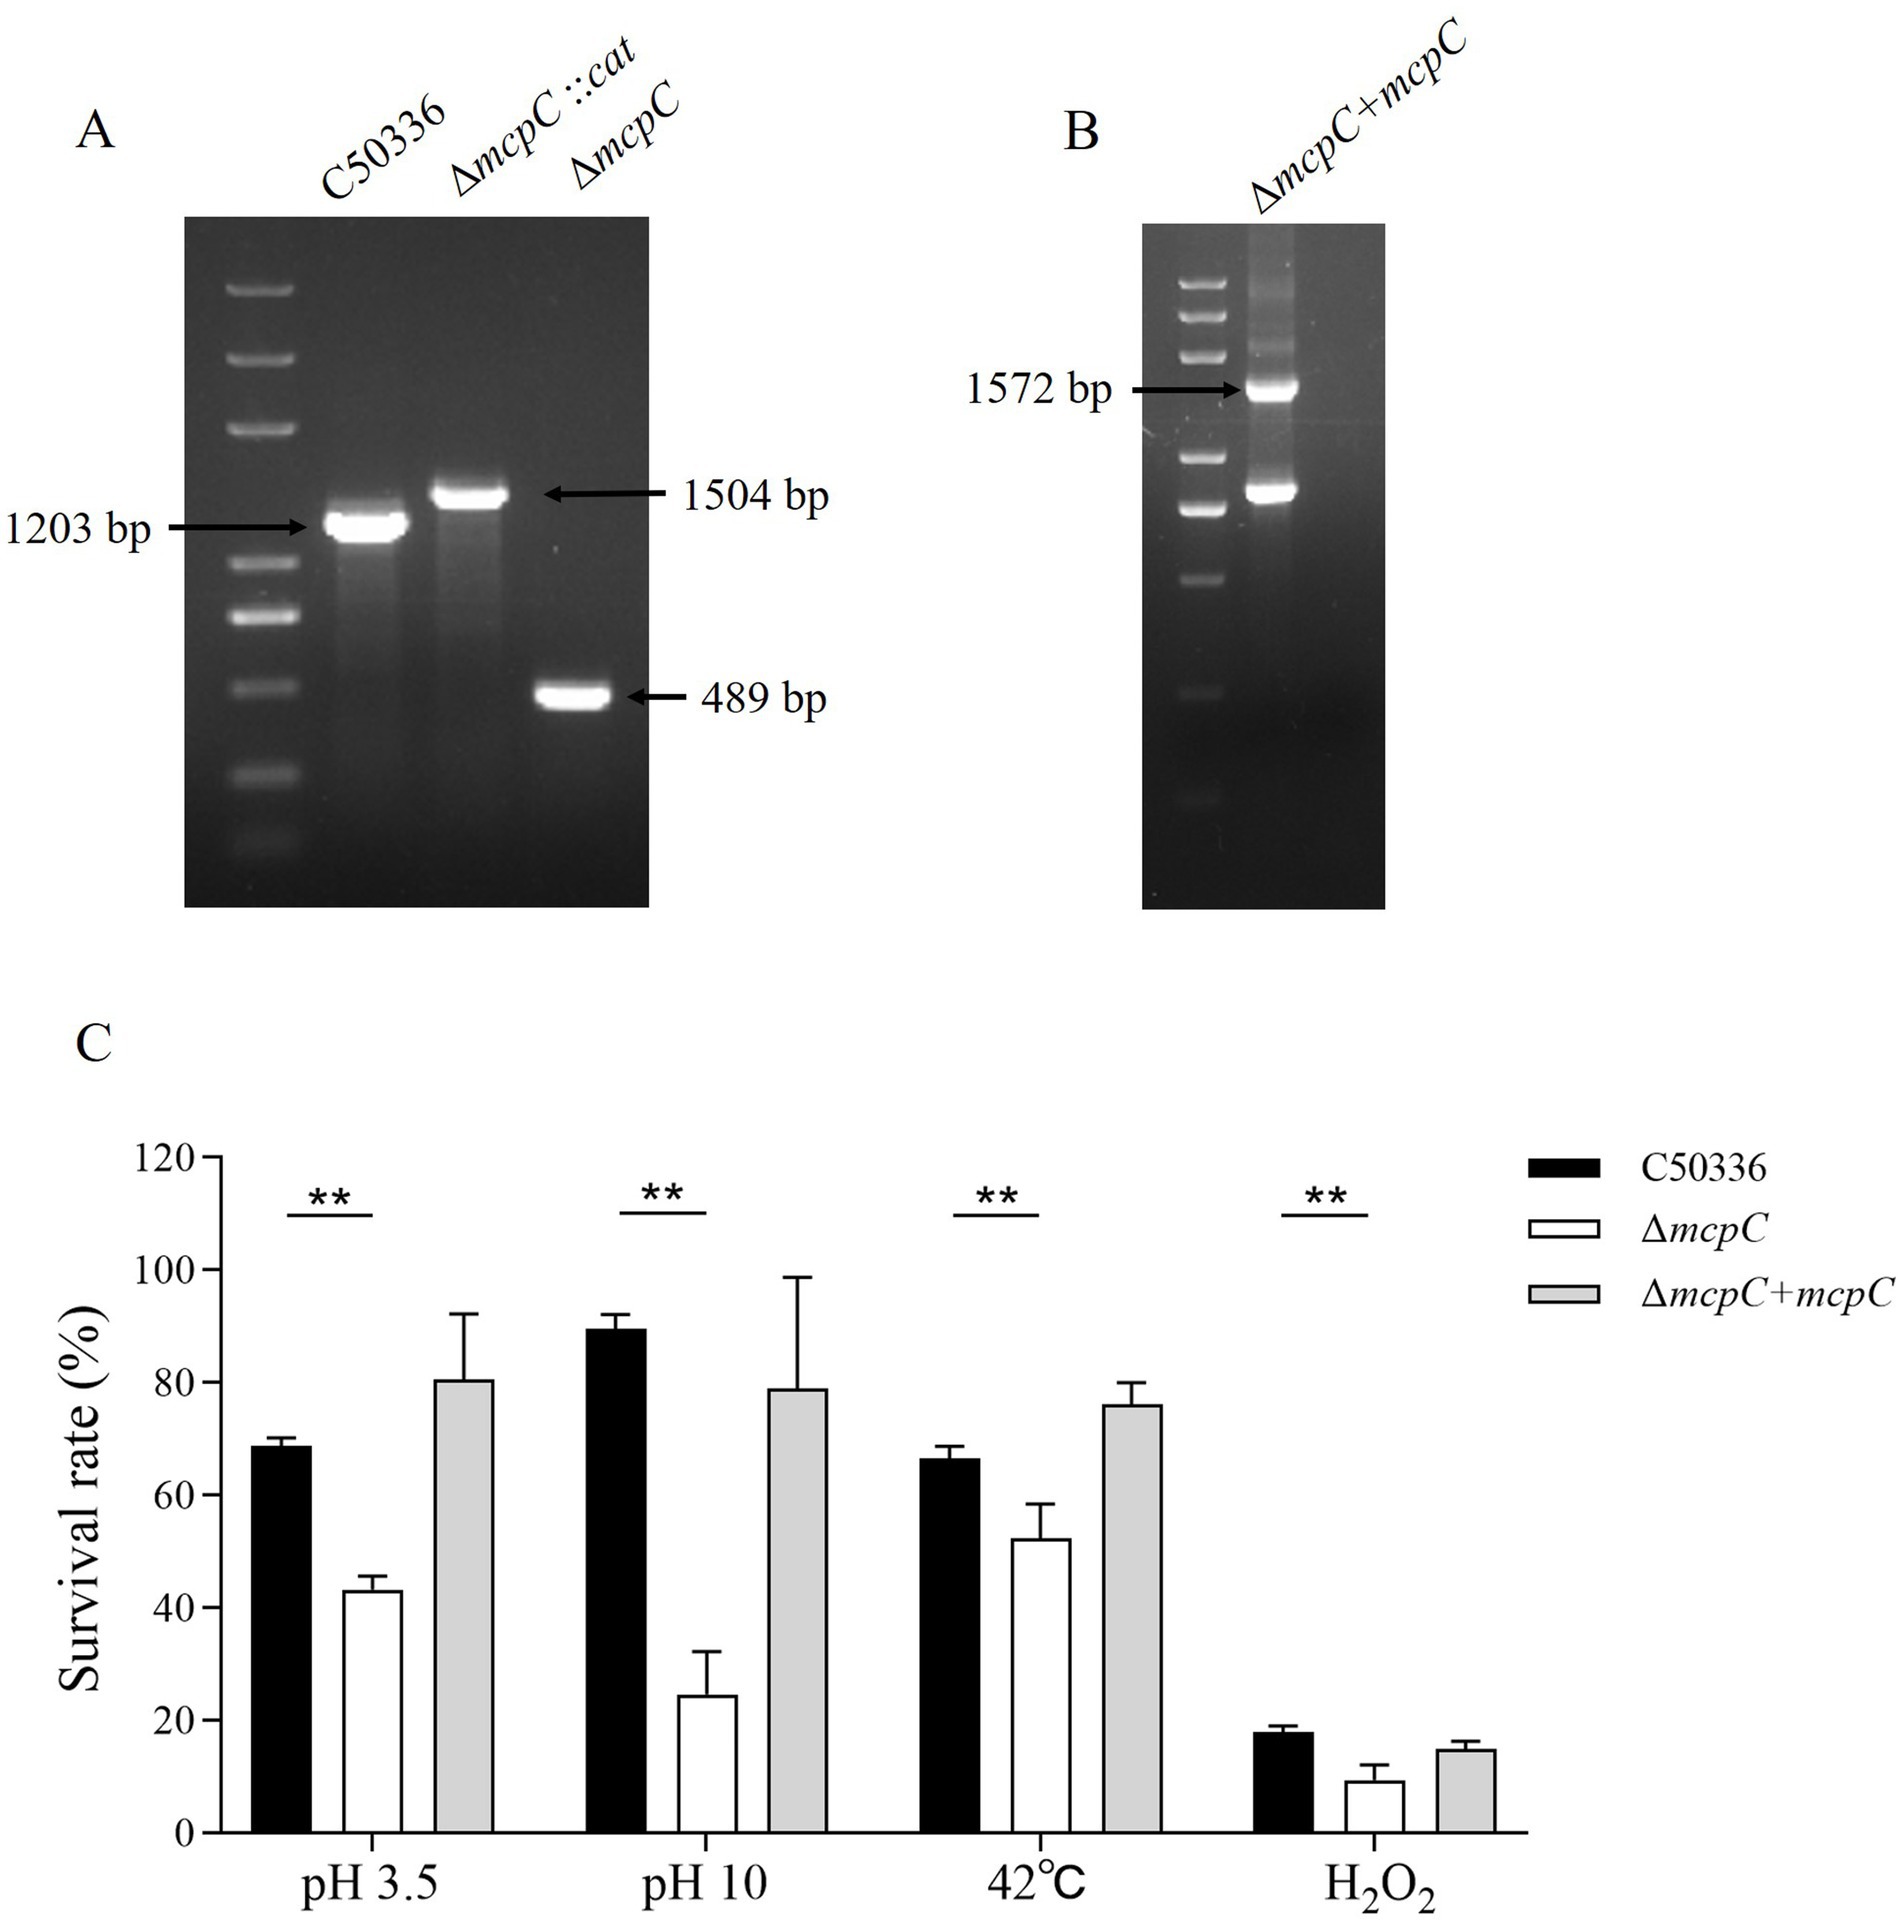
Figure 1. (A) PCR verification of the mcpC gene deletion strain. The PCR product of C50336 has a length of 1,203 bp, the product of ΔmcpC::cat has a length of 1,504 bp, the product of ΔmcpC has a length of 489 bp. (B) PCR verification of ΔmcpC + mcpC. The PCR product has a length of 1,572 bp. (C) The survival rate of C50336, ΔmcpC and ΔmcpC + mcpC under various environmental stresses. The data represents the average of 3 replicates.
To investigate whether the mcpC gene affects the resistance of SE to various environmental stresses, the survival rates of C50336 and ΔmcpC were compared under conditions of pH 3.5, pH 10, 42°C, and 10 mmol/L H₂O₂. The results showed that (Figure 1C), compared to C50336, the survival rate of ΔmcpC was significantly reduced under all tested conditions, indicating that the deletion of the mcpC gene weakens SE’s resistance to acid, alkaline, thermal, and oxidative stresses.
The mcpC gene does not affect biofilm formationand drug resistanceThe biofilm formation ability of strains C50336, ΔmcpC, and ΔmcpC + mcpC was evaluated. Tube assay results showed no significant differences in biofilm formation ability among the three strains (Figure 2A). Quantitative analysis using a 96-well plate assay also indicated no significant differences in biofilm formation among the strains (Figure 2B).
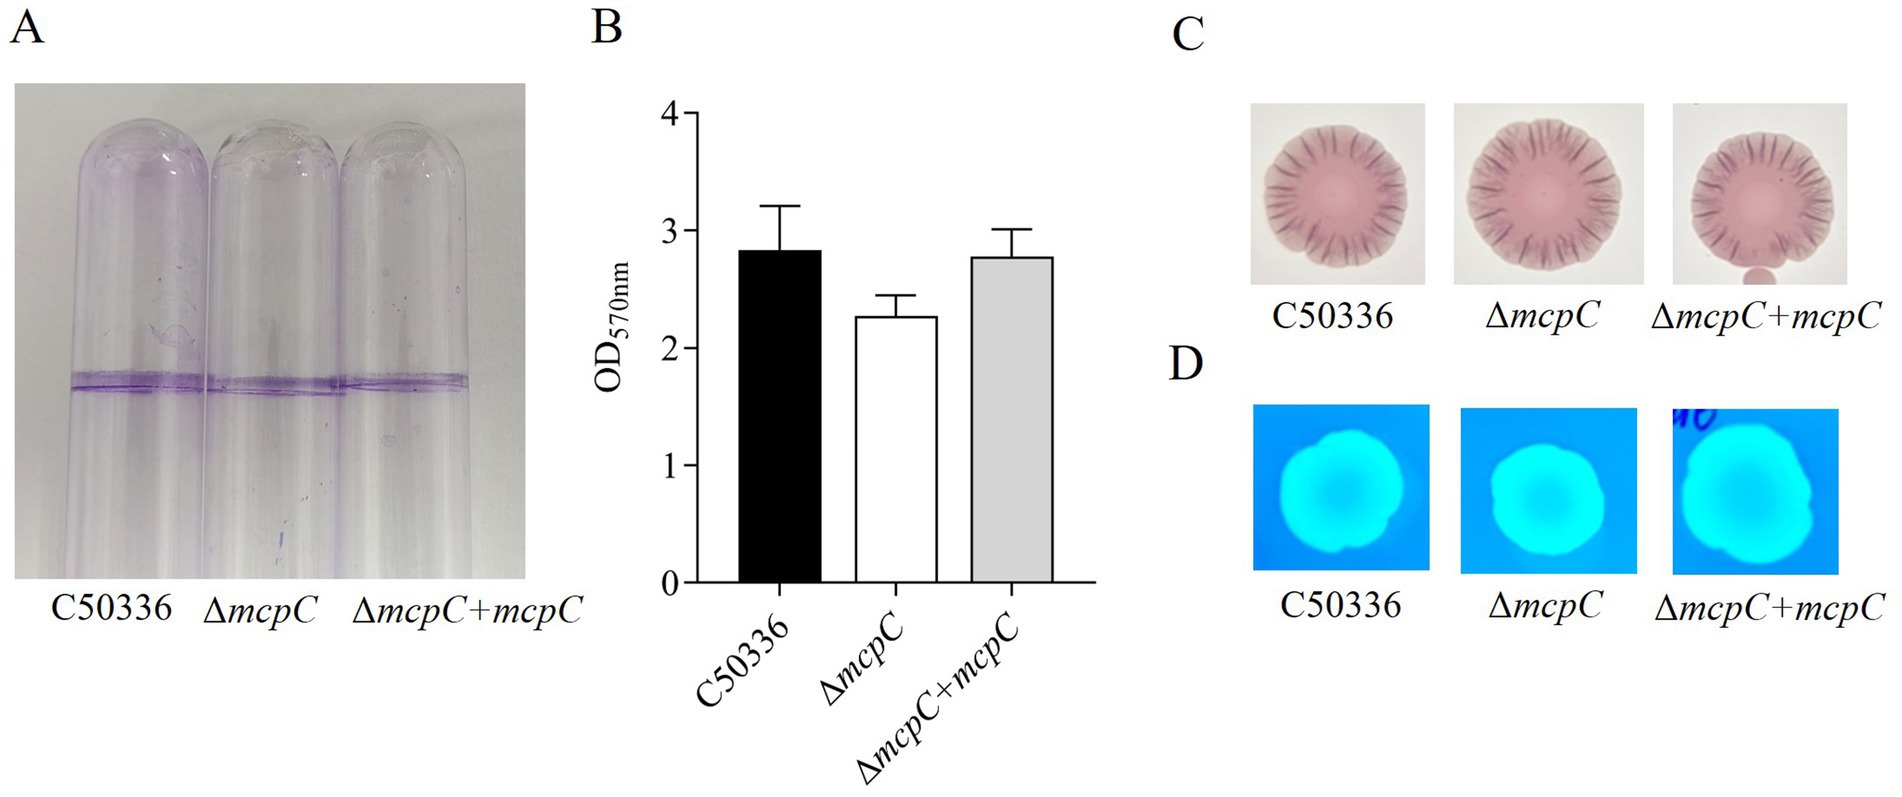
Figure 2. (A) Detection of biofilm formation in glass test tubes. (B) Qualitative detection of biofilm formation in microtiter plates, with absorbance measured at 570 nm. (C) Curli formation detection. (D) Cellulose formation detection.
Detection of curli fimbriae, a major component of biofilms, revealed that all three strains formed red, rough colonies (Figure 2C), indicating their ability to produce curli fimbriae. Cellulose production analysis showed that colonies of all three strains exhibited the same fluorescence intensity under UV light (Figure 2D), confirming their ability to produce cellulose. These findings demonstrate that the mcpC gene does not affect the biofilm formation ability of SE.
The ΔmcpC mutation results in motility reductionTo assess whether the deletion of the mcpC gene affects the motility of SE, motility assays were conducted. The results showed that the average migration diameter of the ΔmcpC strain (17.5 mm) was significantly smaller than that of the wild-type C50336 strain (25 mm) and the complemented strain ΔmcpC + mcpC (21 mm) (Figure 3). These findings indicate that the deletion of the mcpC gene impairs the motility of SE.
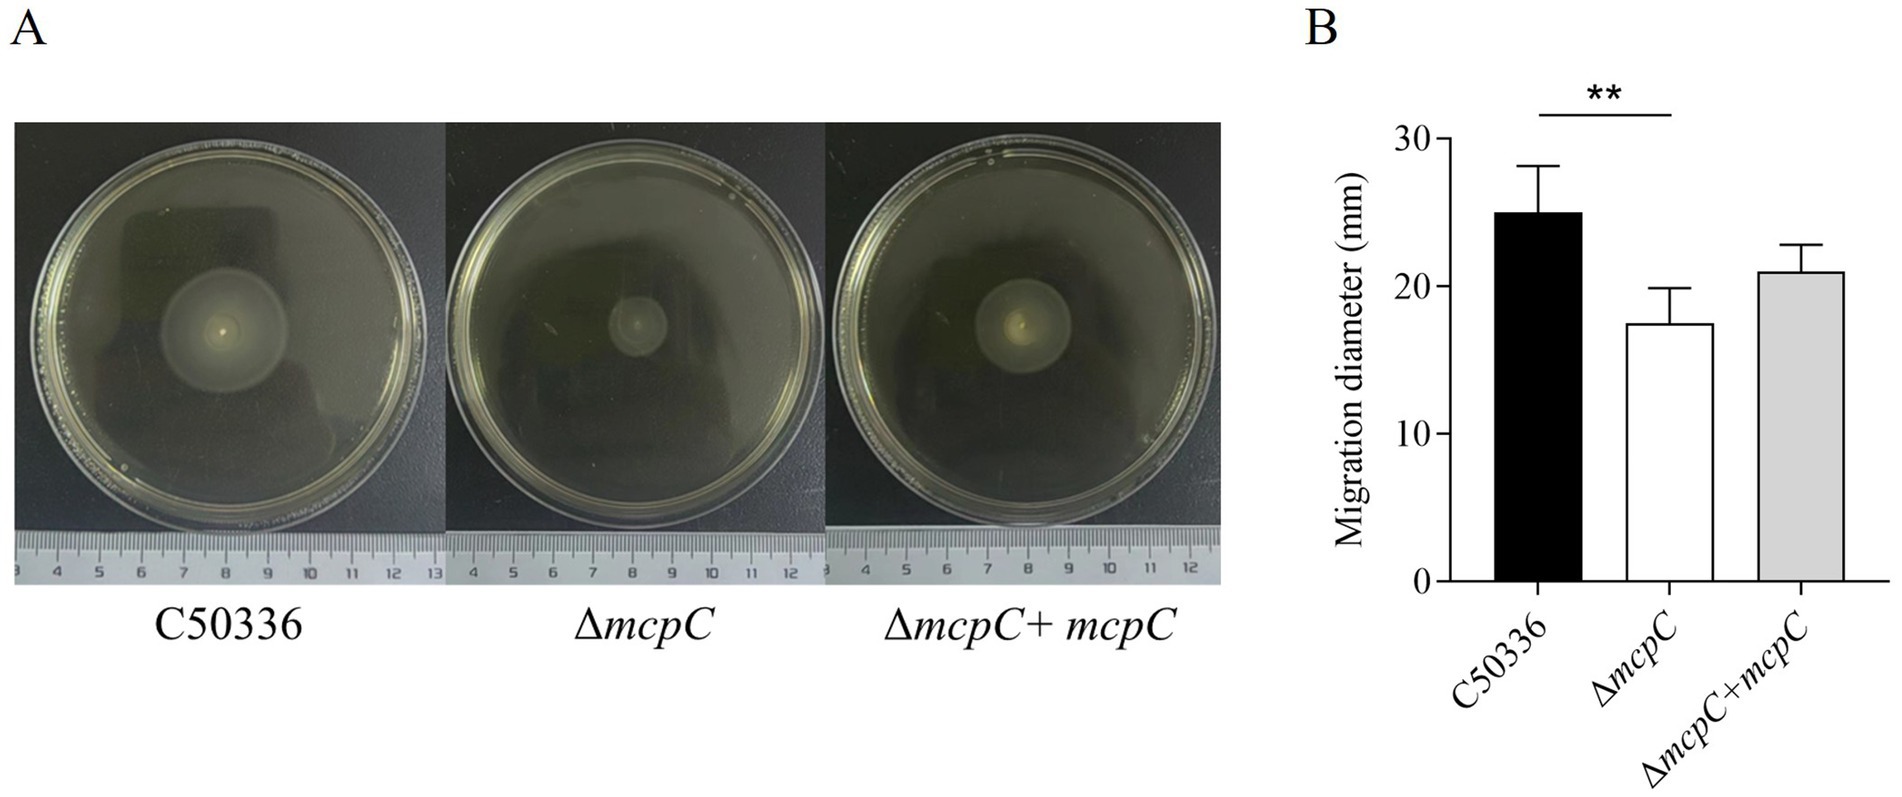
Figure 3. (A) The images shown are representatives of several independent assays. (B) The motility of the strains was evaluated on 0.3% agar plates, measured after 5 h of incubation. The data represents the average of 3 replicates.
Removal of mcpC weakens the invasion and intracellular survival of SEThe adhesion and invasion abilities of the ΔmcpC strain toward intestinal epithelial cells were assessed using human colorectal adenocarcinoma cells Caco-2. As shown in Figure 4A, the adhesion rate of ΔmcpC was comparable to that of the wild-type C50336 strain, but its invasion rate was significantly reduced.
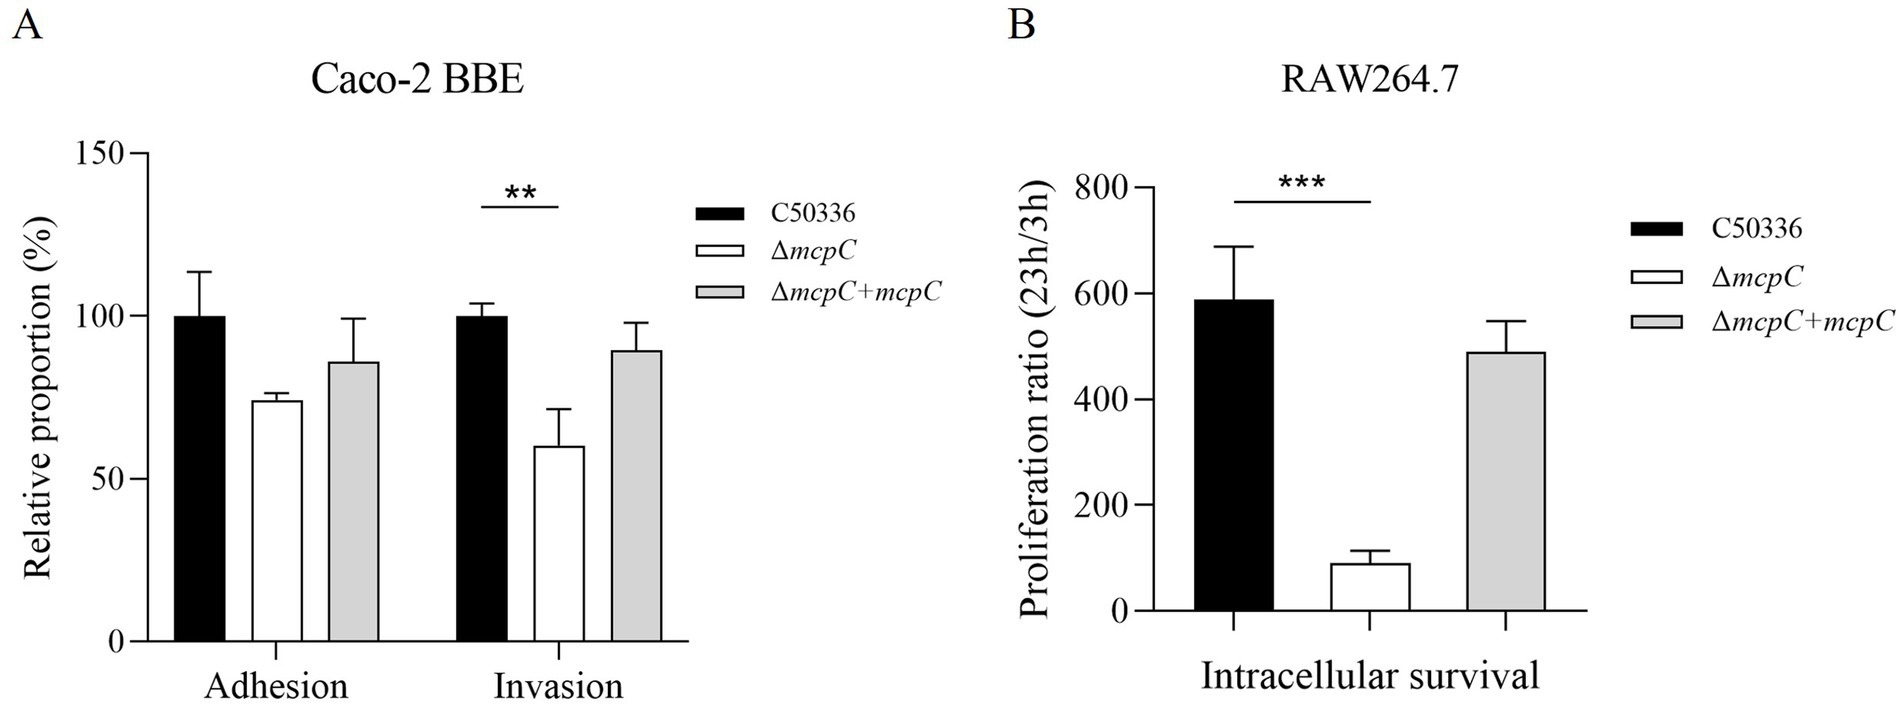
Figure 4. (A) Adhesion and invasion of bacteria in Caco-2 cells. (B) Intracellular survival in RAW264.7 cells. The results of the adhesion and invasion assays are presented as a ratio to the C50336 (the results of C50336 were considered as 100%). The data represents the average of 3 replicates.
The intracellular survival of ΔmcpC was evaluated using mouse-derived macrophages RAW264.7. The results revealed a significantly lower survival rate of ΔmcpC within macrophages compared to C50336 (Figure 4B). These findings indicate that the mcpC gene is critical for the invasion and intracellular survival capabilities of SE.
ΔmcpC exhibits increased LD50 in miceThe virulence of C50336 and ΔmcpC strains was evaluated in mice via i.p. injection. Mice infected with ΔmcpC began to die on day 2, whereas those infected with C50336 showed mortality starting on day 3. In contrast, the control group exhibited no mortality and maintained normal behavior, including smooth fur, good mental state, and an absence of symptoms such as shivering, hunching, eye crusting, or disheveled fur.
The calculated LD50 values (Table 5) were 6.3 × 10⁵ CFU/mouse for C50336 and 1.9 × 10⁷ CFU/mouse for ΔmcpC, with the LD50 of ΔmcpC being approximately 30 times higher than that of C50336 (1.9 × 10⁷/6.3 × 105 ≈ 30). The LD50 of the gene-complemented strain ΔmcpC + mcpC is 1.6 × 10⁶ CFU/mouse. The results suggest that the deletion of the mcpC gene significantly attenuates the virulence of SE.
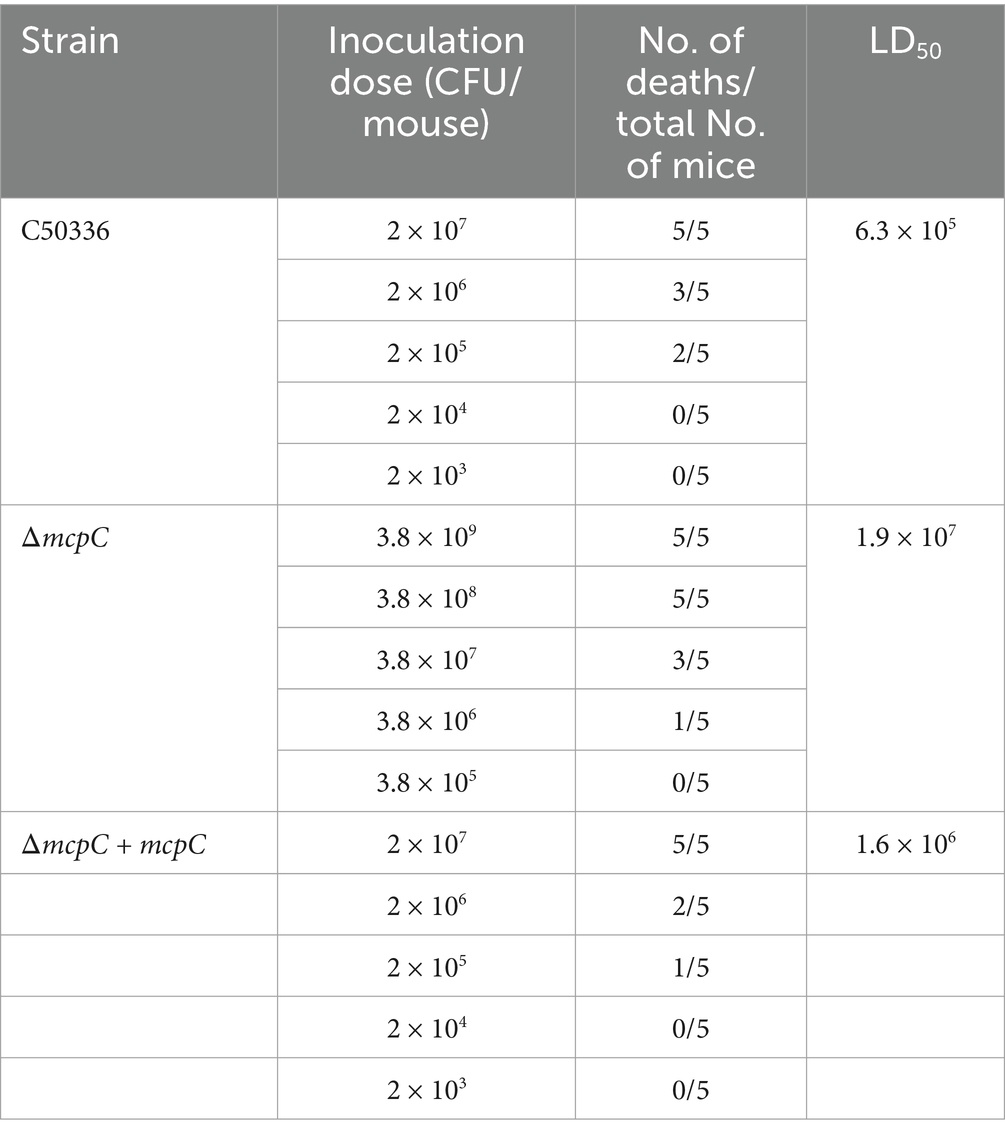
Table 5. LD50 of C50336, ΔmcpC and ΔmcpC + mcpC in KM mice.
Removal of mcpC results in a down-regulation of the multiple virulence gene expressionof in SETo investigate the mechanisms underlying the attenuated virulence of SE caused by the deletion of the mcpC gene, this study employed qPCR to examine the expression levels of various virulence genes. The results revealed that the deletion of mcpC significantly downregulated the expression of genes associated with bacterial motility (fimD), biofilm formation (csgA, csgD), cell membrane and cell wall integrity (hflK, lrp), the type III secretion system (T3SS) (sipA, sipB, pipB), adhesion and invasion (invH), intracellular survival (mgtC, sodC), and nucleic acid exonuclease/endonuclease activity (mrr1) (Figure 5). These findings suggest that mcpC may regulate the expression of multiple virulence genes, thereby contributing to the overall virulence of SE.
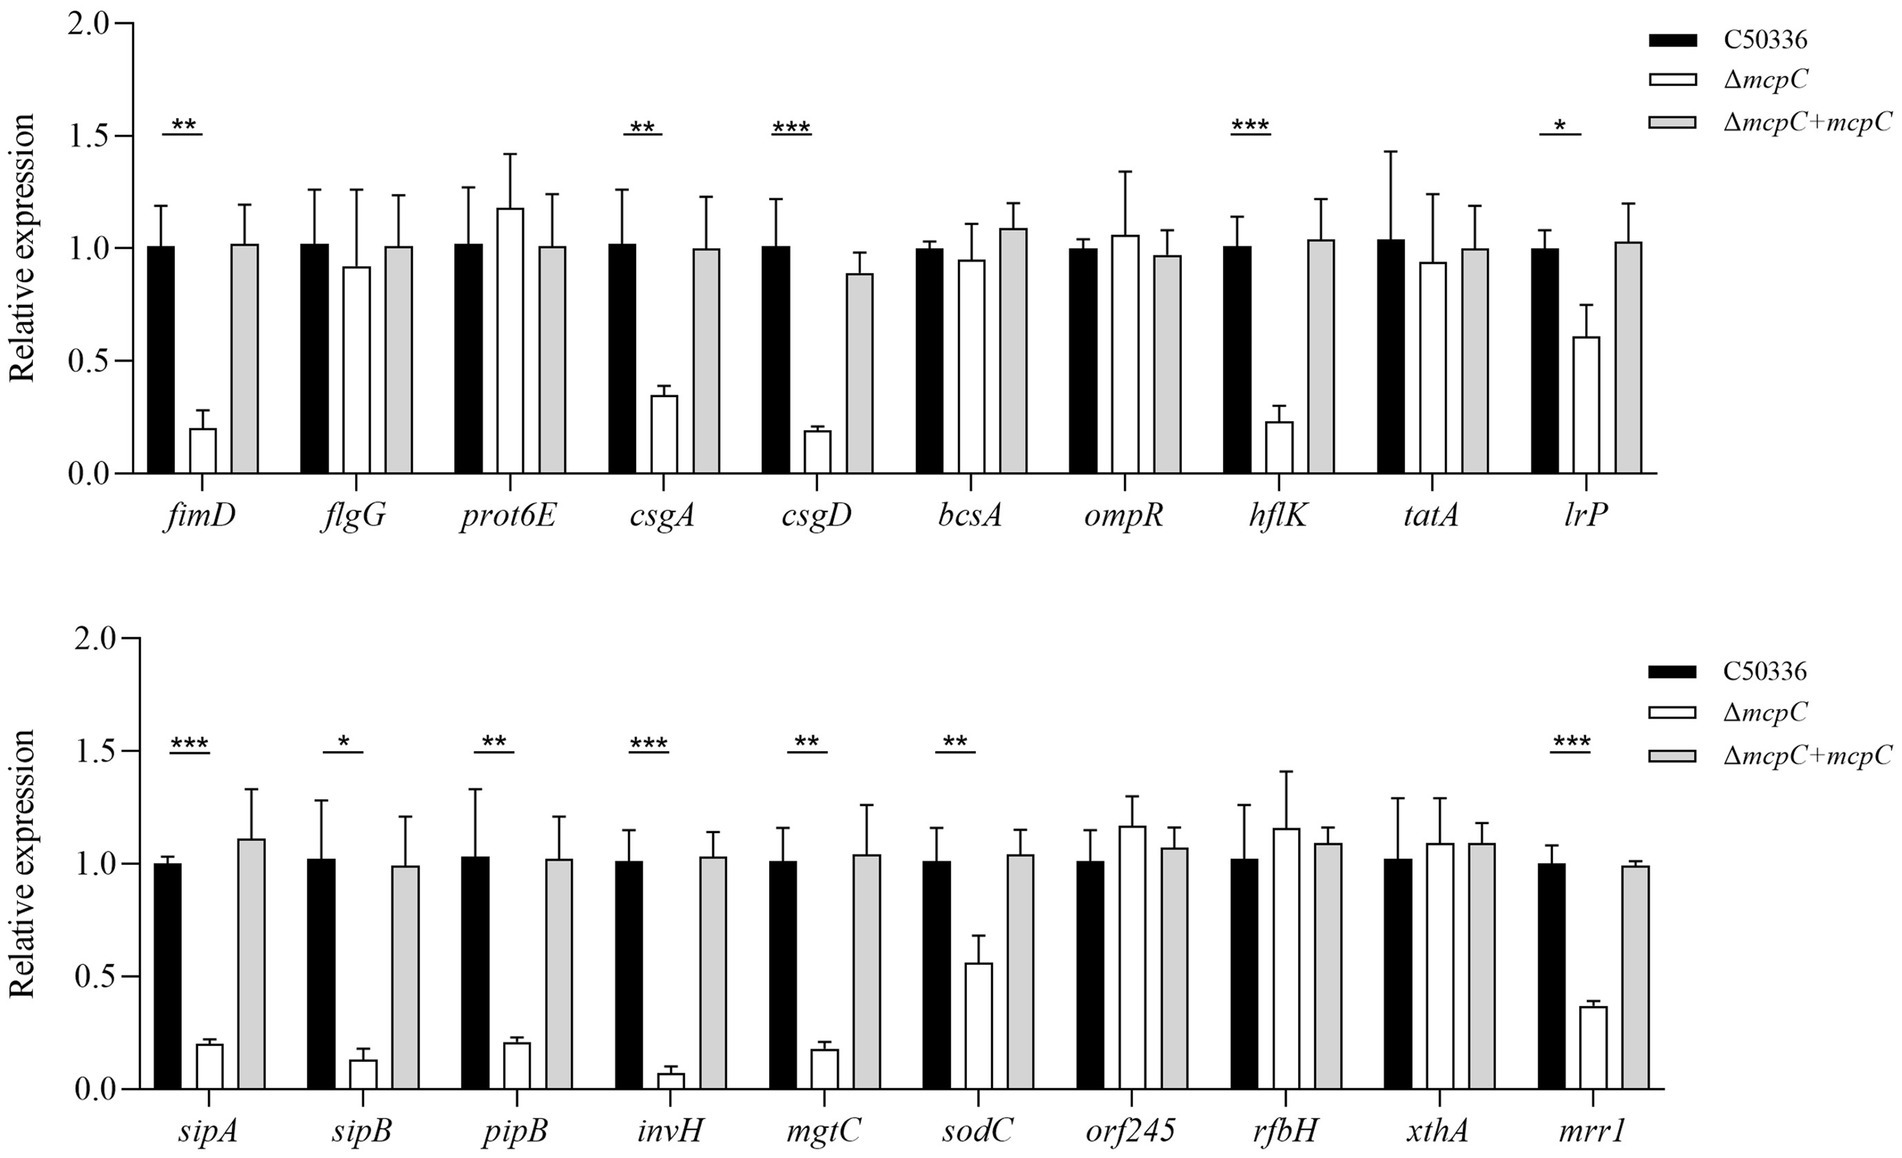
Figure 5. The expression levels of virulence genes in C50336, ΔmcpC and ΔmcpC + mcpC were detected by using qPCR, with 16S rRNA as the housekeeping gene. The data represents the average of 3 replicates.
Removal of mcpC results in reduced colonization and persistence of bacteria in the organOrgan bacterial load is another critical indicator of SE virulence. In this study, the bacterial loads in the liver, spleen, and cecum of mice infected with C50336 and ΔmcpC were assessed. After homogenization of the organs, bacterial counts were measured.
As shown in Figure 6, bacteria were isolated from the liver, spleen, and cecum on days 3, 7, and 14 post-infection. The colonization levels of both C50336 and ΔmcpC peaked on day 7 and subsequently declined. Notably, compared to C50336, ΔmcpC exhibited significantly lower bacterial loads in the liver, spleen, and cecum on day 3 and day 7; in the liver and cecum on day 14.
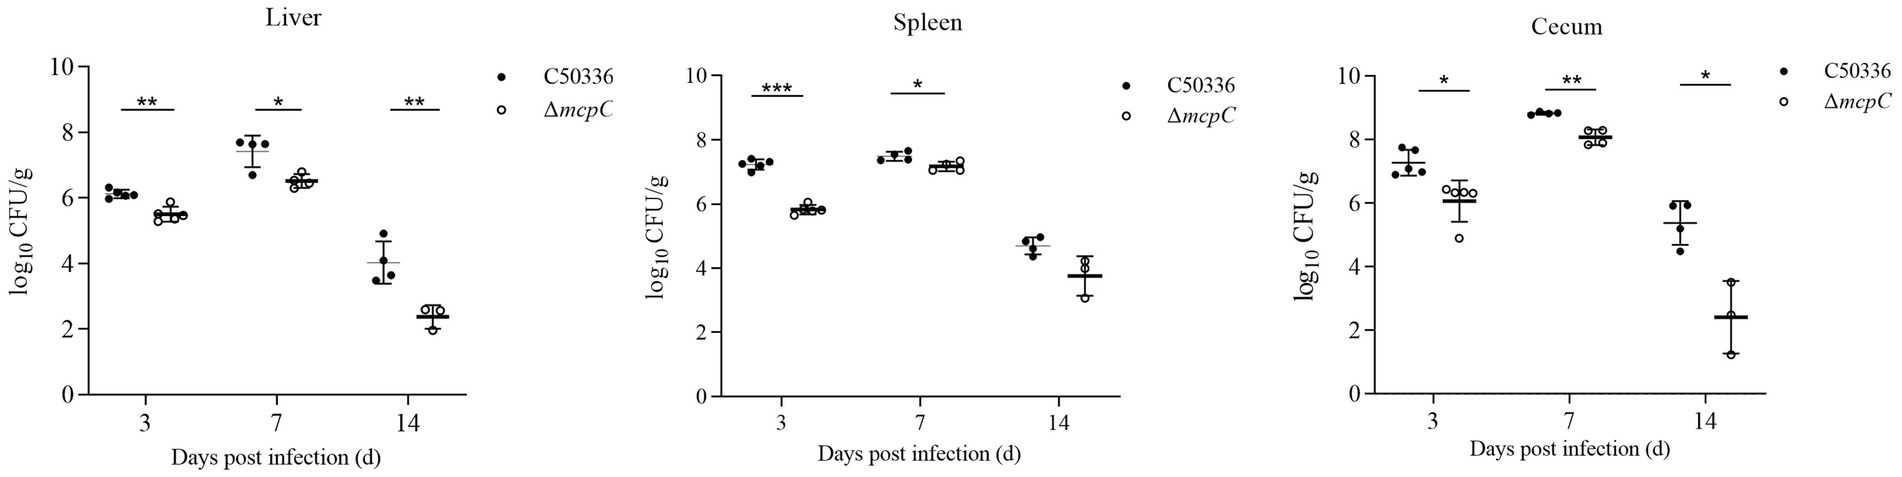
Figure 6. The colonization and persistence of C50336 and ΔmcpC colonization in liver, spleen and cecum after challenge. Values are represented as log10 CFU/g sample. Negative samples are shown as 0 CFU/g; all samples from the control group were negative.
These findings indicate that while ΔmcpC can still colonize organs, its colonization ability in certain organs is significantly reduced, suggesting that the deletion of the mcpC gene diminishes the organ bacterial load and virulence of SE.
ΔmcpC can induce mucosal, humoral, and cellular immune responsesTo evaluate the ability of ΔmcpC to induce specific humoral and mucosal immune responses, serum IgG and fecal SIgA levels were measured in immunized mice using indirect ELISA. The results showed that at 14 dpi and 28 dpi, mice immunized with ΔmcpC exhibited significantly higher serum IgG levels compared to the control group (Figure 7A). Additionally, elevated SIgA levels were detected in fecal samples (Figure 7B). Both serum IgG and fecal SIgA levels increased significantly following the second immunization compared to the first. These findings suggest that ΔmcpC effectively induces robust specific humoral and mucosal immune responses, which are enhanced with repeated immunizations.
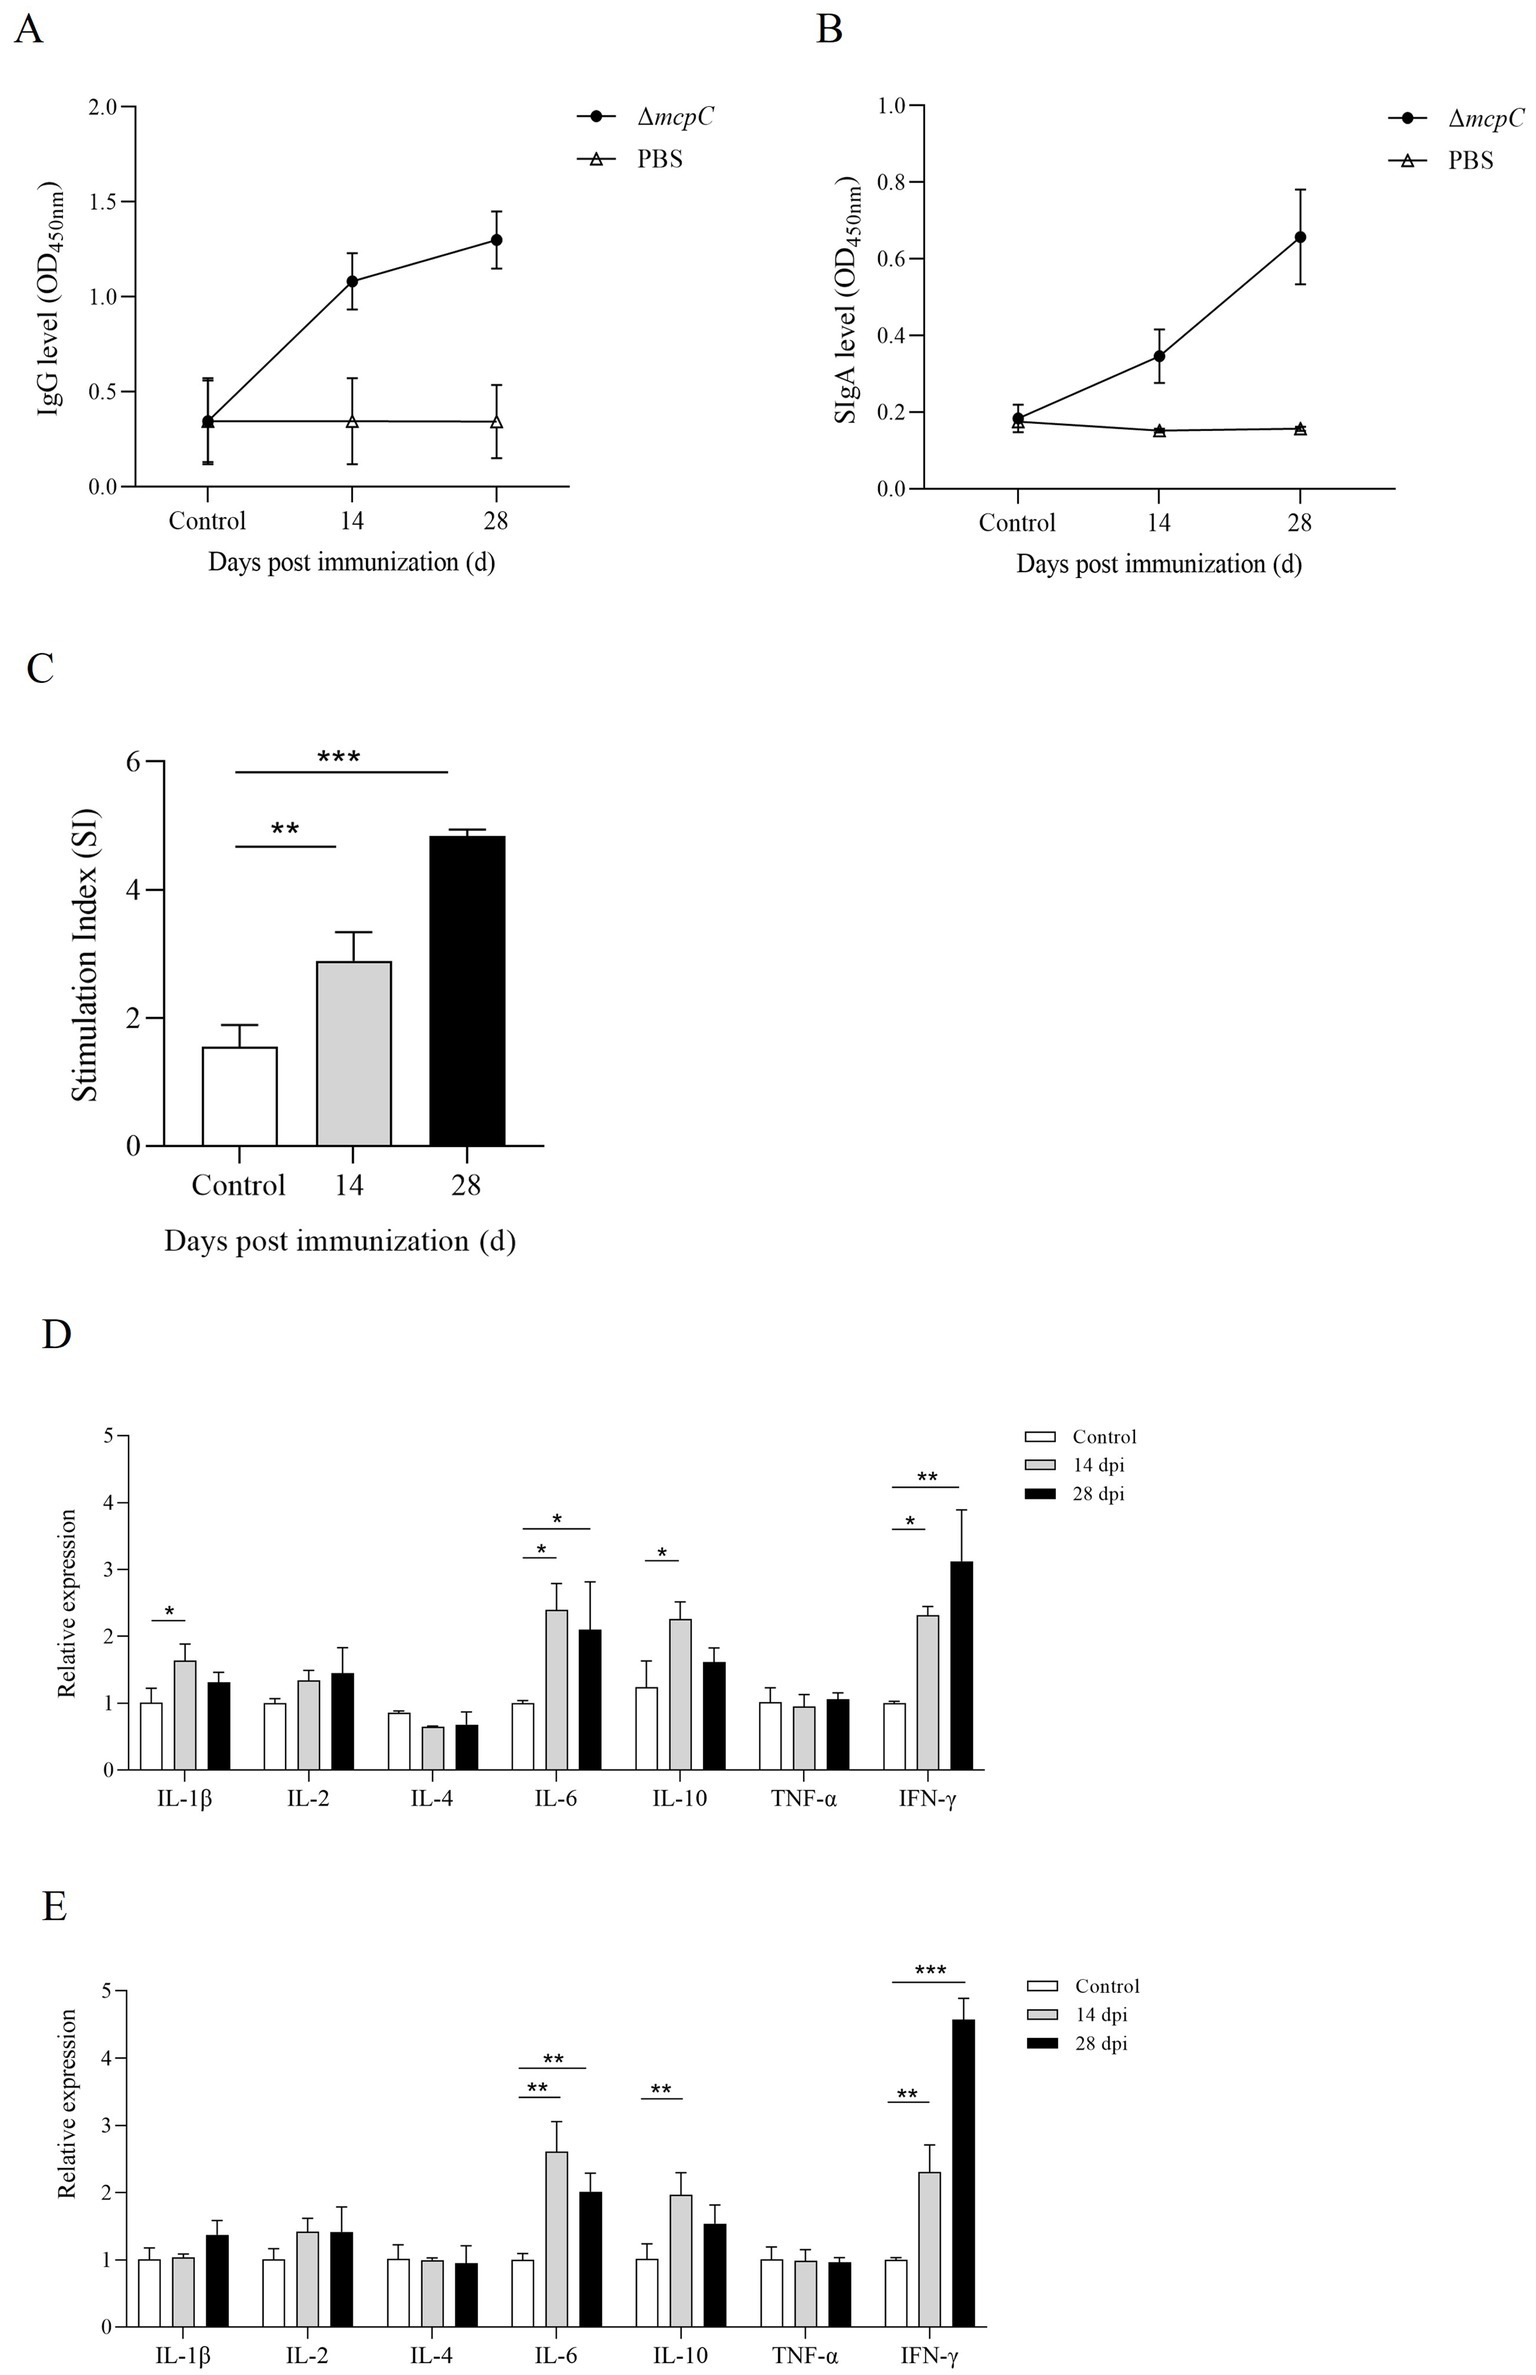
Figure 7. Production of Salmonella-specific antibodies in mouse sera and fecal. Levels of (A) IgG, (B) SIgA. (C) The lymphocyte proliferation was assessed at 14 dpi and 28 dpi using soluble antigen. At each time point, the mean stimulation index (SI) of the vaccinated group was significantly higher than that of the control group. (D,E) The expression level of cytokines IL-1β, IL-2, IL-4, IL-6, IL-10, TNF-α and IFN-γ. The internal control gene were gapdh and β-actin, respectively.
Lymphocyte proliferation assays are a primary method for evaluating cellular immune responses. In this study, a lymphocyte proliferation assay was conducted using C50336 antigens as stimulants. The results revealed that lymphocyte proliferation, measured by the stimulation index (SI), was significantly higher in mice immunized with ΔmcpC compared to the control group (Figure 7C). Moreover, after the booster immunization, lymphocyte proliferation levels further increased. These findings indicate that ΔmcpC induces a strong specific immune response, which is enhanced with repeated immunizations.
The expression of different cytokines reflects the strength and polarization of the immune response. At 14 dpi and 28 dpi, the expression levels of IL-1β, IL-2, IL-4, IL-6, IL-10, TNF-α, and IFN-γ were analyzed using qPCR. The results showed that (Figures 7D,E), compared to the control group, the expression levels of IL-6, IL-10, and IFN-γ significantly increased after the first immunization. Following the second immunization, IL-6 and IFN-γ expression levels further increased, although IL-6 remained similar to the levels observed after the first immunization, while IFN-γ continued to rise. These findings suggest that ΔmcpC effectively induces a strong immune response in mice.
ΔmcpC immunization provides powerful protective immune protection for miceTo further evaluate the protective immunity conferred by ΔmcpC, this study challenged immunized mice with a virulent strain via i.p. injection, recorded survival rates, and plotted survival curves. The results showed that mice in Group A (oral immunization with a dose of 2 × 10⁷ CFU/mouse) exhibited 100% survival with no deaths recorded. In Group B (oral immunization with a dose of 2 × 10⁶ CFU/mouse), partial mortality was observed. In contrast, all mice in Group C (non-immunized, challenged group) succumbed within 5 days, while mice in Group D (non-immunized, non-challenged control group) showed no mortality (Figure 8).
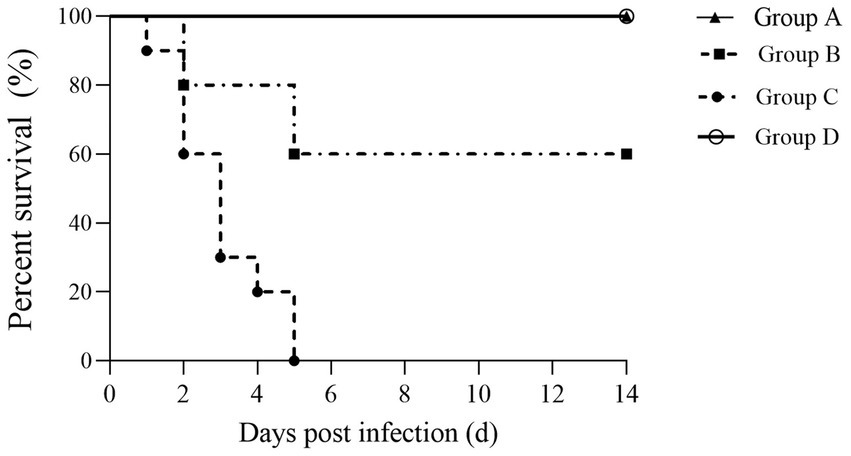
Figure 8. Survival curve. Female KM mice aged 6–8 weeks were p.o. inoculated with the ΔmcpC and i.p. injected with a lethal dose of C50336 at 28 dpi. The percent survival of mice was monitored daily.
The percentage survival of mice at 14 days post-challenge is summarized in Table 6. The results showed that Groups A and D achieved a relative survival rate of 100%, Group B exhibited a survival rate of 60%, while Group C had no survivors. These findings indicate that oral immunization with ΔmcpC offers robust protection against SE infection in mice.
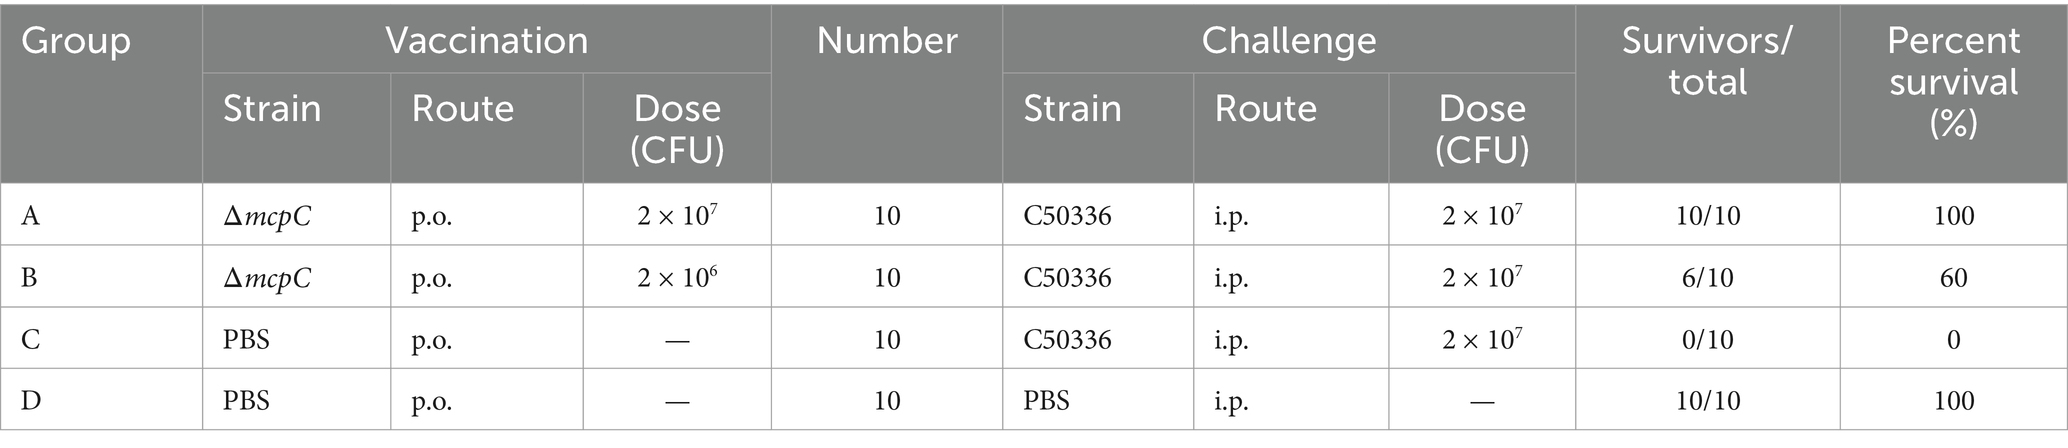
Table 6. Protective effects of ΔmcpC in mice.
留言 (0)