
記住我
Women of reproductive age (18–44) are at a greater risk for weight gain and obesity and experience disparities in obesity leading to health inequities (1–4). Women in this age group face unique obesity risks due to stresses such as pregnancy, parenthood, life transitions (e.g., leaving home, jobs, marriage), and social disadvantage (5–9). As of 2022, 33% of women aged 18–44 years old had obesity, with the age-adjusted prevalence of severe obesity (BMI > 30 kg/m^2) among adult women at 13%, double the rate for men (2, 10). Further, Black and Hispanic women age 20 and older experience higher rates of obesity at 57 and 44% respectively, compared to white women (40%) (1). These disparities are a result of systemic and historical racism that impact social determinants of health (SDOH) leading to higher social needs including chronic stress, unequal access to nutrient-dense foods and safe places to engage in physical activity, and fewer economic and social resources (3, 5, 11–16). High rates of obesity and disparities across race and ethnicity have health equity implications since obesity is associated with adverse health outcomes such as Type 2 diabetes mellitus, hypertension, dyslipidemia, coronary heart disease, chronic obstructive pulmonary disease, and poor pregnancy outcomes (17–20).
Healthy Eating and Active Living Taught at Home (HEALTH) is an effective, evidence-based intervention for obesity prevention among women of reproductive age (21). HEALTH embeds healthy eating and active living content adapted from the Diabetes Prevention Program into the Parents as Teachers (PAT) national home visiting organization, which has significant reach among women from pregnancy until the child is in kindergarten (22). Dissemination and implementation of HEALTH through The Healthy Eating and Active Living Taught at Home Dissemination and Implementation study (HEALTH D&I) holds promise for impacting the secular trends described above through the prevention of weight gain and promotion of weight loss (23). Examining data collected at baseline of the HEALTH D&I study provides a unique opportunity to explore factors associated with weight gain among women of reproductive age. In particular, the geographic, ethnic, and socioeconomic diversity of participants in the trial offers a unique opportunity to fill a gap in exploring these relationships in a group underrepresented in research.
To explore obesity risk factors within baseline data from HEALTH D&I, this analysis will utilize the socioecological model which represents the ecological theory of a particular health behavior or outcome (24). It demonstrates how several factors that interact at both macro- and micro-levels affect a person’s health and well-being (25). Socioecological theory is conceived in obesity research as being influenced by factors on the individual (e.g., genetics, health behaviors), interpersonal (e.g., parent–child relationship, family support), and neighborhood/community or environmental level (e.g., food availability, safe places to engage in physical activity) (26). The socioecological model aids in considering health equity when exploring obesity risk factors within this population. It underscores multiple levels of influence on obesity risk and the importance of looking at drivers of obesity risk beyond the individual level. Therefore, this secondary analysis of baseline data aims to explore factors across ecological levels (individual, interpersonal, environmental) associated with obesity among this population of women underrepresented in research.
2 Materials and methods 2.1 Study designThis study is a secondary cross-sectional analysis of baseline data from the HEALTH D&I study. A detailed description of HEALTH D&I methods can be accessed through the protocol paper (23). This study uses baseline data collected by research staff from a survey administered by telephone (during COVID) and on an iPad and in person (before COVID). Baseline data was collected from March 2019 to June 2022. Data collected in the survey ranged from demographic information, cardiometabolic health, health behaviors, food, and home environment, to social needs. The study was approved by the Washington University in St. Louis institutional review board.
2.2 Measures 2.2.1 Dependent variableThe main outcome measure in this study was a binary measure of overweight (reference) compared to obese. Obesity was measured using self-reported height, and weight measured on an electric scale to calculate body mass index (BMI). Weight was measured in person before COVID and over video call or phone with photos of the scale during COVID. BMI measures excess weight by calculating the weight in kilograms over height in meters squared (27). Based on BMI cut points, participants with BMI ranging from 25 kg/m^2 to 29.9 kg/m^2 were considered to be in the overweight BMI category and participants with BMI 30 kg/m^2 or more were considered to be in the obesity BMI category (27). Inclusion criteria for HEALTH D&I was BMI between 25 and 45.
2.2.2 Independent variablesThe independent variables in this study were chosen based on empirical research (e.g., systematic reviews) (3, 6, 17) around correlates of obesity and guided by the levels of the Socioecological model (individual, interpersonal, environmental). (Figure 1).
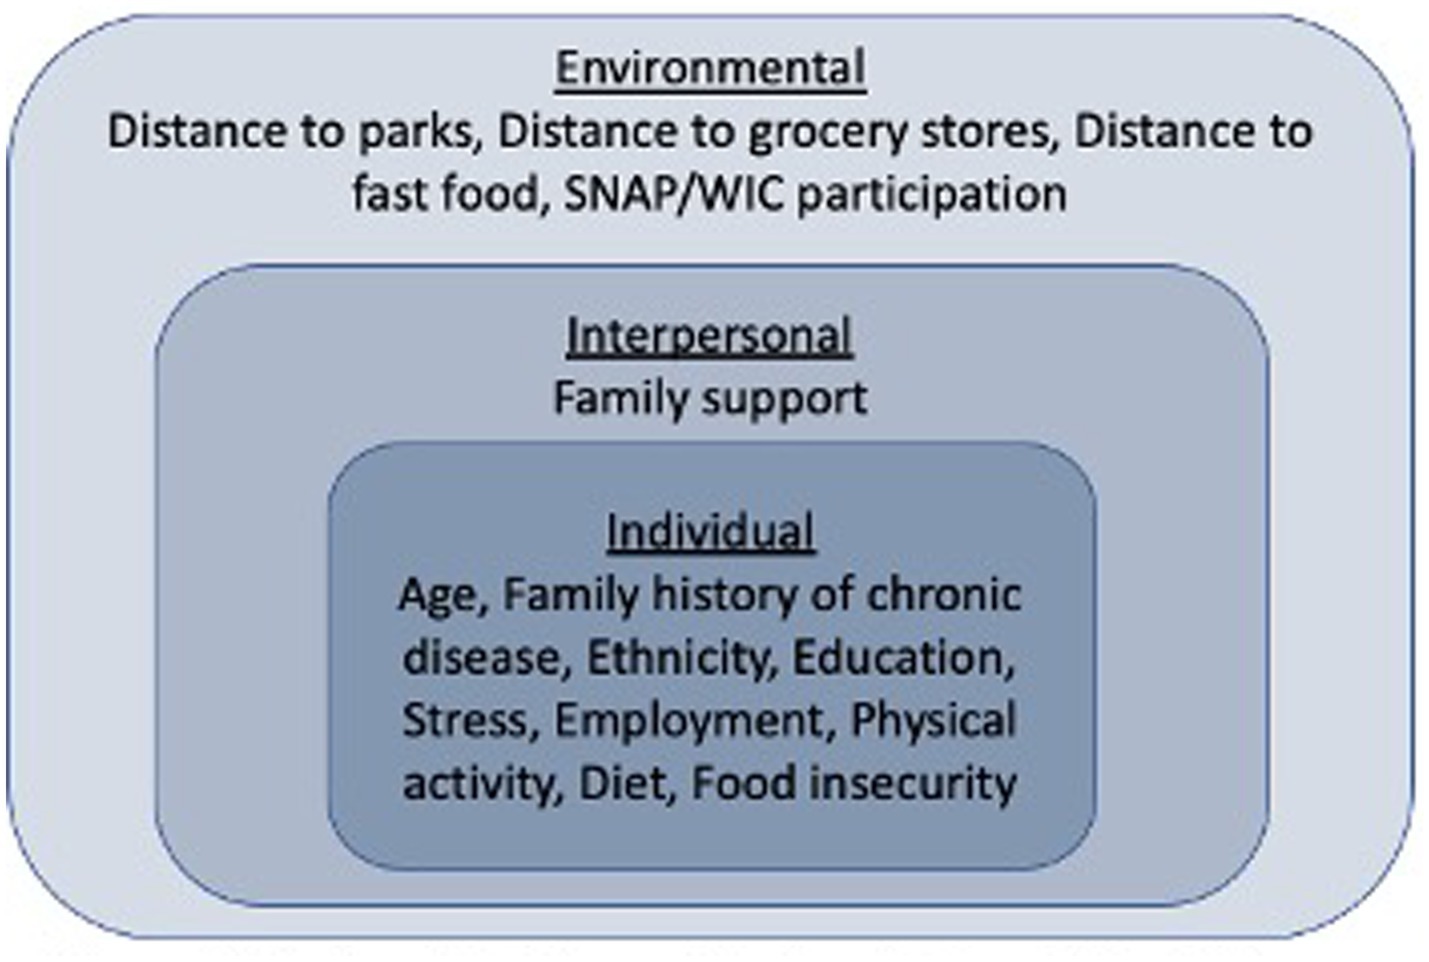
Figure 1. Socioecological model of predictors of obesity in women of reproductive age.
Individual level measures included age as a continuous variable (18–45), family history of chronic disease (Yes, No/Not sure), ethnicity (Hispanic/Latino, Not Hispanic or Latino), education (High school graduate or less, Some college more), stress (High, Low), employment (Employed, Not employed), physical activity (High/Moderate, Low), dietary habits as continuous variables (Ounces of whole grains a day, Teaspoons of added sugar a day, Cups of fruits and vegetables a day), and food insecurity (Food insecure, Food secure). Family history of chronic disease was based on whether participants reported a family history of diabetes, heart disease, or high blood pressure. Stress was measured using the perceived stress scale-4 (PSS-4) (28). The PSS-4 is the shortest version of the perceived stress scale, supporting use in surveys for minimizing respondent burden. This measure is widely used and though not as sensitive as the longer versions, has adequate reliability and strong criterion and construct validity (29–34). Cronbach’s alpha was 0.71. No cut points are indicated for high and low stress so the mean was used to dichotomize stress into a binary variable. Physical activity was measured using the International Physical Activity Questionnaire (IPAQ) (35). The IPAQ has been shown to have moderately high reliability and validity across diverse settings and populations (35–37). Additionally, the IPAQ has similar validity to other self-report measures (35). High physical activity represents an hour or more of activity a day that is at least of moderate intensity. Moderate physical activity is around half an hour of moderate physical activity most days. Low physical activity means the participant did not meet criteria for moderate or high physical activity (35). For analysis, physical activity was dichotomized into high/moderate and low. Dietary habits were measured using the National Health and Nutrition Examination Survey Dietary Screener Questionnaire (DSQ) which assess frequency of food (e.g., fruits, vegetables, whole grains, added sugar) and drink (e.g., sugar sweetened beverages) intake in the previous month (38). The DSQ has been widely tested and shows good validity when compared to other food recall measures (39–44). Food insecurity was measured using a two-item food insecurity measure developed by the United States Department of Agriculture Economic Research Service (45). The items have been tested for validity and reliability and are shown to accurately identify food insecurity (45–48). Survey items ask participants to indicate if in the last 12 months it was often true, sometimes true, or never true that “We worried whether food would run out before we got money to buy more” and “The food we bought just did not last, and we did not have money to get more.” (49) If participants answered “often” or “sometimes true” to both questions, they were considered food insecure.
The interpersonal level measure was family support as measured by the family support scale in the Home Environment Questionnaire (α = 0.63) (50). The family support measure was initially developed by Sallis et al. and has been used in the Home Environment Questionnaire with good validity and reliability for measuring social support specific to health behaviors (51–54). An example of family support questions include, in the last month how often did people living in your household do the following; encourage you to avoid unhealthy foods, discuss your eating habits with you, remind you to eat fruit and vegetables, and bring home foods you are trying to avoid. Participants responded with never/rarely, occasionally, often, or very often. The mean of all questions combined was used to create a continuous score, with higher scores indicating higher family support.
Environment level measures included walking distance (20 min or less, More than 20 min) to the nearest fast food, grocery store, and park, and participation in the Supplemental Nutrition Assistance Program (SNAP) and/or the Special Supplemental Nutrition Program for Women, Infants, and Children (WIC) (Yes, No/not sure).
2.3 AnalysisFor the analysis, descriptive statistics were calculated for the outcome variable of BMI, and all independent variables for the total sample and for both BMI categories (overweight and obese). T-tests and Chi-squared tests were used to determine whether relationships between each independent variable and the outcome of BMI were significant. Variables that were significantly correlated with BMI, were included in a multivariate logistic regression model to determine the association of these variables with BMI. All quantitative analyses use Stata Version 17.
3 ResultsIn the analytic sample (n = 221), 37% of participants were overweight and 63% had obesity. (Table 1) The mean age was 31 (SD = 5.72) years old. Almost half of the sample (43%) identified as Hispanic or Latino and most (81%) reported a family history of chronic disease. Fifty-one percent of participants had a high school degree or less and 57% were not employed. Half of participants (50%) had low levels of physical activity, 43% had high stress, and 38% reported food insecurity. The mean predicted daily intake of added sugars was 18.4 (SD = 9.73) teaspoons, while the mean intake of whole grains was 0.58 (SD = 0.31) ounces, and mean intake of fruit and vegetables was 2.42 (SD = 0.65) cups. At the interpersonal level, mean score of family support was 1.72 (SD = 0.51). In terms of the environmental level variables, 52% of participants were within 20 min walking distance to the nearest fast-food outlet, while 58% had to walk more than 20 min to get to the nearest grocery store. The nearest park was more than a 20-min walk for 33% of participants. In total, 78% of participants participated in WIC and/or SNAP.
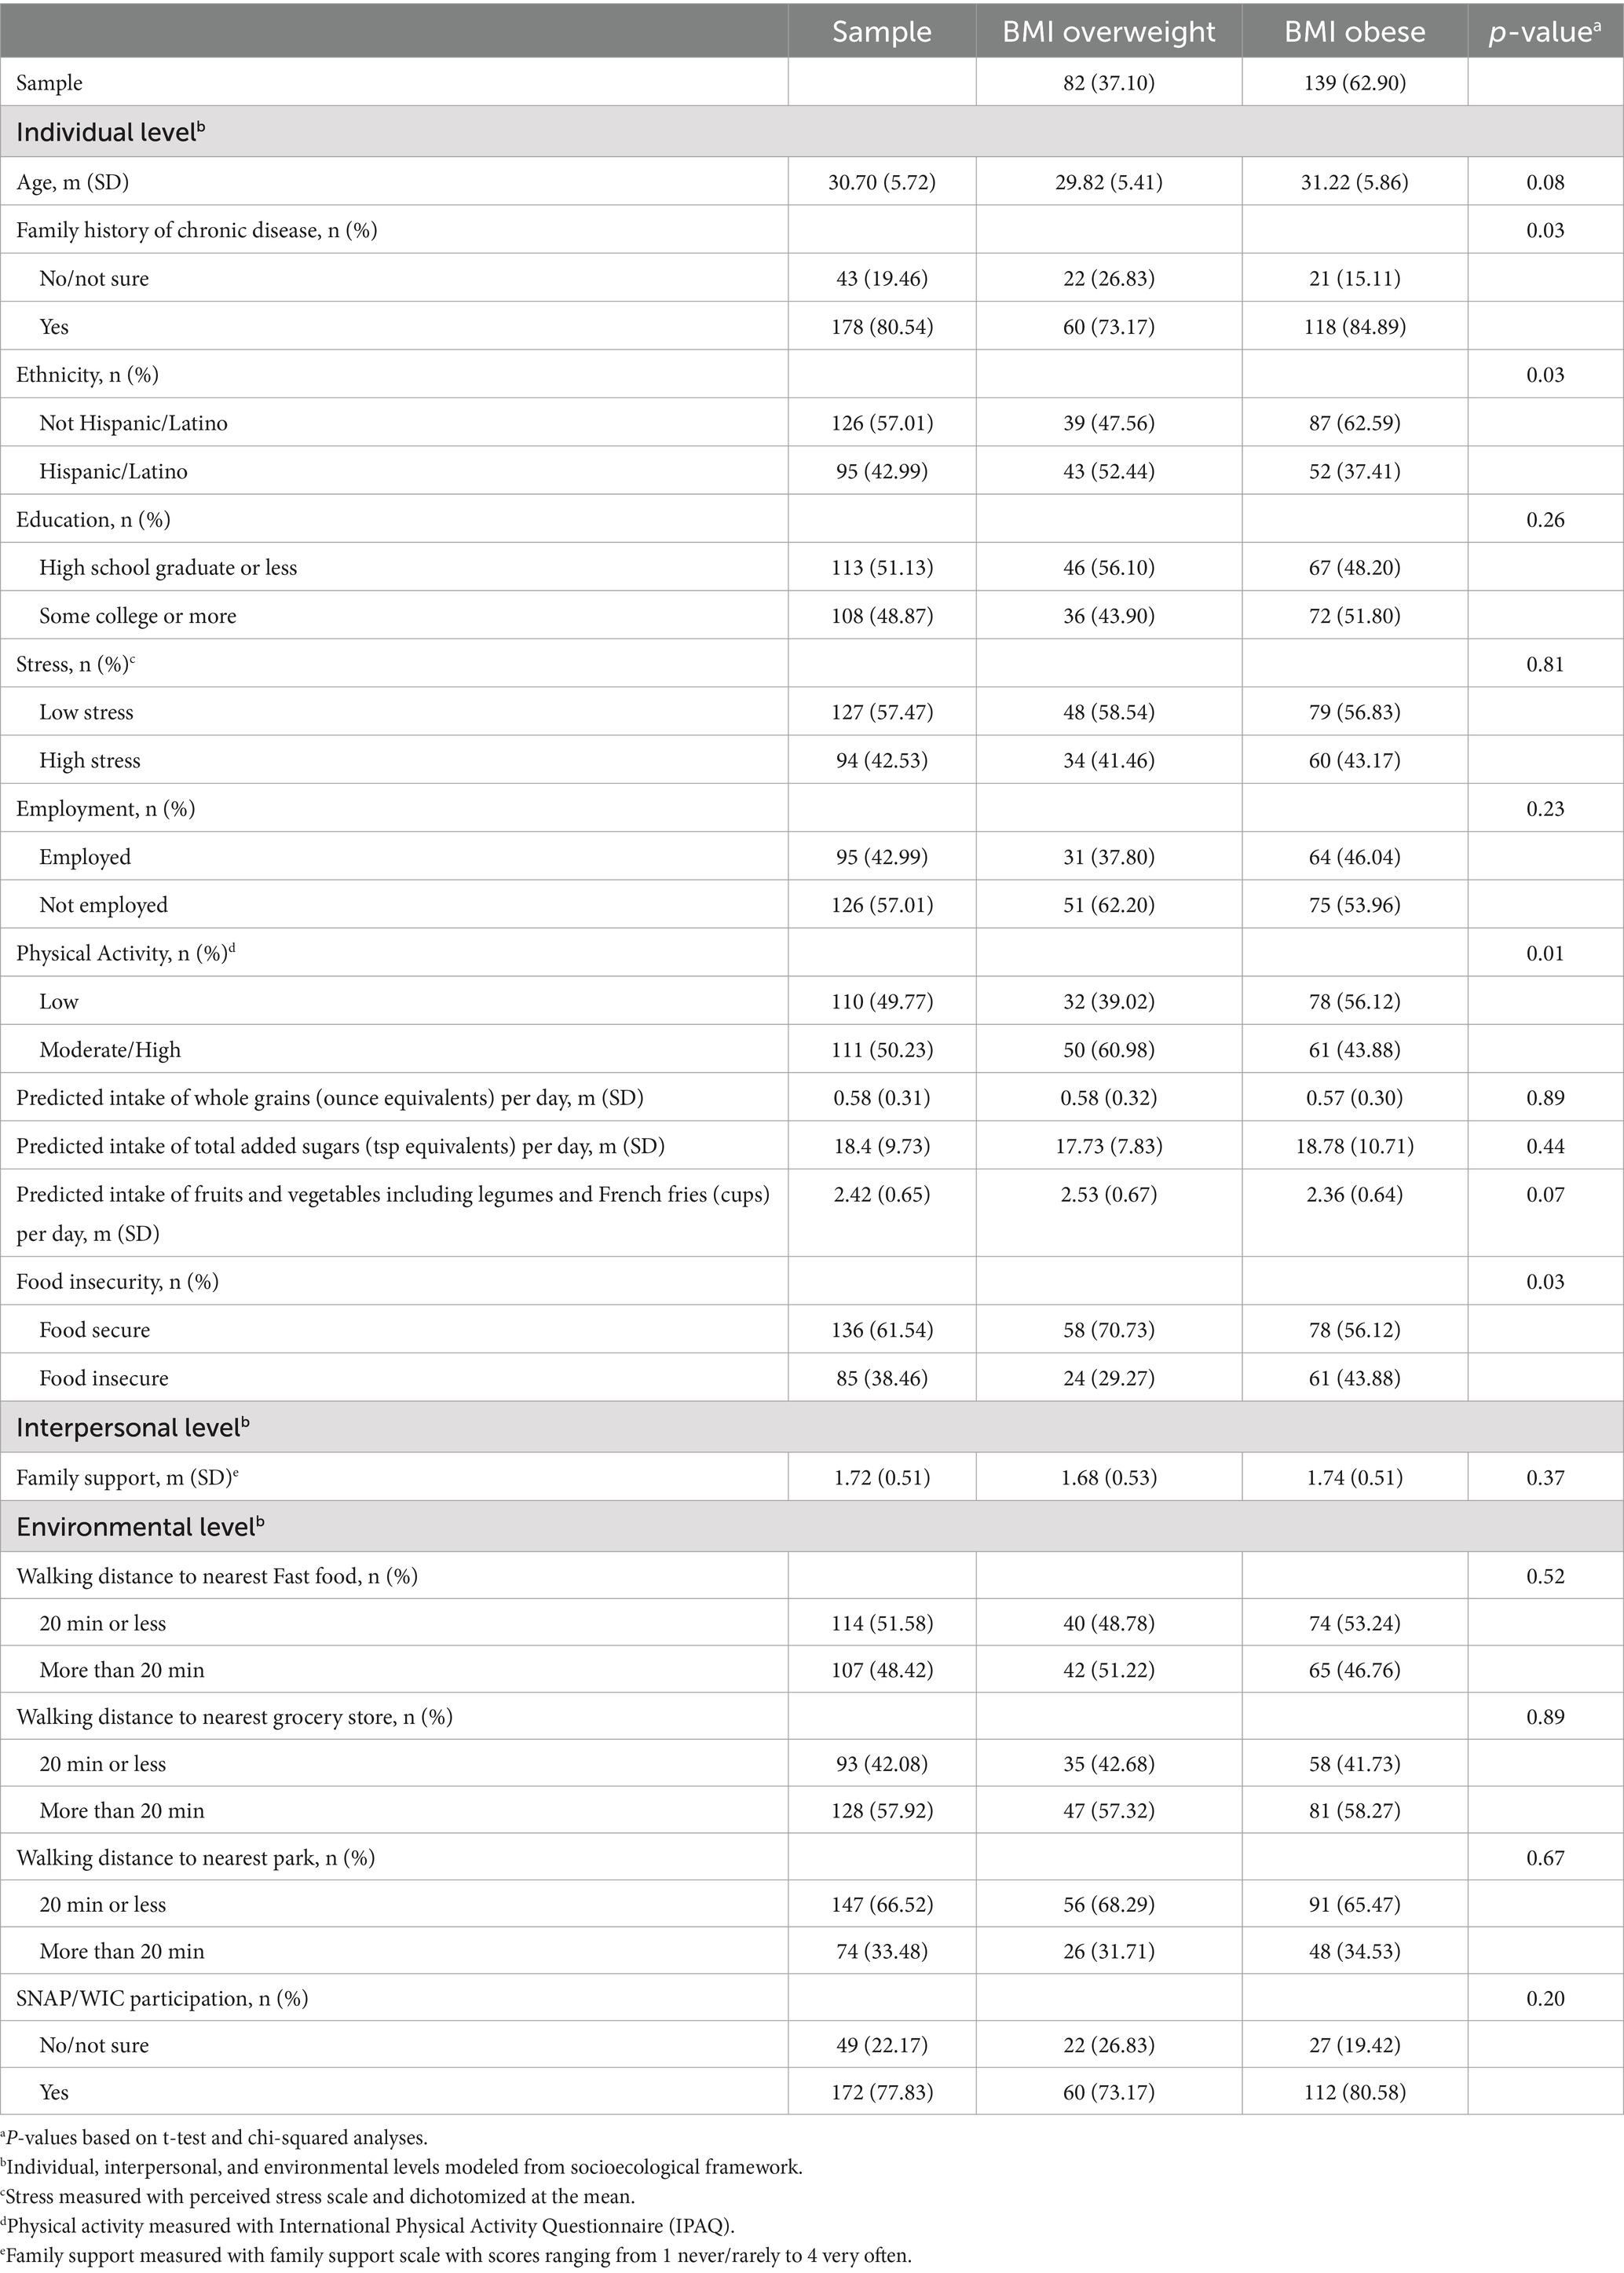
Table 1. Descriptive table of sample characteristics (n = 221).
Table 1 indicates results from bivariate analyses of each independent variable with the outcome of BMI category (likelihood of overweight or obesity). At the individual level, family history of chronic disease (x2(1) = 4.52, p = 0.03), ethnicity (x2(1) = 4.75, p = 0.03), physical activity (x2(1) = 6.03, p = 0.01), and food insecurity (x2(1) = 4.66, p = 0.03) were significantly associated with BMI category (27). None of the variables at the interpersonal or environmental levels were significantly associated with BMI.
The multivariate logistic regression model consisted of all four variables with significant associations in the bivariate analysis (family history of chronic disease, ethnicity, physical activity, and food insecurity); these were all four at the individual level (Table 2). This final model accounted for 7% (adjusted R(2) = 0.07) of variability in the odds of being in one BMI category or another. Family history of chronic disease and ethnicity were no longer statistically significantly associated with BMI category. Participants with high/moderate physical activity were 53% less likely to have obesity (OR = 0.47, 95% CI: 0.26,0.84, p = 0.01) than be overweight compared to participants who had low levels of physical activity. Participants who had food insecurity were 151% more likely to have obesity (OR = 2.51, 95% CI: 1.33,4.71, p = 0.00) than to be overweight compared to those who were food secure.
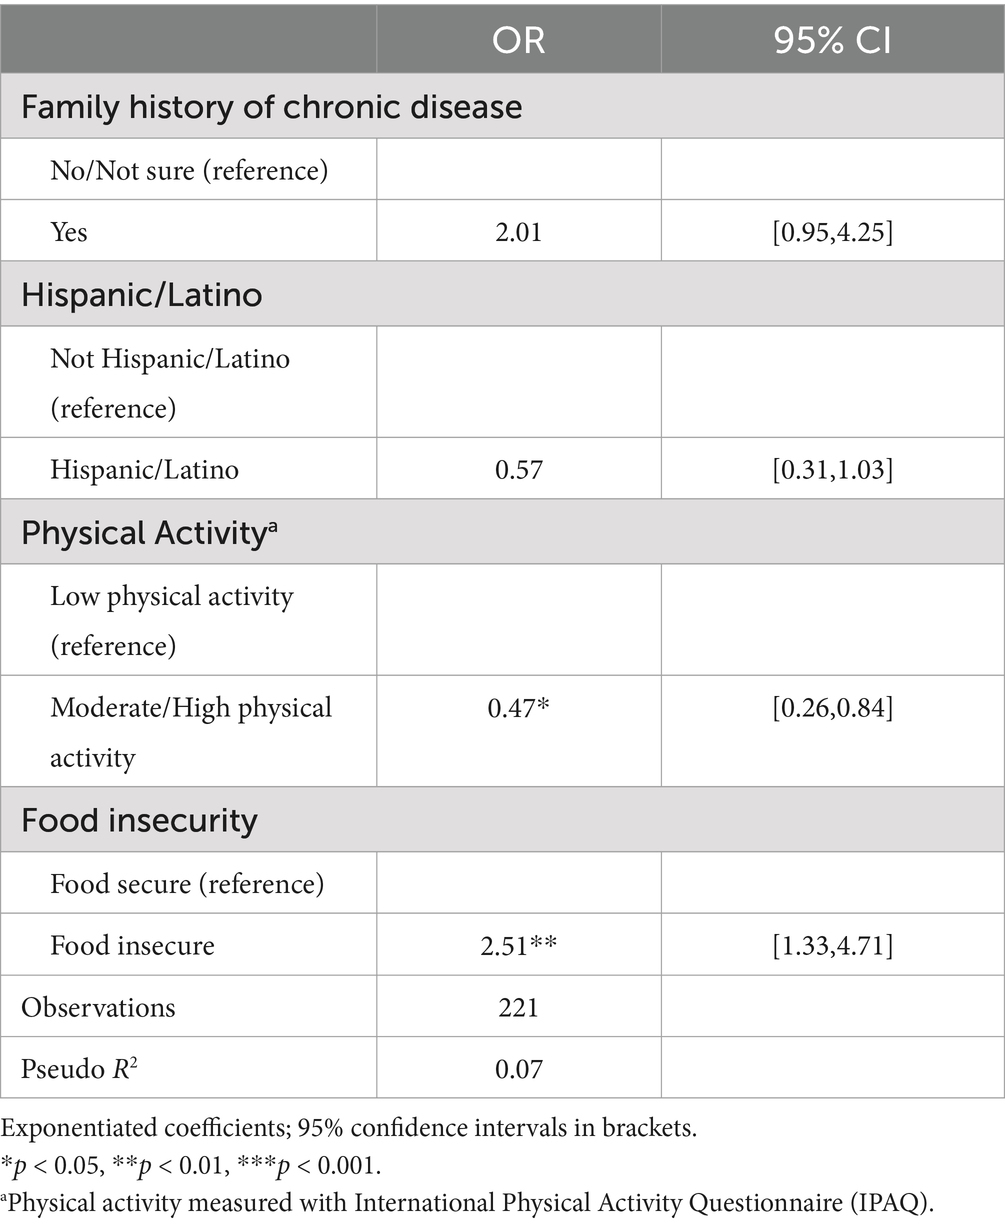
Table 2. Multivariate logistic regression model of correlates of BMI (Obesity vs. Overweight).
4 DiscussionIn the present study, we applied the socioecological model to investigate individual, interpersonal, and environmental factors that are thought to be related to BMI status in a population of women of reproductive age underrepresented in research. We found that among this sample of women who are overweight or have obesity, individual level factors, but not interpersonal or environmental factors, were related to the risk of obesity (relative to overweight). Specifically, spending more time engaging in moderate or high intensity physical activity was associated with a lower risk of having obesity, while food insecurity was associated with a higher risk of having obesity. Our findings on physical activity and food insecurity are in line with previous research showing a relationship between physical activity and food insecurity with obesity (55, 56).
In our sample, 38% reported food insecurity and 78% received assistance from WIC and/or SNAP. This is important as we found that food insecurity was one of the strongest predictors of increased risk of obesity compared to overweight. This finding is similar to results from previous studies (56), and supports research which has explored mechanisms through which food insecurity can increase risk of obesity (57–59). Our results highlight the continued importance of assessing and addressing SDOH as a method of decreasing obesity risk, especially among those who identify as Hispanic/Latino and who are in low-socioeconomic positions. In our sample, 43% identified as Hispanic/Latino and 51% had an education level of high school graduate or less. It should be noted that the question in our study assessed food insecurity at the individual level (e.g., ability to afford food). However, our finding may reflect SDOH or environmental level determinants such as economic stability and neighborhood food and physical environment (14), beyond what was measured in the current study with walking distance to the nearest park, fast food, and grocery store. For example, the ability to afford enough healthy food can be driven by SDOH such as economic stability (e.g., employment, education, debt) as well as access, acceptability, and availability of healthy affordable food (e.g., neighborhood food environment) (60).
Time spent engaging in high/moderate physical activity was associated with a lower risk of having obesity. The association between physical activity with a reduced risk of obesity is evident in previous research (55). Our findings add support that in an ethnically and socioeconomically underrepresented population of women of reproductive age, engaging in physical activity, is related to reduced weight. This finding is important for obesity prevention efforts among women of reproductive age. While 50% of participants in our study reported moderate/high physical activity, previous research indicates physical activity may decrease with parenthood (61).
Our results that the interpersonal and environmental level factors were not related to the risk of obesity (relative to overweight) are different from previous research which finds interpersonal factors (e.g., social support) and environmental level factors (e.g., physical activity and healthy food opportunities in the neighborhood) are associated with obesity (6, 14, 60, 62). These different results may be due to how interpersonal and environmental level factors were measured. Specifically, the physical activity and food environment was measured through a single metric of distance to the nearest park, grocery store, and fast-food outlet. Other interpersonal and environmental factors such as walkability, safety, social norms around eating and activity, neighborhood aesthetics, and public transit were not included. Previous research underscores the complexity of measuring environmental level determinants of obesity and health behaviors (63–65). In particular, it is challenging to tease apart the cumulative and interacting elements of the neighborhood environment and ways these elements influence behavior.
5 LimitationsOur study is not without limitations. We used BMI which is an indirect measure of obesity and therefore may not accurately determine overweight or obesity at the individual level (66). BMI is also modeled on white adults and may not necessarily translate to other races and ethnicities, introducing bias into the measure (27). This is especially salient for this study in which 43% of the participants identify as Hispanic and Latino. This was a cross-sectional analysis so it does not allow for causal determinations, but our findings do provide support for future longitudinal and/or experimental studies to investigate how modifiable factors such as food insecurity and physical activity could reduce obesity risk. We had limited measures at the environmental level (e.g., walking distance to nearest park, grocery store, and fast-food outlet), and broader factors like racism and discrimination, which could influence the results, were also not measured. We used the perceived stress scale to measure stress among participants in the study. While this scale has been validated for use in diverse populations, it may not adequately assess the stress experienced by populations who have experienced marginalization (67). Our small sample size and secondary analysis may have reduced our ability to detect significant associations. Lastly, due to an ICC of less than 0.01 for the outcome of BMI, we were unable to run a multilevel model.
6 ConclusionIn conclusion, our findings support that food insecurity and physical activity may be important factors associated with obesity relative to overweight in women of reproductive age. Interventions and policies for addressing obesity in this population may be effective by targeting health behaviors like physical activity and drivers of food insecurity. Our study contributes knowledge about obesity risk across ecological levels for women who identify as Hispanic/Latino and those of low-socioeconomic status of reproductive age, a population that is less represented in research.
Data availability statementThe datasets used/analyzed during the current study are available from the corresponding author on reasonable request.
Ethics statementThe studies involving humans were approved by Washington University in St. Louis institutional review board. The studies were conducted in accordance with the local legislation and institutional requirements. The participants provided their written informed consent to participate in this study.
Author contributionsAG: Conceptualization, Data curation, Formal analysis, Methodology, Writing – original draft, Writing – review & editing. AP: Methodology, Writing – review & editing, Conceptualization. SF: Methodology, Writing – review & editing. CS: Investigation, Resources, Writing – review & editing. DH-J: Conceptualization, Funding acquisition, Supervision, Writing – review & editing. RT: Funding acquisition, Methodology, Supervision, Writing – review & editing.
FundingThe author(s) declare that financial support was received for the research, authorship, and/or publication of this article. This publication was made possible by Grant Numbers 1R01HL143360 and T32 HL130357 from NHLBI of the National Institutes of Health (NIH), and R18DK089461 and P30DK092950 from the NIDDK. Funding was also provided by the National Institute of Mental Health T32MH019960. The content is solely the responsibility of the authors and does not necessarily represent the official view of the NIH.
AcknowledgmentsThe authors would like to acknowledge the substantive contributions of Parents as Teachers National Center.
Conflict of interestThe authors declare that the research was conducted in the absence of any commercial or financial relationships that could be construed as a potential conflict of interest. Author Contributions.
Publisher’s noteAll claims expressed in this article are solely those of the authors and do not necessarily represent those of their affiliated organizations, or those of the publisher, the editors and the reviewers. Any product that may be evaluated in this article, or claim that may be made by its manufacturer, is not guaranteed or endorsed by the publisher.
References1. Hales, CM, Carroll, MD, Fryar, CD, and Ogden, CL. Prevalence of obesity and severe obesity among adults: United States, 2017–2018. Hyattsville, MD: National Center for Health Statistics (2020).
3. Min, J, Goodale, H, Xue, H, Brey, R, and Wang, Y. Racial-ethnic disparities in obesity and biological, behavioral, and sociocultural influences in the United States: a systematic review. Adv Nutr. (2021) 12:1137–48. doi: 10.1093/advances/nmaa162
PubMed Abstract | Crossref Full Text | Google Scholar
5. Novak, M, Ahlgren, C, and Hammarström, A. A life-course approach in explaining social inequity in obesity among young adult men and women. Int J Obes. (2006) 30:191–200. doi: 10.1038/sj.ijo.0803104
PubMed Abstract | Crossref Full Text | Google Scholar
6. Bower, KM, Thorpe, RJ, Yenokyan, G, McGinty, EEE, Dubay, L, and Gaskin, DJ. Racial residential segregation and disparities in obesity among women. J Urban Heal New York Acad Med. (2015) 92:843–52. doi: 10.1007/s11524-015-9974-z
PubMed Abstract | Crossref Full Text | Google Scholar
7. Kumanyika, SK, Obarzanek, E, Stettler, N, Bell, R, Field, AE, Fortmann, SP, et al. Population-based prevention of obesity: the need for comprehensive promotion of healthful eating, physical activity, and energy balance: a scientific statement from American Heart Association Council on epidemiology and prevention. Interdiscip Commi Circul. (2008) 118:428–64. doi: 10.1161/CIRCULATIONAHA.108.189702
PubMed Abstract | Crossref Full Text | Google Scholar
8. Zheng, Y, Manson, JE, and Yuan, C. Associations of weight gain from early to middle adulthood with major health outcomes later in life. JAMA. (2017) 318:255–69. doi: 10.1001/jama.2017.7092
PubMed Abstract | Crossref Full Text | Google Scholar
10. Emmerich, SD, Fryar, CD, Stierman, B, and Ogden, CL. Obesity and severe obesity prevalence in adults: United States, august 2021–august 2023. (2024).
11. Bailey, ZD, Krieger, N, Agénor, M, Graves, J, Linos, N, and Bassett, MT. Structural racism and health inequities in the USA: evidence and interventions. Lancet. (2017) 389:1453–63. doi: 10.1016/S0140-6736(17)30569-X
Crossref Full Text | Google Scholar
12. Adler, NE, and Rehkopf, DH. U.S. disparities in health: descriptions, causes, and mechanisms. Annu Rev Public Health. (2008) 29:235–52. doi: 10.1146/annurev.publhealth.29.020907.090852
PubMed Abstract | Crossref Full Text | Google Scholar
13. Wong, MS, Chan, KS, Jones-Smith, JC, Colantuoni, E, Thorpe, RJ, and Bleich, SN. The neighborhood environment and obesity: understanding variation by race/ethnicity. Prev Med. (2018) 111:371–7. doi: 10.1016/j.ypmed.2017.11.029
PubMed Abstract | Crossref Full Text | Google Scholar
15. Sharma, G, Grandhi, GR, Acquah, I, Mszar, R, Mahajan, S, Khan, SU, et al. Social determinants of suboptimal cardiovascular health among pregnant women in the United States. J Am Heart Assoc. (2022) 11:e022837. doi: 10.1161/JAHA.121.022837
PubMed Abstract | Crossref Full Text | Google Scholar
16. Ryan, RA, Lappen, H, and Bihuniak, JD. Barriers and facilitators to healthy eating and physical activity postpartum: a qualitative systematic review. J Acad Nutr Diet. (2022) 122:602–613.e2. doi: 10.1016/j.jand.2021.11.015
PubMed Abstract | Crossref Full Text | Google Scholar
17. Hruby, A, Manson, JAE, Qi, L, Malik, VS, Rimm, EB, Sun, Q, et al. Determinants and consequences of obesity. Am J Public Health. (2016) 106:1656–62. doi: 10.2105/AJPH.2016.303326
PubMed Abstract | Crossref Full Text | Google Scholar
19. Leddy, MA, Power, ML, and Schulkin, J. The impact of maternal obesity on maternal and fetal health. Rev Obstet Gynecol. (2008) 1:170–8.
PubMed Abstract | Google Scholar
20. Hill-Briggs, F, Adler, NE, Berkowitz, SA, Chin, MH, Gary-Webb, TL, Navas-Acien, A, et al. Social determinants of health and diabetes: a scientific review. Diabetes Care. (2021) 44:258–79. doi: 10.2337/dci20-0053
PubMed Abstract | Crossref Full Text | Google Scholar
21. Haire-Joshu, D, Schwarz, CD, and Steger-May, K. A randomized trial of weight change in a national home visiting program. Am J Prev Med. (2019) 54:341–51. doi: 10.1016/j.amepre.2017.12.012.A
Crossref Full Text | Google Scholar
23. Tabak, RG, Schwarz, CD, Kemner, A, Schechtman, KB, Steger-May, K, Byrth, V, et al. Disseminating and implementing a lifestyle-based healthy weight program for mothers in a national organization: a study protocol for a cluster randomized trial. Implement Sci. (2019) 14:1–14. doi: 10.1186/s13012-019-0916-0
PubMed Abstract | Crossref Full Text | Google Scholar
24. Sallis, JF, Owen, N, and Fisher, E. Ecological models of health behavior In: K Glanz, B Rimer, and K Viswanth, editors. Health behavior and health education: Theory, research, and practice. San Francisco, CA: John Wiley & Sons, Inc. (2008). 465–85.
25. Quick, V, Martin-Biggers, J, Povis, GA, Hongu, N, Worobey, J, and Byrd-Bredbenner, C. A socio-ecological examination of weight-related characteristics of the home environment and lifestyles of households with young children. Nutrients. (2017) 9:604. doi: 10.3390/nu9060604
PubMed Abstract | Crossref Full Text | Google Scholar
26. Glass, TA, and Mcatee, MJ. Behavioral science at the crossroads in public health: extending horizons, envisioning the future. Soc Sci Med. (2006) 62:1650–71. doi: 10.1016/j.socscimed.2005.08.044
PubMed Abstract | Crossref Full Text | Google Scholar
28. Cohen, S, Kamarck, T, and Mermelstein, R. A global measure of perceived stress. J Health Soc Behav. (1983) 24:385–96. doi: 10.2307/2136404
Crossref Full Text | Google Scholar
29. Sanabria-Mazo, JP, Gómez-Acosta, A, Annicchiarico-Lobo, J, Luciano, JV, and Sanz, A. Psychometric properties of the perceived stress Scale-4 (PSS-4) in a Colombian sample: Onefactor, two-factor, or method effects? Rev Latinoam Psicol. (2024) 56:24–34. doi: 10.14349/rlp.2024.v56.3
PubMed Abstract | Crossref Full Text | Google Scholar
30. Cook, RM, Wind, SA, and Fye, HJ. A longitudinal examination of the psychometric properties of the English perceived stress scale- four (PSS-4) in mental health counsellors using item response theory. Stress Heal. (2024) 40:e3468. doi: 10.1002/smi.3468
PubMed Abstract | Crossref Full Text | Google Scholar
31. Vallejo, MA, Vallejo-Slocker, L, Fernández-Abascal, EG, and Mañanes, G. Determining factors for stress perception assessed with the perceived stress scale (PSS-4) in Spanish and other European samples. Front Psychol. (2018) 9:9(JAN). doi: 10.3389/fpsyg.2018.00037
PubMed Abstract | Crossref Full Text | Google Scholar
32. Ruisoto, P, López-Guerra, VM, Paladines, MB, Vaca, SL, and Cacho, R. Psychometric properties of the three versions of the perceived stress scale in Ecuador. Physiol Behav. (2020) 224:113045. doi: 10.1016/j.physbeh.2020.113045
PubMed Abstract | Crossref Full Text | Google Scholar
34. Sharp, L, Kimmel, L, Kee, R, Saltoun, C, and Chang, C. Assessing the perceived stress scale for African American adults with asthma and low literacy. J Asthma. (2007) 44:311–6. doi: 10.1080/02770900701344165
PubMed Abstract | Crossref Full Text | Google Scholar
35. Craig, CL, Marshall, AL, and Sjöström, M. International physical activity questionnaire: 12-country reliability and validity. Med Sci Sports Exerc. (2003) 35:1381–95. doi: 10.1249/01.MSS.0000078924.61453.FB
PubMed Abstract | Crossref Full Text | Google Scholar
36. Sember, V, Meh, K, Sorić, M, Jurak, G, Starc, G, and Rocha, P. Validity and reliability of international physical activity questionnaires for adults across eu countries: systematic review and meta analysis. Int J Environ Res Public Health. (2020) 17:1–23. doi: 10.3390/ijerph17197161
PubMed Abstract | Crossref Full Text | Google Scholar
37. Sanda, B, Vistad, I, Haakstad, LAH, Berntsen, S, Sagedal, LR, Lohne-Seiler, H, et al. Reliability and concurrent validity of the international physical activity questionnaire short form among pregnant women. BMC Sports Sci Med Rehabil. (2017) 9:7–10. doi: 10.1186/s13102-017-0070-4
PubMed Abstract | Crossref Full Text | Google Scholar
39. Thompson, FE, Midthune, D, Subar, AF, Kahle, LL, Schatzkin, A, and Kipnis, V. Performance of a short tool to assess dietary intakes of fruits and vegetables, percentage energy from fat and fibre. Public Health Nutr. (2004) 7:1097–106. doi: 10.1079/phn2004642
PubMed Abstract | Crossref Full Text | Google Scholar
40. Martin, K, Shah, K, Shrestha, A, Barrett, E, Shrestha, K, Zhang, C, et al. Reproducibility and relative validity of a dietary screener adapted for use among pregnant women in Dhulikhel. Nepal Matern Child Health J. (2023) 27:49–58. doi: 10.1007/s10995-022-03547-7
PubMed Abstract | Crossref Full Text | Google Scholar
41. George, SM, Thompson, FE, Midthune, D, Subar, AF, Berrigan, D, Schatzkin, A, et al. Strength of the relationships between three self-reported dietary intake instruments and serum carotenoids: the observing energy and protein nutrition (OPEN) study. Public Health Nutr. (2012) 15:1000–7. doi: 10.1017/S1368980011003272
PubMed Abstract | Crossref Full Text | Google Scholar
42. Yaroch, AL, Tooze, J, Thompson, FE, Blanck, HM, Thompson, OM, Colón-Ramos, U, et al. Evaluation of three short dietary instruments to assess fruit and vegetable intake: the National Cancer Institute’s food attitudes and behaviors survey. J Acad Nutr Diet. (2012) 112:1570–7. doi: 10.1016/j.jand.2012.06.002
PubMed Abstract | Crossref Full Text | Google Scholar
44. Hewawitharana, SC, Thompson, FE, Loria, CM, Strauss, W, Nagaraja, J, Ritchie, L, et al. Comparison of the NHANES dietary screener questionnaire to the automated self-administered 24-hour recall for children in the healthy communities study. Nutr J. (2018) 17:111–9. doi: 10.1186/s12937-018-0415-1
PubMed Abstract | Crossref Full Text | Google Scholar
45. Coleman-jensen, A, Rabbitt, MP, Gregory, CA, and Singh, A. Household food security in the United States in 2018. United States: Department of Agriculture, Economic Research Service. (2019).
46. Swindle, TM, Whiteside-Mansell, L, and McKelvey, L. Food insecurity: validation of a two-item screen using convergent risks. J Child Fam Stud. (2013) 22:932–41. doi: 10.1007/s10826-012-9652-7
Crossref Full Text | Google Scholar
47. Radandt, NE, Johnson, DB, Scott, JM, Corbridge, T, Kim, AS, and Coldwell, SE. Validation of a two-item food security screening tool in a dental setting. J Dent Child. (2018) 85:114–9.
PubMed Abstract | Google Scholar
48. Makelarski, JA, Abramsohn, E, Benjamin, JH, Du, S, and Lindau, ST. Diagnostic accuracy of two food insecurity screeners recommended for use in health care settings. Am J Public Health. (2017) 107:1812–7. doi: 10.2105/AJPH.2017.304033
PubMed Abstract | Crossref Full Text | Google Scholar
49. Hager, E, Quigg, A, Black, M, Coleman, SM, Heeren, T, Rose-Jacobs, R, et al. Development and validity of a 2-item screen to identify families at risk for food insecurity. Pediatrics. (2010) 126:e26–32. doi: 10.1542/peds.2009-3146.20595453
PubMed Abstract | Crossref Full Text | Google Scholar
50. Kegler, MC, Alcantara, I, Haardorfer, R, Gazmararian, JA, Ballard, D, and Sabbs, D. The influence of home food environments on eating behaviors of overweight and obese women. J Nutr Educ Behav. (2014) 46:188–96. doi: 10.1016/j.jneb.2014.01.001
留言 (0)