
記住我
As the center of economic activities, urbanization forms economies of scale by concentrating population, industries, and resources, thereby enhancing production efficiency and economic benefits. Urbanization improves residents’ living conditions by offering more employment opportunities, higher-quality education and medical services, and a richer cultural life, thereby enhancing the quality of life (1). However, with the accelerated advancement of urbanization in China, the continuous expansion of urban scale and the high concentration of population have driven socio-economic development while also leading to a series of issues such as excessive resource consumption, intensified environmental pollution, and the shrinkage of ecological spaces (2, 3). These problems not only harm local public health and residents’ quality of life, but also severely constrain the improvement of urban environmental welfare performance (EWP) (4, 5). EWP is a multidimensional concept that encompasses not only traditional environmental quality indicators, such as air quality and water status, but also residents’ health levels, environmental satisfaction, and the contribution of the environment to the economy (6). This concept emphasizes that in the process of economic development, it is essential not only to pursue the speed and scale of economic growth but also to focus on environmental protection and the improvement of residents’ quality of life. Therefore, the core of EWP lies in achieving a balance and win-win situation among economic growth, environmental protection, and social welfare. Due to variations in regional economic development levels, resource endowments, and environmental regulatory policies in China (7), urban EWP may exhibit significant spatio-temporal heterogeneity. Scientifically assessing the spatio-temporal evolution characteristics of urban EWP and delving into its influencing factors are of great significance for formulating effective environmental policies and regional development strategies.
Current research on EWP primarily centers on the following two main areas: The First aspect concerts the connotation and evaluation methods of EWP: Early studies concentrated on assessing environmental quality, mostly using single pollutant indicators such as chemical oxygen demand (COD), PM2.5, PM10, SO2, NO2, and CO2 as proxy variables (8–12). However, the single-indicator measurement method has limitations, as it can only reflect one aspect of environmental performance and cannot comprehensively assess the overall level of environmental performance. Consequently, scholars have constructed comprehensive indicators to measure environmental performance, such as the air quality index, water quality index, ecosystem health index, and waste management indicators (13–17). Some scholars have also combined environmental performance with economic or other social performance indicators to construct the environmental performance index (EPI), which typically includes multiple dimensions, such as resource utilization efficiency, pollution control effectiveness, and ecosystem services (18). Meanwhile, with the popularization and application of input–output models, scholars commonly use DEA, SFA, and the Super-SBM model to measure environmental efficiency or environmental performance (19–22). Among these, DEA is often used to assess comprehensive efficiency, including factors such as energy consumption, waste generation, and pollution emissions. As research deepens, scholars have begun to integrate factors such as resident health and environmental satisfaction into the evaluation system of environmental performance, thus paying more attention to the multidimensionality of EWP. For instance, a Network DEA model was to proposed to evaluate regional development performance considering environmental pollution and health factors (23). An index system of environmental governance performance that includes three dimensions: environmental protection, environmental quality, and environmental welfare, is constructed and used the Generalized Entropy Index to decompose regional differences (24). The Hybrid-Network DEA model was adopted to measure EWP (25). This method not only considers traditional input–output factors but also incorporates resident health factors closely related to environmental pollution, making the measurement of EWP more aligned with the concept of harmonious coexistence between humans and nature.
The second aspect concerns the factors influencing EWP. Within the existing scholarly works, investigations into the determinants of EWP primarily concentrate on policy, economic, and social factors. Policy factors represent one of the crucial elements affecting EWP. By formulating and implementing environmental protection policies, governments can drive the in-depth development of environmental governance efforts, thereby enhancing EWP. For instance, pilot policies for low-carbon cities significantly boost EWP, and the impact of policy factors varies notably across regions (6). Environmental regulatory policies can improve EWP by fostering economic growth, promoting technological innovation, unleashing talent dividends, and optimizing industrial structures (25). The transparency of government environmental information disclosure is positively correlated with corporate environmental performance; disclosing more environmental information encourages companies to enhance their environmental performance (26). A carbon trading system can reduce carbon emissions per unit of output in the short term, maximizing residents’ welfare gains. Implementing a carbon tax policy is most effective in smoothing macroeconomic fluctuations, contributing to the stability of residents’ production and living. Economic factors including the economic development level, industrial structure, and resource utilization efficiency also exert significant influences on environmental governance performance. Regions with higher levels of economic development tend to exhibit better environmental governance performance, while areas with a higher proportion of heavy industries often face more severe environmental pollution problems, thereby affecting environmental governance performance (24). Local protectionism and market segmentation behaviors exacerbate resource misallocation, subsequently exerting negative impacts on EWP (27). Social factors are also among the key influences on EWP. For example, heightened environmental awareness and increased environmentally friendly behaviors among residents contribute to advancing environmental governance efforts, thereby enhancing EWP (25). At the micro level, for listed companies, stakeholder pressure significantly affects the environmental protection behaviors of manufacturing enterprises (28). Green capacity building, by enhancing employees’ environmental awareness and capabilities, has a notable impact on improving environmental performance (29). Supply chain volatility significantly inhibits corporate environmental performance; that is, greater supply chain volatility leads to lower environmental performance among manufacturing enterprises. Environmental collaboration with customers, green procurement, and sustainable innovation directly contribute to outstanding environmental performance (30).
Despite the achievements made in the measurement of EWP and its influencing factors in existing literature, there are still some deficiencies. Firstly, regarding the measurement of EWP, current studies mostly employ single-dimensional indicators or models, which fail to comprehensively reflect the essence of EWP. Secondly, existing research pays limited attention to the trends, regional disparities, and spatiotemporal evolution characteristics of EWP. Lastly, in terms of studying the influencing factors of EWP, current research tends to focus on the role of individual factors, lacking a thorough exploration of the combined effects of multiple factors. Therefore, this paper makes innovations in the following aspects:
(1) A multi-dimensional evaluation index system for EWP is constructed. Building on existing literature, this paper incorporates indicators such as economic development, environmental quality, resident health, and social welfare into the evaluation system of EWP, providing a more comprehensive reflection of the essence of EWP. Additionally, the hybrid network data envelopment analysis (Hybrid-Network-DEA) model is utilized to accurately measure the EWP of various cities.
(2) The spatiotemporal evolution characteristics of EWP are thoroughly explored. This paper not only focuses on the trends and regional disparities of EWP but also delves into its spatiotemporal evolution characteristics using exploratory spatial data analysis method (ESDAM). Through comparative analysis of EWP across different cities, the dynamic process of balancing environmental protection and economic development among cities is revealed.
(3) A comprehensive analysis of the influencing factors and mechanisms of EWP is conducted. When exploring the influencing factors of EWP, this paper not only considers the role of individual factors but also comprehensively analyzes the combined mechanisms of multiple factors. By employing spatial econometric models and conducting in-depth discussions on various influencing factors, the degree of impact of different factors on EWP is revealed. This provides valuable reference for governments to formulate scientific and reasonable environmental protection policies and promote green urban development.
2 Methods 2.1 Hybrid-network-DEA modelIn the face of the dual challenges of economic development and environmental safeguarding, the research scope of environmental performance assessment should be expanded to encompass the idea of ecological civilization and the multidimensional pursuit of a better life by the public. However, most current evaluation indicators fail to adequately consider social welfare, which may lead to an overestimation of environmental performance. Amidst the ongoing construction of a Beautiful China and the modernization process of promoting harmonious coexistence between humans and nature, public attention to the green transformation of the economy and its impact on personal health and social well-being is increasing (6). Therefore, this paper incorporates factors closely related to environmental pollution, such as resident health and social welfare, into the analytical framework, and employs the Hybrid-Network-DEA model to construct an evaluation system of EWP that better aligns with the principle of harmonious coexistence between humans and nature.
Given the limitations of traditional DEA models in revealing the internal details that influence overall efficiency changes within input–output systems, we design a Hybrid-Network-DEA model that integrates economic development, environmental pollution, and social welfare (25, 27). This model is a comprehensive evaluation approach that integrates traditional DEA methods with network structure analysis, offering multiple advantages. Firstly, it effectively addresses the internal structure of complex systems by decomposing decision-making units (DMUs) into multiple sub-processes or stages, enabling a more detailed assessment of the efficiency of each sub-process and its contribution to overall efficiency. The introduction of this network structure allows the model to uncover internal efficiency bottlenecks and optimization pathways, providing decision-makers with more targeted improvement recommendations. Secondly, the Hybrid-Network-DEA model can simultaneously consider multiple input and output indicators, making it suitable for multi-objective, multi-level efficiency evaluation problems, particularly in fields such as resource allocation and environmental performance assessment. In summary, the Hybrid-Network-DEA model, through its structured and comprehensive characteristics, provides powerful tool support for the efficiency evaluation and optimization of complex systems, as illustrated in Figure 1.
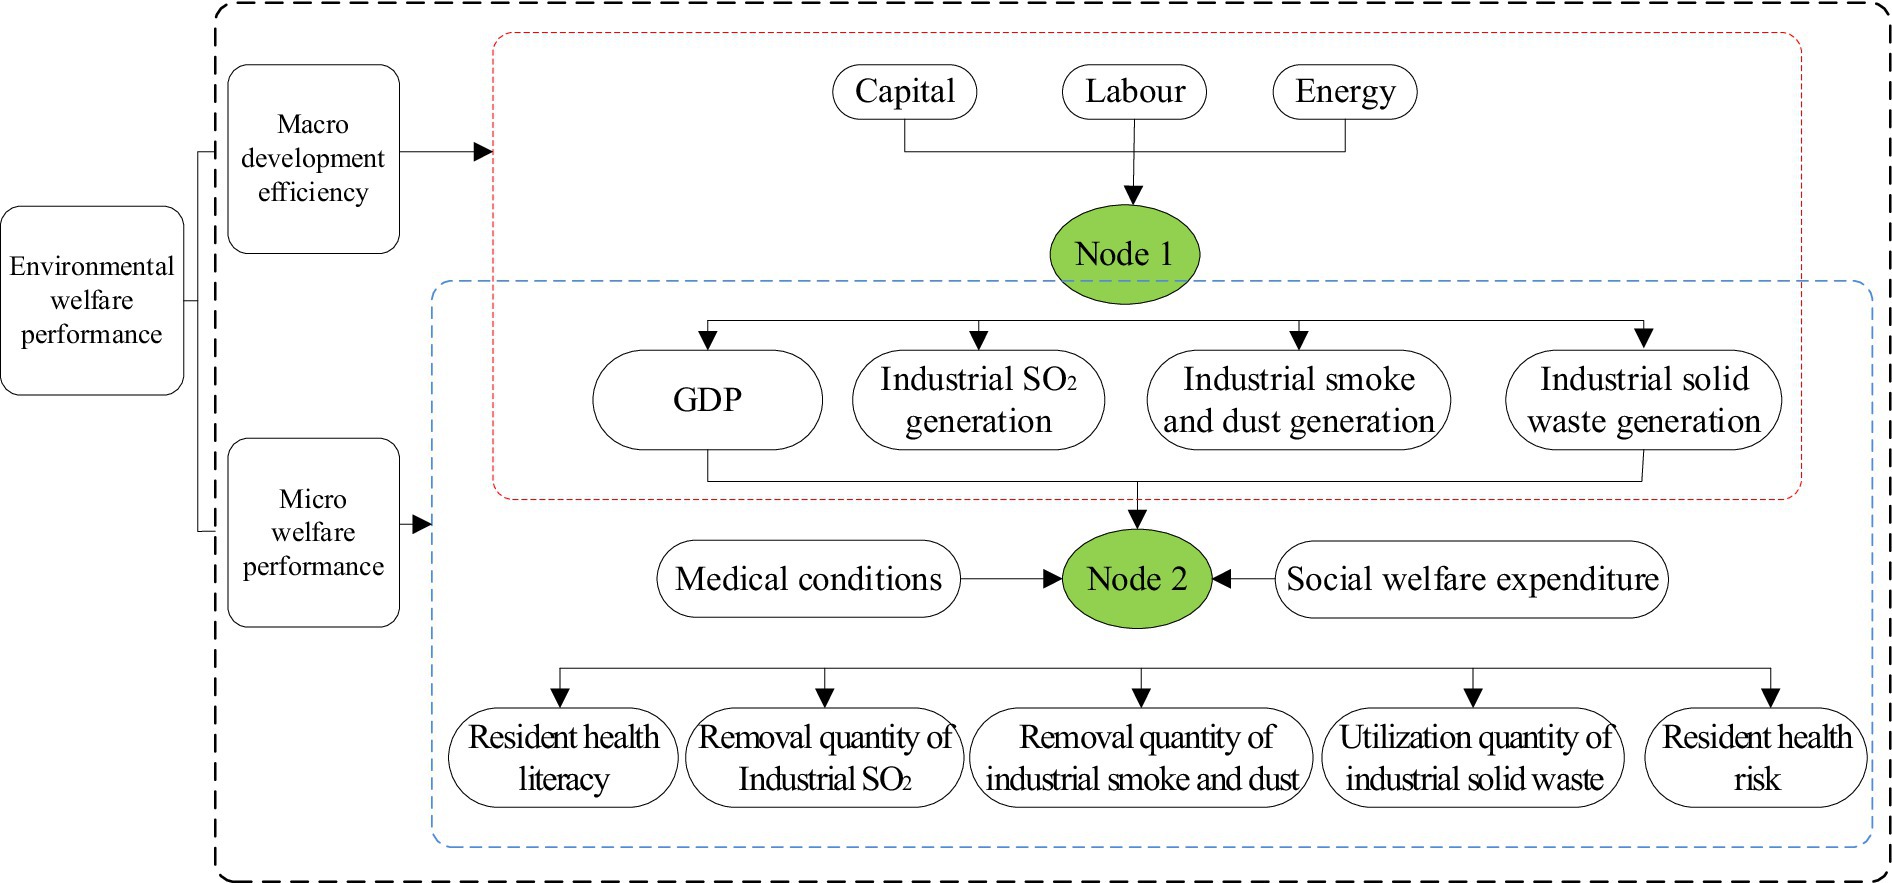
Figure 1. Hybrid-network-DEA model. The efficiency value of Node 1 is defined as macro-development performance, the efficiency value of Node 2 is defined as micro-welfare performance, and the combined efficiency value of the two represents EWP.
In Figure 1, the input factors for Node 1 are capital ( Z01,1 ), labor ( Z01,2 ), and energy ( Z01,3 ), with the corresponding desired output being GDP ( Z02,1 ) and the undesired outputs being industrial sulfur dioxide emissions ( Z02,2 ), industrial smoke and dust emissions ( Z02,3 ), and industrial solid waste generation ( Z02,4 ). The efficiency value of Node 1 is defined as macro-development performance. Meanwhile, we consider the output factors of Node 1, along with medical conditions ( Z02,5 ) and social welfare expenditures ( Z02,6 ), as the input factors for Node 2. The corresponding desired outputs for Node 2 are residents’ health literacy ( Z03,1 ), industrial sulfur dioxide removal ( Z03,2 ), industrial smoke and dust removal ( Z03,3 ), and industrial solid waste utilization ( Z03,4 ), while the undesired output is residents’ health risk ( Z03,5 ). Therefore, the efficiency value of Node 2 is defined as micro-welfare performance, and the comprehensive efficiency value of the two stages, Node 1 and Node 2, is defined as EWP.
When solving for the efficiency values of Node 1 and Node 2, given the close relationships between energy input and pollution, as well as between pollution and residents’ health risks, the simple assumption that inputs and outputs improve in equal proportions is not applicable here. Therefore, to accurately assess the efficiency of these two nodes, we need to combine the Hybrid Data Envelopment Analysis (Hybrid-DEA) model, which deals with undesired outputs, with the Network Data Envelopment Analysis (Network-DEA) model, thereby constructing the Hybrid-Network-DEA model. The specific expression is as follows:
minθ1+θ2∑j=1,≠0nλj1zj1,1≤θ1z01,1,∑j=1,≠0nλj1zj1,2≤θ1z01,2,∑j=1,≠0nλj1zj1,3≤θ1z01,3,∑j=1,≠0nλj1zj2,1≥θ2z02,1,∑j=1,≠0nλj1zj2,2≤θ2z02,2,∑j=1,≠0nλj1zj2,3≤θ2z02,3,∑j=1,≠0nλj1zj2,4≤θ2z02,4,λj1≥0,j=1,⋯,n,j≠0 (1) ∑j=1,≠0nλj2zj2,1≤θ2z02,1,∑j=1,≠0nλj2zj2,2≤θ2z02,2,∑j=1,≠0nλj2zj2,3≤θ2z02,3,∑j=1,≠0nλj2zj2,4≤θ2z02,4,∑j=1,≠0nλj2zj2,5≤θ2z02,5,∑j=1,≠0nλj2zj2,6≤θ2z02,6,∑j=1,≠0nλj2zj3,1≥θ2z03,1,∑j=1,≠0nλj2zj3,2≥θ2z03,2,∑j=1,≠0nλj2zj3,3≥θ2z03,3,∑j=1,≠0nλj2zj3,4≥θ2z03,4,∑j=1,≠0nλj2zj3,5≥θ2z03,5,λj2≥0,j=1,⋯,n,j≠0 (2) θ∗=min1−1m∑i=1m1Sis−/xi0s+m21−a1+1r∑r=1r1Srsg/xr0sg+r21−a,Sis−≥0,Srsg≥0,0≤a≤1 (3)Equations 1, 2 represent the constraint conditions for solving the efficiency values of Node 1 and Node 2, respectively, while Equation 3 calculates the efficiency value of a single node based on the Hybrid-Network-DEA model. Here, m=m1+m2 , m1 and m2 denote the number of divisible and indivisible input factors, respectively. Similarly, r=r1+r2 , r1 and r2 represent the number of divisible desired output factors and indivisible undesired output factors, respectively. Sis− and Srsg are the slack variables for divisible input factors and divisible desired output factors, respectively. λj is the weight coefficient for the decision-making unit; θ1 is the calculated efficiency value for Node 1, and θ2 is the calculated efficiency value for Node 2.
2.2 Global Moran’s IGlobal Moran’s I is an important indicator for measuring spatial correlation and aggregation. The specific calculation method is shown in Equation 4:
I=n∑i=1n∑j=1nwijxi−x¯xj−x¯∑i=1n∑j=1nwij∑i=1nxi−x¯2=∑i=1n∑j=1nwijxi−x¯xj−x¯S2∑i=1n∑j=1nwij (4)Where n is the sample size; xi and xj denote the observed value for spatial units i and j; s represents the standard deviation; and W is the spatial weight matrix.
Considering the missing data for some cities, if an adjacency weight matrix is constructed, it can not reflect the true spatial correlation. Therefore, we ultimately construct a geographic distance weight matrix and an economic-geographic distance matrix. The specific expressions for both are shown in Equations 5, 6:
wij=1dij,i≠j0,i=j (5) wij=1GDPi−GDPjdij,i≠j0,i=j (6)Where, dij represents the distance between two regions; GDPi and GDPj represent the GDP of regions i and j.
2.3 Spatial econometric modelIn this paper, the commonly used Spatial Durbin Model (SDM) is employed to explore the influencing factors of EWP, as presented in Equation 7.
Y=ρWY+β1X+β2WX+ε (7)Where ρ denotes the autocorrelation coefficient of the explained variable; W denotes the weight matrix. Y denotes the EWP; X denotes the influencing factors of EWP.
Furthermore, in SDM, since the right-hand side of the formula includes the spatially lagged terms of both the explanatory and explained variables, the coefficients obtained cannot directly reflect the magnitude of spatial spillover effects. Therefore, further decomposition is required to obtain the direct and indirect effects. By decomposition, Equation 7 can be transformed into the following two Equations 8, 9 (31):
In−ρWY=βX+θWX+ε (8) Y=In−ρW−1+Inβ+θWIn−ρW−1X+In−ρW−1ε (9)Assuming EW=In−ρW−1 , VW=Inβ+θWIn−ρW−1 , substitute them into Equation 9, combine it with Equation 10 to obtain Equation 11, and expand it to obtain Equation 12:
In−ρW−1=In+ρW+ρ2W2+ρ3W3+ρ4W4+… (10) Y=∑k=1nVkWXk+EW+EWε (11) Y1Y2⋮Yn=VkW11VkW12…VkW1nVkW21VkW22…VkW2n⋮⋮⋱⋮VkWn1VkWn2…VkWnnX1kX2k⋮Xnk+EW+EWε (12)Where, VkWXik=∂Yi/∂Xik , VkWXjk=∂Yi/∂Xjk . VkWXik signifies the elements situated along the main diagonal of the coefficient matrix Xnk , which indicate the direct effects. Additionally, it denotes the impact that the k-th explanatory variable in region i on the explained variable within the same region. VkWXjk signifies the off-diagonal elements of the coefficient matrix Xnk , which indicate the indirect effects. Additionally, it denotes the impact that the k-th explanatory variable in region i on the explained variable in a different region j. The sum of the indirect and direct effects gives the total effect.
2.4 Indicators and data sources 2.4.1 Explained variablesAccording to Figure 1, the input indicators for Node 1 include capital, labor, and energy. Specifically, the capital stock is calculated using the fixed asset investment data of each city across the society (32). The labor is measured by the total number of employees in urban units, individuals, and private enterprises at the end of the year. Since energy consumption data are not currently published in urban yearbooks, we use total social electricity consumption as a proxy for energy input. The desired output indicator for Node 1 is urban GDP, while the undesired output indicators include industrial SO2 generation, industrial smoke and dust generation, and industrial solid waste generation.
We use the output indicators of Node 1, along with medical conditions and social welfare expenditures, as input indicators for Node 2. Among them, medical conditions are reflected by the number of hospital beds, and social welfare expenditures are represented by the sum of pension, social welfare relief, and social security expenditures. For the output variables corresponding to Node 2, considering the current lack of statistical data on life expectancy at the city level for each year in China, we adopt the per capita disposable income of urban residents as a proxy for residents’ health literacy, as it reflects their wealth status and higher income generally implies better health literacy (25). Meanwhile, the removal of industrial sulfur dioxide, industrial smoke and dust, and the utilization of industrial solid waste reflect the effectiveness of regional environmental governance, and are therefore included as desired outputs along with residents’ health literacy. Additionally, given that intensifying environmental pollution increases health risks for residents, making them more susceptible to illnesses and potentially leading to premature deaths, we select the annual number of deaths as an indicator to measure residents’ health risks and classify it as an undesired output.
2.4.2 Independent variablesDrawing on the findings of some scholars and considering the characteristics of cities, we select seven key factors that may influence EWP, including economic development, industrial structure, opening-up, financial development, digital infrastructure, transportation structure, and population density. The specific explanations are as follows:
Economic Development (RGDP): Economic development remains the prerequisite and guarantee for enhancing urban EWP. High-quality economic development contributes to achieving the sustainable development goal of “low consumption, high welfare.” As economic development trends upward, EWP also increases. This paper uses per capita GDP to measure urban economic development. Due to the lack of GDP deflators at the city level, the provincial GDP deflators are used to adjust the city’s GDP to constant 2004 prices (33).
Industrial Structure (IS): The upgrading of industrial structure, such as the shift from high-pollution, high-consumption industries to services and technology-intensive industries, can reduce pollution emissions, improve the ecological environment, and thereby enhance ecological welfare performance. Conversely, an unreasonable industrial structure may lead to excessive resource consumption and increased environmental pollution, reducing ecological welfare performance. This paper measures the industrial structure using the proportion of the secondary industry in GDP (34).
Opening-up (OPEN): On one hand, opening-up can introduce foreign capital and advanced technology, promote green technological progress, and improve pollution control capabilities, thereby exerting a positive effect on EWP. On the other hand, opening-up may also lead to the transfer of polluting industries to domestic markets, increasing environmental pollution and exerting a negative effect on EWP. Therefore, the ultimate impact of opening-up on EWP depends on the trade-off between positive and negative effects. This paper measures the degree of opening-up using the ratio of actual foreign investment to GDP (35).
Financial Development (FD): On one hand, financial development can provide funding support for environmental projects and technological innovation, driving the growth of green industries, thereby reducing pollution emissions and promoting the improvement of environmental quality (36). On the other hand, if financial development excessively pursues short-term economic interests while ignoring environmental protection, it may lead to excessive capital flows into high-pollution, high-energy-consuming industries, exacerbating environmental problems and reducing EWP. This paper measures financial development using the ratio of financial institution deposits and loans to GDP (37).
Digital Infrastructure (DINF): Digital infrastructure promotes the innovation and application of green technologies by enhancing data processing, network connectivity, and intelligence levels, reducing resource consumption and environmental pollution. At the same time, digital infrastructure can also improve management efficiency, optimize resource allocation, reduce unnecessary waste, and thereby improve environmental performance (38). Furthermore, digital infrastructure can drive the upgrading of the economic structure, promote sustainable development, and further enhance EWP. This paper measures digital infrastructure using the number of internet users and mobile phones per 100 people (39).
Transportation Structure (TS): A diversified and efficient transportation structure can promote the development of environmentally friendly transportation modes, such as public transportation, railways, and water transportation, which significantly reduce carbon emissions and air pollution compared to private cars, helping to enhance environmental quality. Meanwhile, optimizing the transportation structure can also effectively alleviate urban traffic pressure, reduce traffic congestion and noise pollution, and enhance residents’ quality of life and happiness. This paper measures the transportation structure using road freight volume (40).
Population Density (PD): On one hand, high population density may exacerbate resource consumption and environmental pollution, such as traffic congestion and increased pressure on waste disposal, thereby reducing EWP. On the other hand, high population density may also promote the effective utilization of public facilities and resource sharing, such as public transportation and green parks, which can help enhance environmental welfare. Therefore, population density’s impact on EWP depends on the effectiveness of urban planning, resource management, and environmental protection measures. This paper measures population density using the number of people per square kilometer (41).
2.4.3 Data sourcesBecause of the absence of pertinent data for certain cities, this study has chosen 240 cities in China spanning the years from 2004 to 2019 as the subjects for measuring and analyzing their EWP. The data mainly come from the “China City Statistical Yearbook,” “China Energy Statistical Yearbook,” “China Environment Statistical Yearbook,” and the statistical yearbooks of various provinces and cities over the years. Although these data sources are authoritative and comprehensive, they still have certain limitations. Firstly, data in statistical yearbooks may suffer from inconsistencies in statistical standards or delays in updates, which can limit the comparability of data across different years or regions. Secondly, some indicators may have missing or incomplete data, particularly for certain small and medium-sized cities or underdeveloped regions, where records may not be comprehensive. This can affect the overall integrity and accuracy of the research. Therefore, this study used interpolation to supplement some of the missing data and excluded cities with severely insufficient data, focusing instead on 240 cities with relatively complete data.
3 Results and discussion 3.1 Measurement results of EWPAs shown in Figure 2, we can clearly observe the significant trends in EWP across the country, as well as in the east, central, and west, from 2004 to 2019. Nationwide, EWP exhibited a wavy upward trend over these 16 years. Starting from 0.35 in 2004, it has grown continuously to reach 0.613 in 2019. The possible reasons lie in China’s gradual strengthening of the formulation and implementation of environmental protection policies during this period. For example, the construction of ecological civilization was set as an important goal in the “Eleventh Five-Year Plan” through the “Thirteenth Five-Year Plan,” which promoted the improvement of the environmental governance system and the implementation of the green development concept. Secondly, the transformation of the economic growth model played a crucial role, shifting from a high-pollution, high-energy-consumption extensive development to a green and low-carbon intensive development, which facilitated the improvement of resource utilization efficiency and the reduction of pollution emissions. Furthermore, the significant improvement in social welfare levels is also an important factor, including increased investments in education, healthcare, social security, and other fields, which directly enhanced residents’ quality of life and subsequently drove the improvement of EWP.
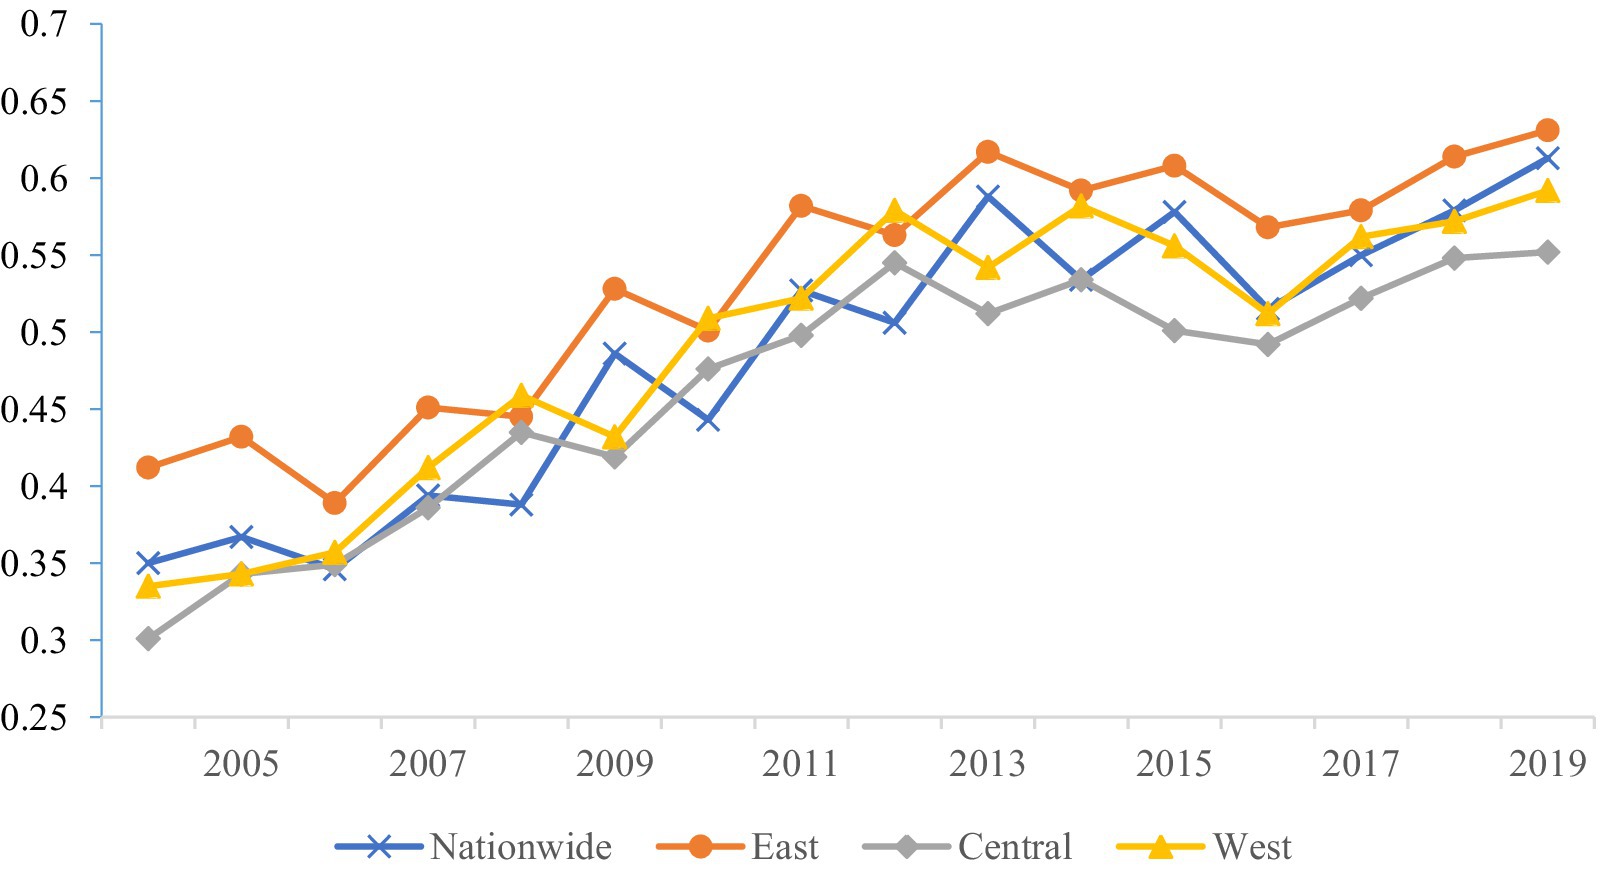
Figure 2. Trend of changes in urban EWP in China from 2004 to 2019.
With respect to specific regions, our findings indicate that the east, being the most economically prosperous area in China, has consistently sustained a high level of EWP, exhibiting a gradual increase over time. From 0.412 in 2004 to 0.631 in 2019, it surpasses the average EWP of the central and west. Despite the growth rate in the east not being as pronounced as the national average, its stable development and high starting point make it a leader nationwide. This may be attributed to the east’s strong economic foundation, optimized industrial structure, which has allowed it to find a more balanced development path among environmental protection, social welfare, and economic development. Moreover, due to its economic prosperity and high education level, the public in the east has a relatively higher awareness of and participation in environmental protection.
Initially, the central’s EWP was relatively low, with an average of 0.464, significantly below the national urban average. However, over time, it has also shown a clear upward trend. Recently, the growth rate in the central has accelerated, gradually narrowing the gap with the east. This may be related to the central’s recent efforts in strengthening environmental protection, promoting industrial upgrading, and enhancing social welfare levels. The west’s initial EWP was similar to that of the central, with an average of 0.469, also significantly below the national urban average. However, as time passed, its growth rate gradually accelerated, particularly after 2010, when the performance value of the west significantly improved. This may be associated with the national government’s key support for the west, the region’s own resource endowments, and increased investments in environmental protection and social welfare recently.
3.2 Regional disparities and source decomposition of EWPWe explore the overall and regional disparities of China’s EWP, as illustrated in Figure 3. Specifically, the Gini coefficient declined from 0.14 in 2004 to 0.10 in 2009, representing a 27.5% decrease. The overall disparities showed a downward trend, indicating that the imbalanced development of China’s EWP has been effectively improved. In terms of intra-regional disparities, the Gini coefficients for the three major regions are, in descending order, the east, west, and central, with mean values of 0.102, 0.067, and 0.023, respectively. For the east, the Gini coefficient decreased from 0.111 in 2004 to 0.101 in 2009, then rose to 0.107 in 2013, followed by a fluctuating downward trend to 0.093 in 2017, and briefly rose again to 0.1 in 2019. Overall, it exhibited a trend of “steady decline - brief increase - fluctuating decline - brief increase.” The west, with 2013 as a turning point, showed a trend of first decreasing and then increasing. It steadily declined from 0.094 at the beginning of the sample period to 0.051 in 2013 and subsequently gradually rose to 0.059 in 2019. This may be attributed to the approval of the “12th Five-Year Plan for the Western Development” in 2012, which required accelerating the transformation of development modes and structural adjustments in the west, strengthening the national ecological barrier, and promoting resource conservation, intensive use, and recycling, thereby enhancing EWP. The central, with 2009 as a turning point, overall showed a development trend of “sharp decline - stable fluctuation.” It declined from 0.039 in 2004 to 0.015 in 2009 and subsequently fluctuated between 0.015 and 0.023.
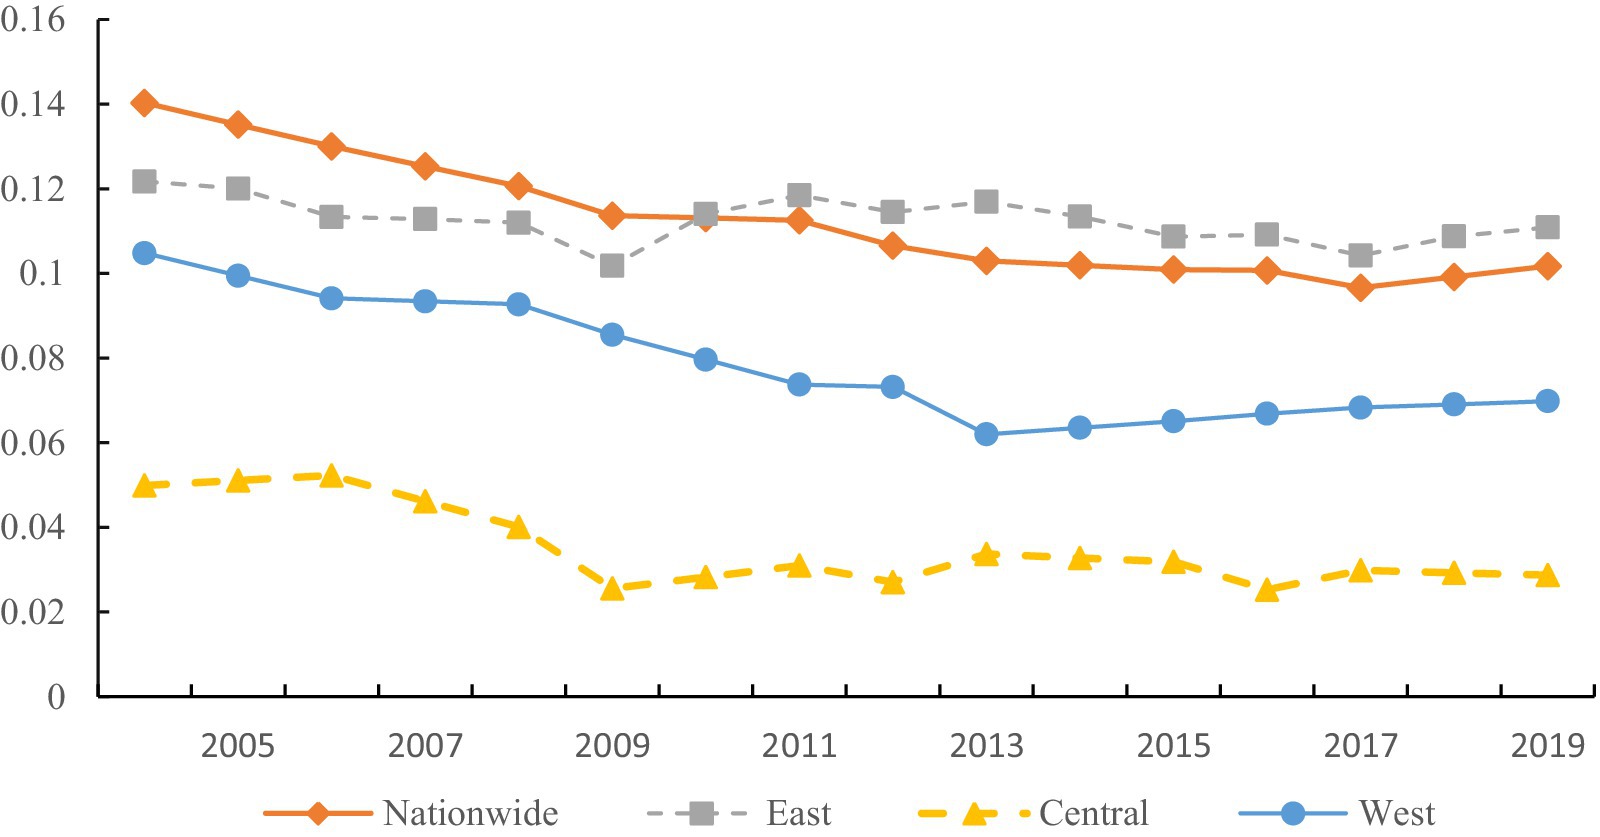
Figure 3. Overall and intra-regional disparities.
In summary, the intra-regional disparities among the three major regions exhibit a pattern of east > west > central. A possible reason is the significant variation in EWP among cities in the east. Taking 2019 as an example, eastern cities such as Beijing, Shanghai, Tianjin, Guangzhou, Nanjing, and Hangzhou have EWP scores above 0.5, placing them in the “first tier.” Cities like Jilin, Shenyang, Yantai, Qingdao, Xi’an, and Baoji have scores above 0.4, forming the “second tier”; whereas Haikou, Yancheng, Qinhuangdao, Nanning, and Zhengzhou collectively constitute the “third tier,” which encompasses cities from the east, west, and central. This shows that all three tiers include eastern cities, which is the main reason for the large disparities in EWP within the east. The EWP in the central is generally comparable, with most cities having differences in EWP below 0.4, except for a few outliers, indicating smaller disparities among central cities.
As shown in Figure 4, the characteristics of inter-regional disparities in China’s EWP can be analyzed from two dimensions: the degree of disparity and the trend of disparity. Firstly, in terms of the degree of inter-regional disparity, the disparity between the east and the west is the largest, with an average Gini coefficient of 0.143; followed by the disparity between the east and the central, with an average Gini coefficient of 0.116; and the disparity between the central and the west is the smallest, with a Gini coefficient of 0.098. This indicates that during the sample period, the inter-regional disparities in China’s EWP were primarily driven by the disparities between two sets of regions: the east–west and east-central. Secondly, in terms of the trend of disparity, the Gini coefficients among all regions showed an overall declining trend during the sample period. Specifically, the Gini coefficient of central-west exhibited a steady decline, while the Gini coefficient of east–west showed a fluctuating downward trend. The Gini coefficient of east-central displayed a pattern of “slow decline - brief increase - fluctuating decline.” Among them, the Gini coefficient of central-west had the largest decrease, dropping from 0.143 in 2004 to 0.059 in 2019, a decrease of 58.7%; the decreases for the east–west and east-central pairs were smaller, at 15.96 and 5.21%, respectively. All the inter-regional Gini coefficients show varying degrees of decline, indicating that with China’s economic and social development, the regional disparities in
留言 (0)