
記住我


Flow chart of the research process is shown in Fig. 1. The overall prevalence of AF in the elderly population aged 65 and above is 2.96% (174/5879), with the participating population comprising 3,808 males (64.77%) and 2,071 females (35.23%). The prevalence of AF in elderly males was higher than in elderly females (129/3,808 [3.39%] vs. 45/2,071 [2.17%], X²=6.892, P = 0.009). To assess the potential association between AF prevalence and age, participants were divided into four groups: 2,643 participants (1,640 males/1,003 females) aged 65–70; 1,353 participants (885 males/468 females) aged 70–75; 949 participants (625 males/324 females) aged 75–80; and 934 participants (658 males/276 females) aged over 80. The prevalence of AF in each age group was 27 (1.02%), 43 (3.18%), 46 (4.85%), and 58 (6.21%), respectively, with significant differences in AF prevalence among the four age groups (X²=80.916, P < 0.001) (Fig. 2).
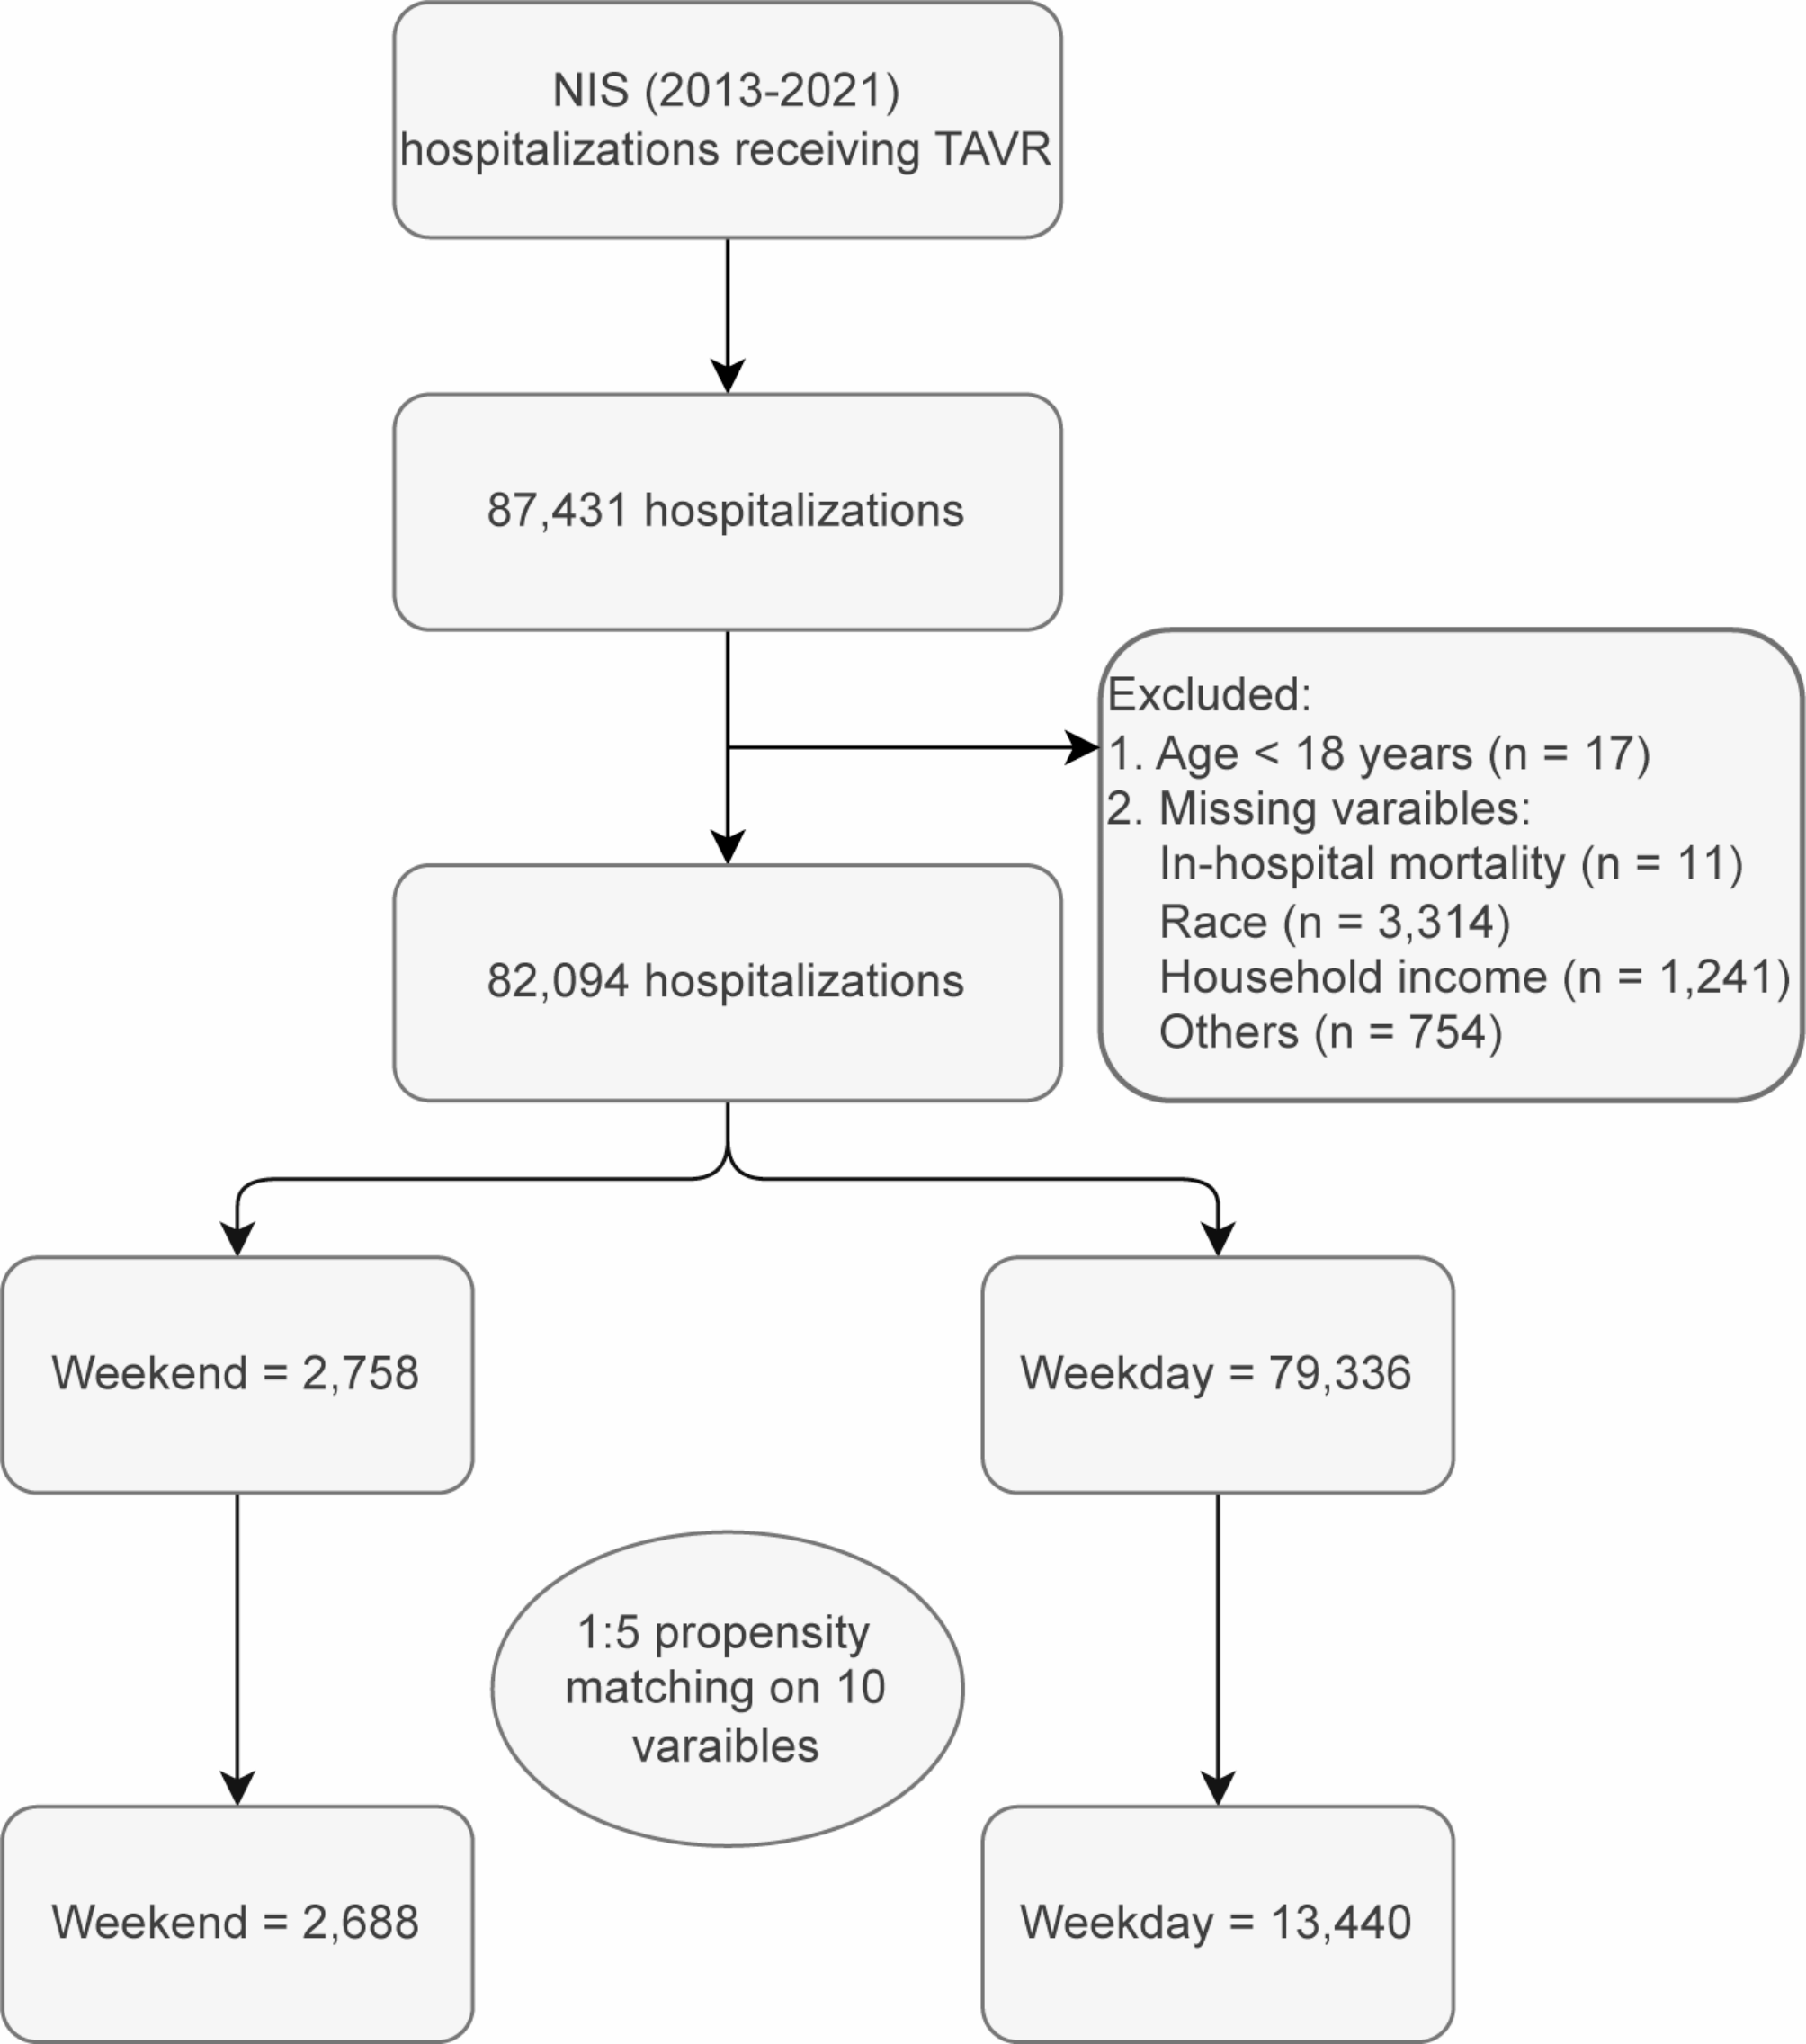
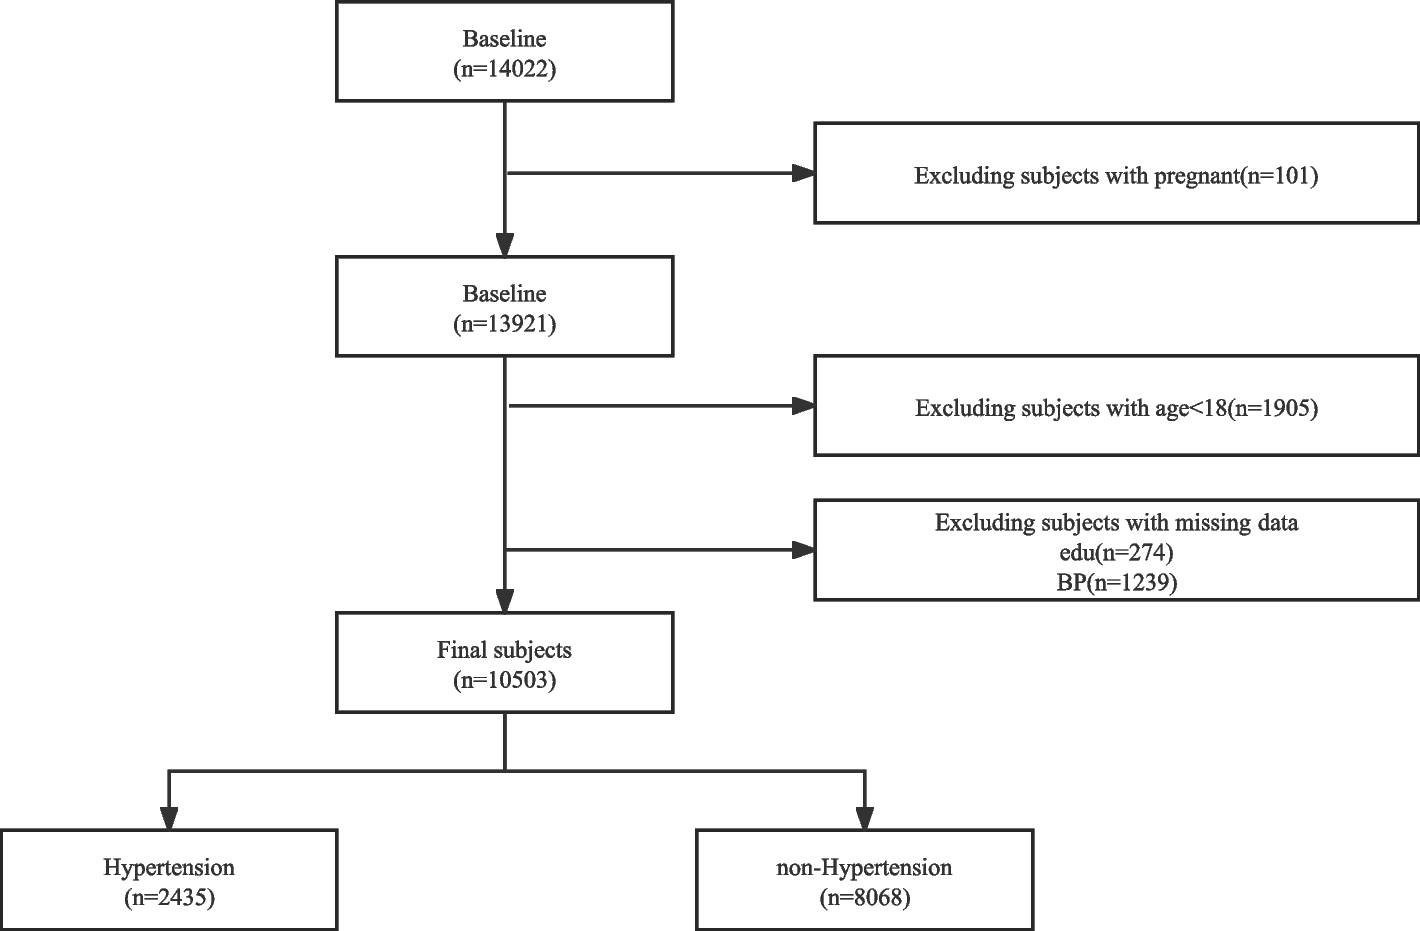
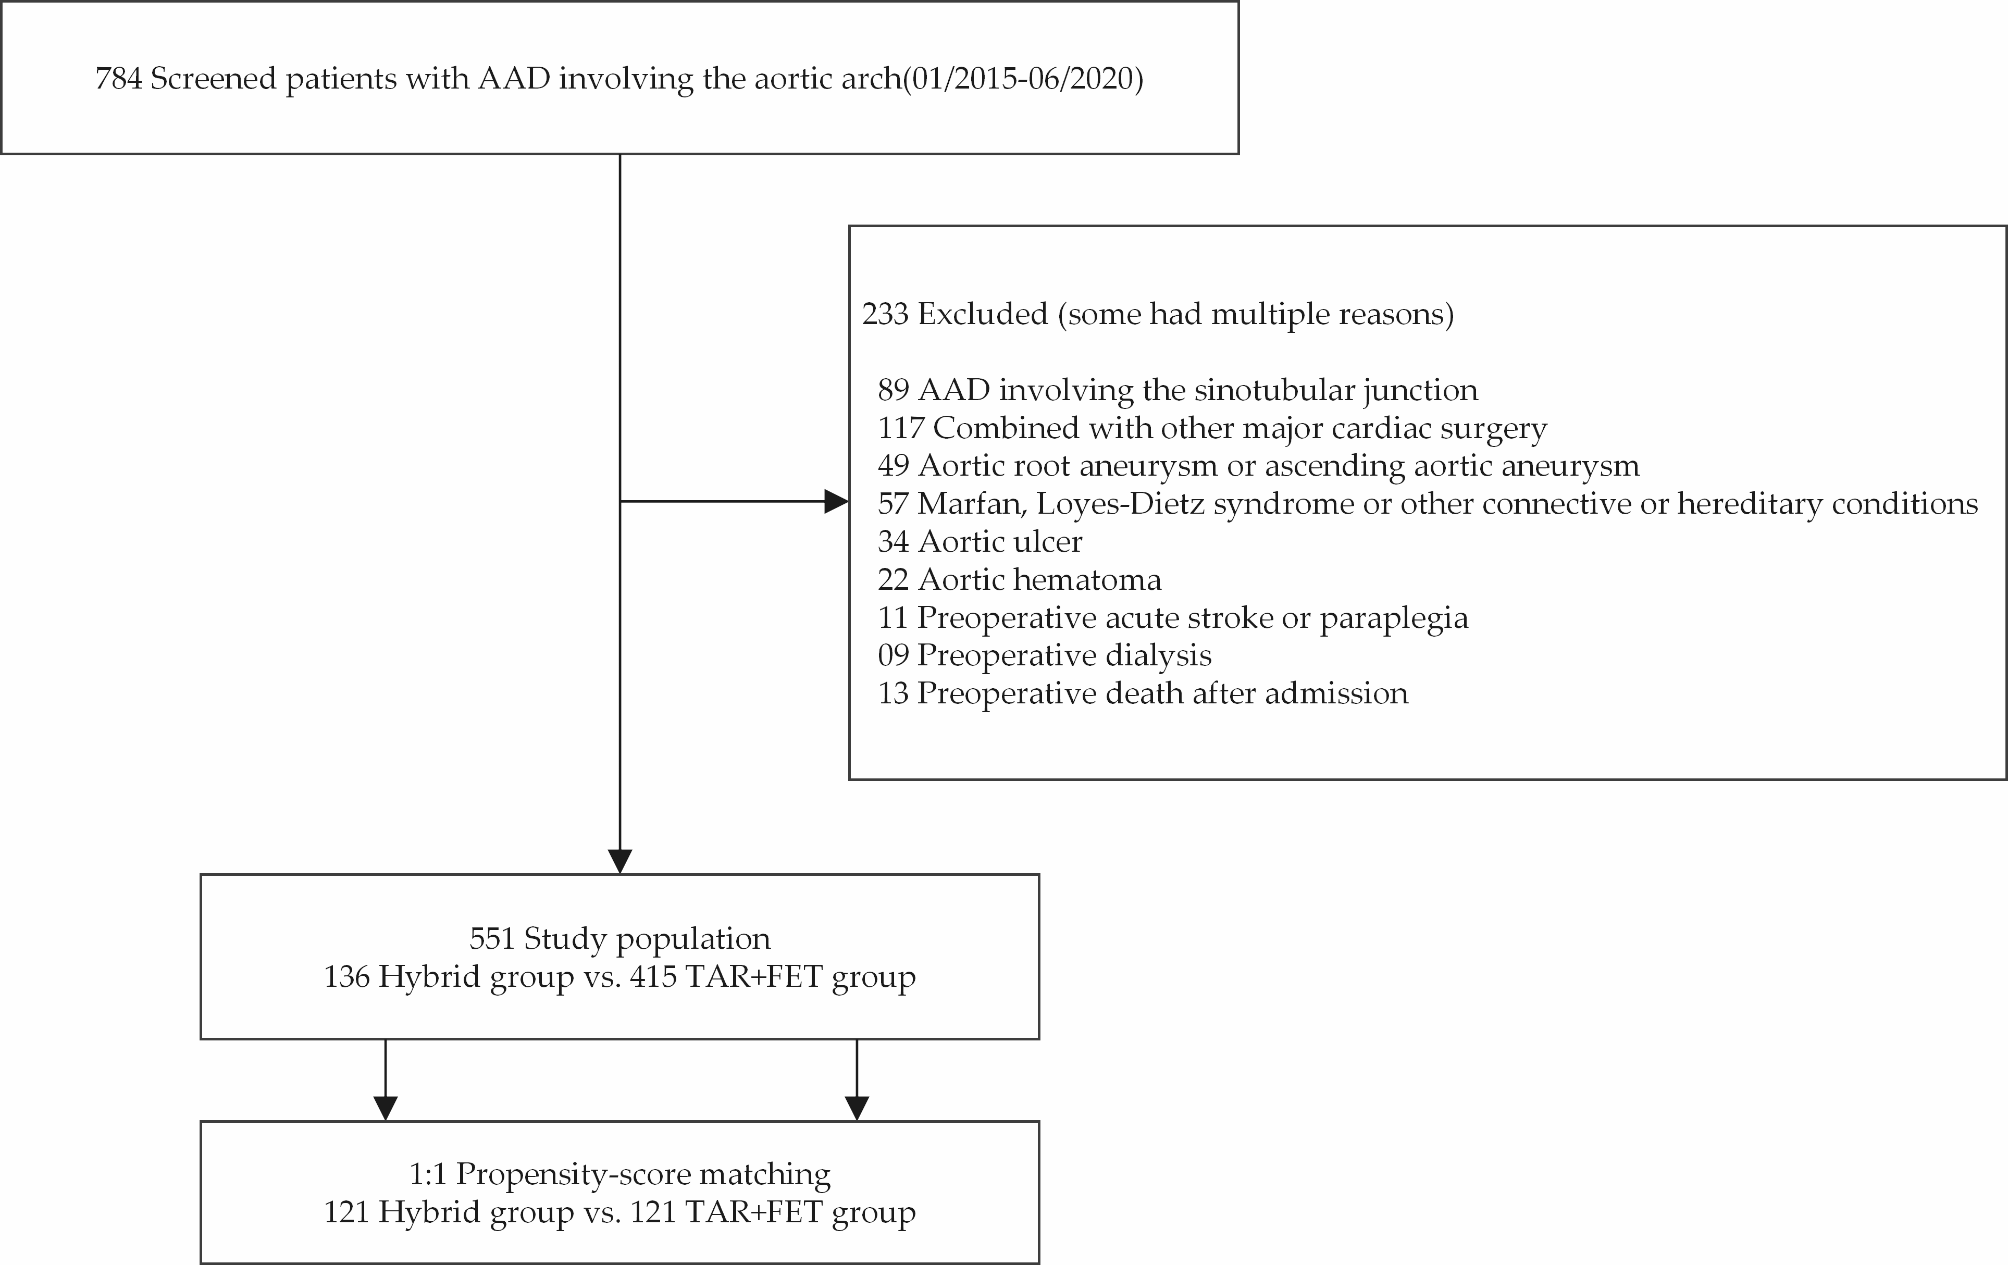
Fig. 1
Flow chart of the research process
Fig. 2
Comparison of atrial fibrillation prevalence across different ages and genders. *P < 0.001 male versus female
The prevalence of AF in males across the age groups was 22 (1.34%), 34 (3.84%), 34 (5.44%), and 39 (5.93%), respectively, with significant differences in AF prevalence among the four age groups (X²=42.546, P < 0.001). The prevalence of AF in females across the age groups was 5(0.50%), 9(1.92%), 12(3.70%), and 19 (6.88%), respectively, with significant differences in AF prevalence among the four age groups (X²=47.932, P < 0.001). The prevalence of AF in the overall population and in both male and female subgroups increased with age. Additionally, in the 65–70 and 70–75 age groups, the incidence of hyperuricemia in males was significantly higher than in females (P < 0.05), while over 75 years old, there was no statistically significant difference in the prevalence rates between the two genders (P > 0.05).
Baseline characteristics of AF group and non-AF groupThis study collected datas from 5,879 individuals over the age of 65, with 174 individuals diagnosed with AF. The 174 AF patients were included in the case group, and 696 individuals were included in the control group. The average age of both the case and control groups was 77.30 ± 5.97 years, with 45 females (25.9%) in the case group and 180 females (25.9%) in the control group. Significant statistical differences were observed between the case and control groups in terms of BMI, hypertension, diabetes, non-alcoholic fatty liver disease, gallstones, TyG-BMI index, TG/HDL-c index, hemoglobin, hematocrit, red cell distribution width, albumin, total bilirubin, direct bilirubin, indirect bilirubin, gamma-glutamyl transpeptidase, blood sugar, uric acid, triglycerides, low-density lipoprotein cholesterol, MHR index, RAR index, monocyte count, and platelet count(all P < 0.05) (Table 1).
Table 1 Comparison of general data between atrial fibrillation group and non-atrial fibrillation groupLASSO regression selectionUsing LASSO regression to select variables from 28 routine blood tests and biochemical indicators, including BMI, triglycerides, and blood sugar, the results showed that Lambda.min (λ = 0.002) and Lambda.1se (λ = 0.046) corresponded to two vertical lines, respectively (Fig. 3b). At Lambda.min, 22 predictive variables were selected, and at Lambda.1se, 3 predictive variables were selected. The three predictive variables selected at Lambda.1se were albumin, direct bilirubin, and uric acid (Fig. 3a).
Fig. 3
(a) LASSO regression model coefficient shrinkage path diagram. (b) LASSO regression cross-validation diagram
The relationship between atrial fibrillation and correlated variables in the elderly under different modelsIn elderly participants, we found that lower levels of albumin, higher levels of direct bilirubin, and uric acid were significantly associated with AF (P < 0.05). In the fully adjusted model (Model 2), we observed a negative correlation between albumin and AF (OR (95% CI) = 0.844 (0.783, 0.908)), indicating that for each unit increase in albumin, the prevalence of AF decreased by 15.6%. Direct bilirubin showed a positive correlation with AF (OR (95% CI) = 1.576 (1.431, 1.745)), suggesting that for each unit increase in direct bilirubin, the prevalence of AF increased by 57.6%. Uric acid also demonstrated a positive correlation with AF (OR (95% CI) = 1.003 (1.002, 1.004)), indicating that for each unit increase in uric acid, the prevalence of AF increased by 0.3%.
To better understand the potential associations between these three indicators and AF, we transformed them from continuous variables to categorical variables (quartiles). In Model 1, albumin [Q2, 0.574 (0.365, 0.896); Q3, 0.634 (0.406, 0.983); Q4, 0.361 (0.214, 0.591)] may be negatively associated with AF in the elderly population; direct bilirubin [Q2, 2.092 (1.104, 4.118); Q3, 4.122 (2.280, 7.860); Q4, 8.899 (5.055, 16.656)], and uric acid [Q3, 1.843 (1.143, 3.011); Q4, 2.091 (1.307, 3.393)] were significantly associated with AF in the elderly population. In Model 2, after adjusting for body mass index (BMI), hypertension, diabetes, fatty liver, gallstones, red blood cells, white blood cells, lymphocytes, and low-density lipoprotein cholesterol, albumin [Q4, 0.326 (0.182, 0.571)] may be negatively associated with AF in the elderly population; direct bilirubin [Q2, 2.189 (1.123, 4.426); Q3, 4.172 (2.062, 7.904); Q4, 9.074 (4.809, 18.102)], and uric acid [Q3, 1.961 (1.184, 3.288); Q4, 2.202 (1.319, 3.727)] were significantly positively associated with AF in the elderly population (Table 2).
Table 2 The relationship between atrial fibrillation and different characteristic variables in the elderly under different modelsGender stratified analysisIn elderly participants of different genders, after adjusting for BMI, hypertension, diabetes, fatty liver, gallstones, red blood cells, white blood cells, lymphocytes, and low-density lipoprotein cholesterol, we found that albumin, direct bilirubin, and uric acid had statistically significant associations with AF (P < 0.05). For males, albumin [Q3, 0.488 (0.268, 0.873); Q4, 0.216 (0.105, 0.424)]. The continuous variable showed that albumin was significantly negatively associated with AF in elderly males (OR = 0.831, 95% CI (0.760–0.905), P < 0.05), but not statistically significant in females (P > 0.05). For direct bilirubin, in males [Q3, 3.838 (1.727, 9.507); Q4, 8.067 (3.659, 19.965)], and in females [Q2, 8.13 (2.789, 26.401); Q3, 7.192 (2.287, 24.634); Q4, 24.519 (7.337, 51.253)]. The continuous variable confirmed that direct bilirubin was significantly positively associated AF in elderly males (OR = 1.501, 95% CI (1.338, 1.692), P < 0.05) and elderly females (OR = 2.006, 95% CI (1.559, 2.667), P < 0.05). For uric acid, in males [Q3, 2.685 (1.408, 5.322); Q4, 2.385 (1.237, 4.775)], and in females [Q4, 7.077 (2.391, 21.944)]. The continuous variable confirmed that uric acid was significantly positively associated with AF in elderly males (OR = 1.005, 95% CI (1.002, 1.008), P < 0.05) and elderly females (OR = 1.006, 95% CI (1.002, 1.012), P < 0.05) (Table 3).
Table 3 Gender stratified analysisAnalysis of the restricted cubic splinesAfter adjusting for BMI, hypertension, diabetes, fatty liver, gallstones, red blood cells, white blood cells, lymphocytes, and low-density lipoprotein cholesterol, RCS were used to assess the potential non-linear relationships between albumin (Fig. 4a), direct bilirubin (Fig. 4b) and uric acid (Fig. 4c) with atrial fibrillation in the elderly. The study found a significant non-linear relationship between direct bilirubin and atrial fibrillation (P for nonlinear < 0.05). In contrast, no statistically significant non-linear relationships were observed between albumin, uric acid, and atrial fibrillation (P for nonlinear > 0.05).
Fig. 4
Restricted cubic spline (RCS) curve for (a) ALB - Albumin (g/l) (b) DBIL - Direct Bilirubin (µmol/l) and (c) UA - Uric Acid (µmol/l) in relation to atrial fibrillation in the elderly population
The ROC analysis resultsThe ROC analysis results for ALB (albumin), DBIL (direct bilirubin), and UA (uric acid) indicated that the association strength of ALB with AF in the elderly is moderate (AUC = 0.591, 95% CI = 0.544–0.637), with a cutoff value of 43.15. The association strength of DBIL is accurate (AUC = 0.728, 95% CI = 0.686–0.769), with a cutoff value of 5.05. The association strength of UA is moderate (AUC = 0.626, 95% CI = 0.583–0.669), with a cutoff value of 355.52(Fig. 5).
Fig. 5
Receiver Operating Characteristic (ROC) Curve
留言 (0)