
記住我
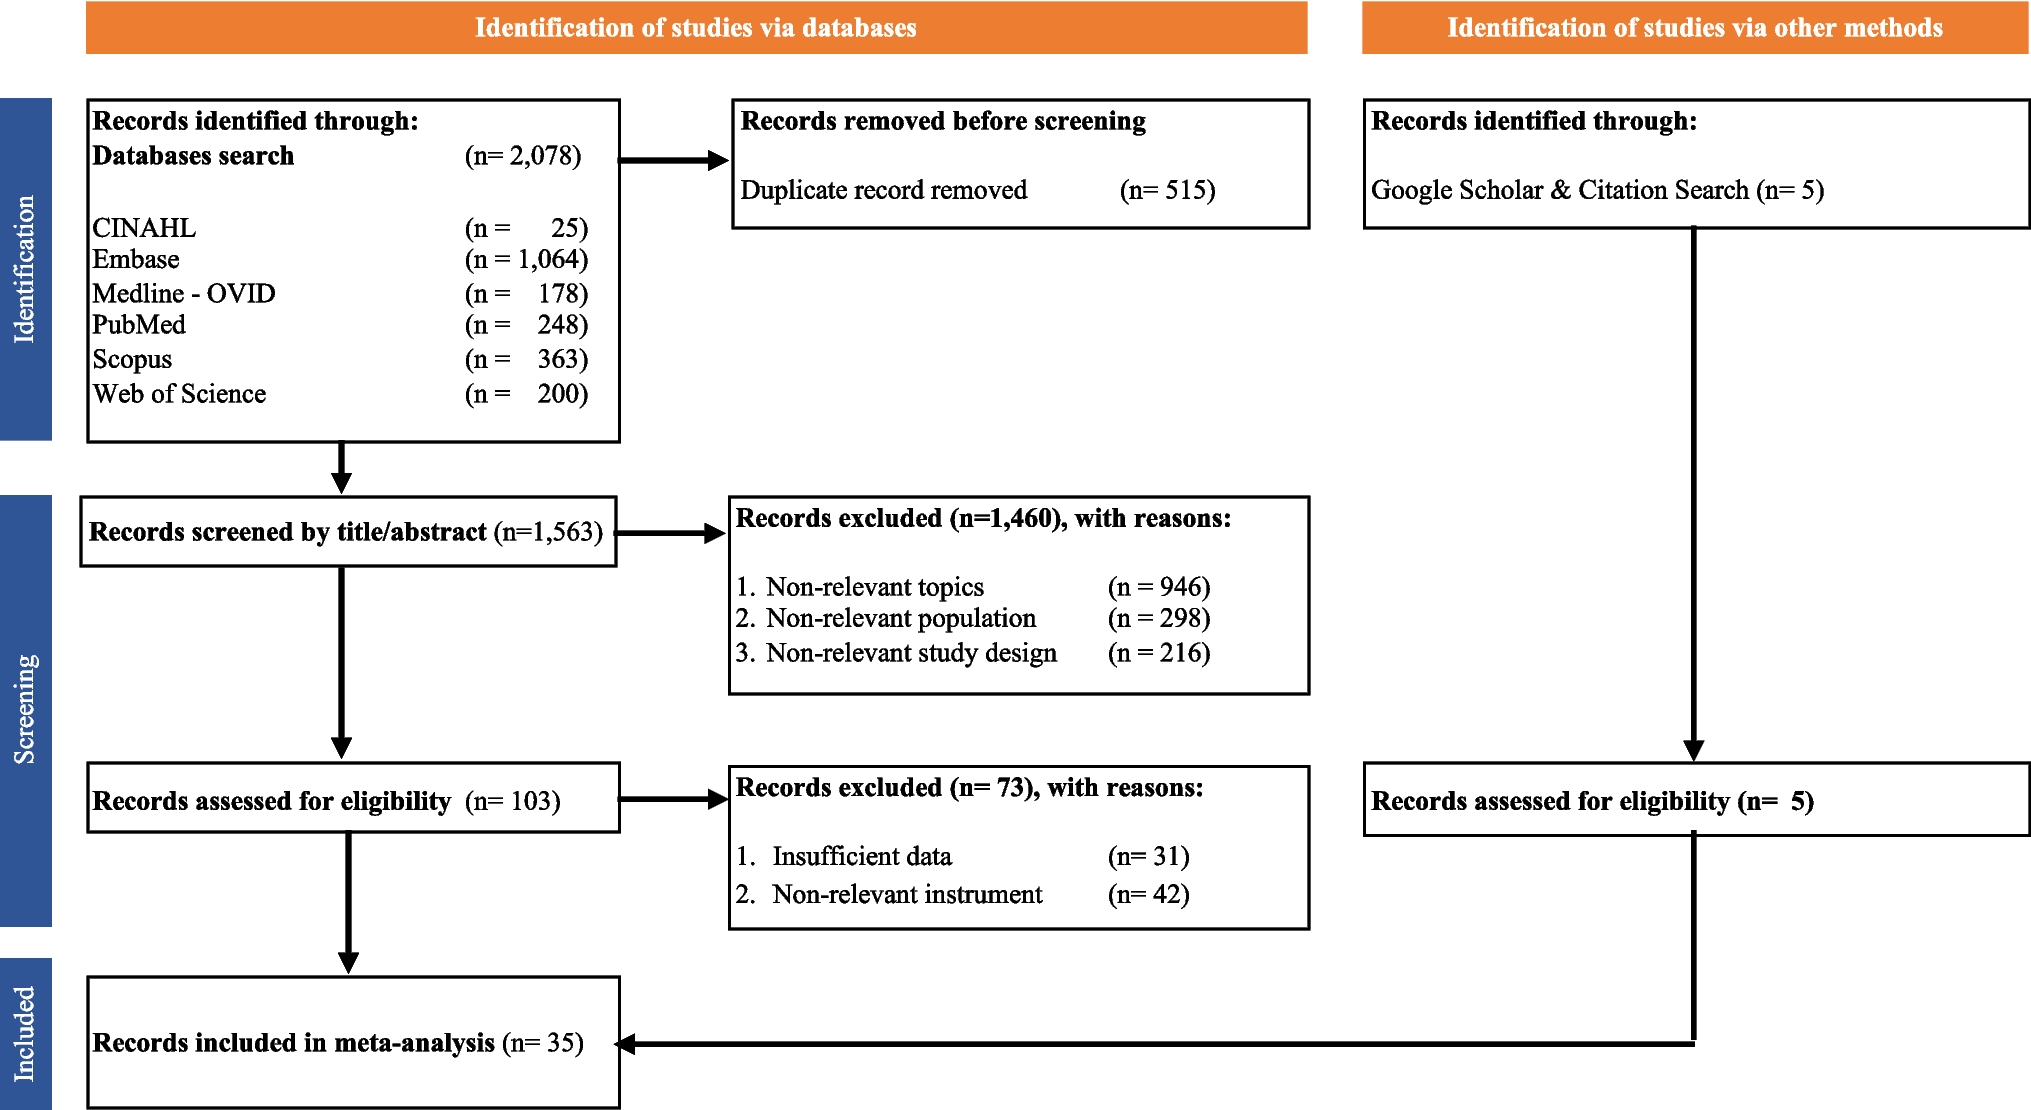
The study adopted a population-based, cross-sectional design and followed the COSMIN Study Design checklist for Patient-Reported Outcome Measures (PROMs) and STROBE guidelines for cross-sectional studies [13].
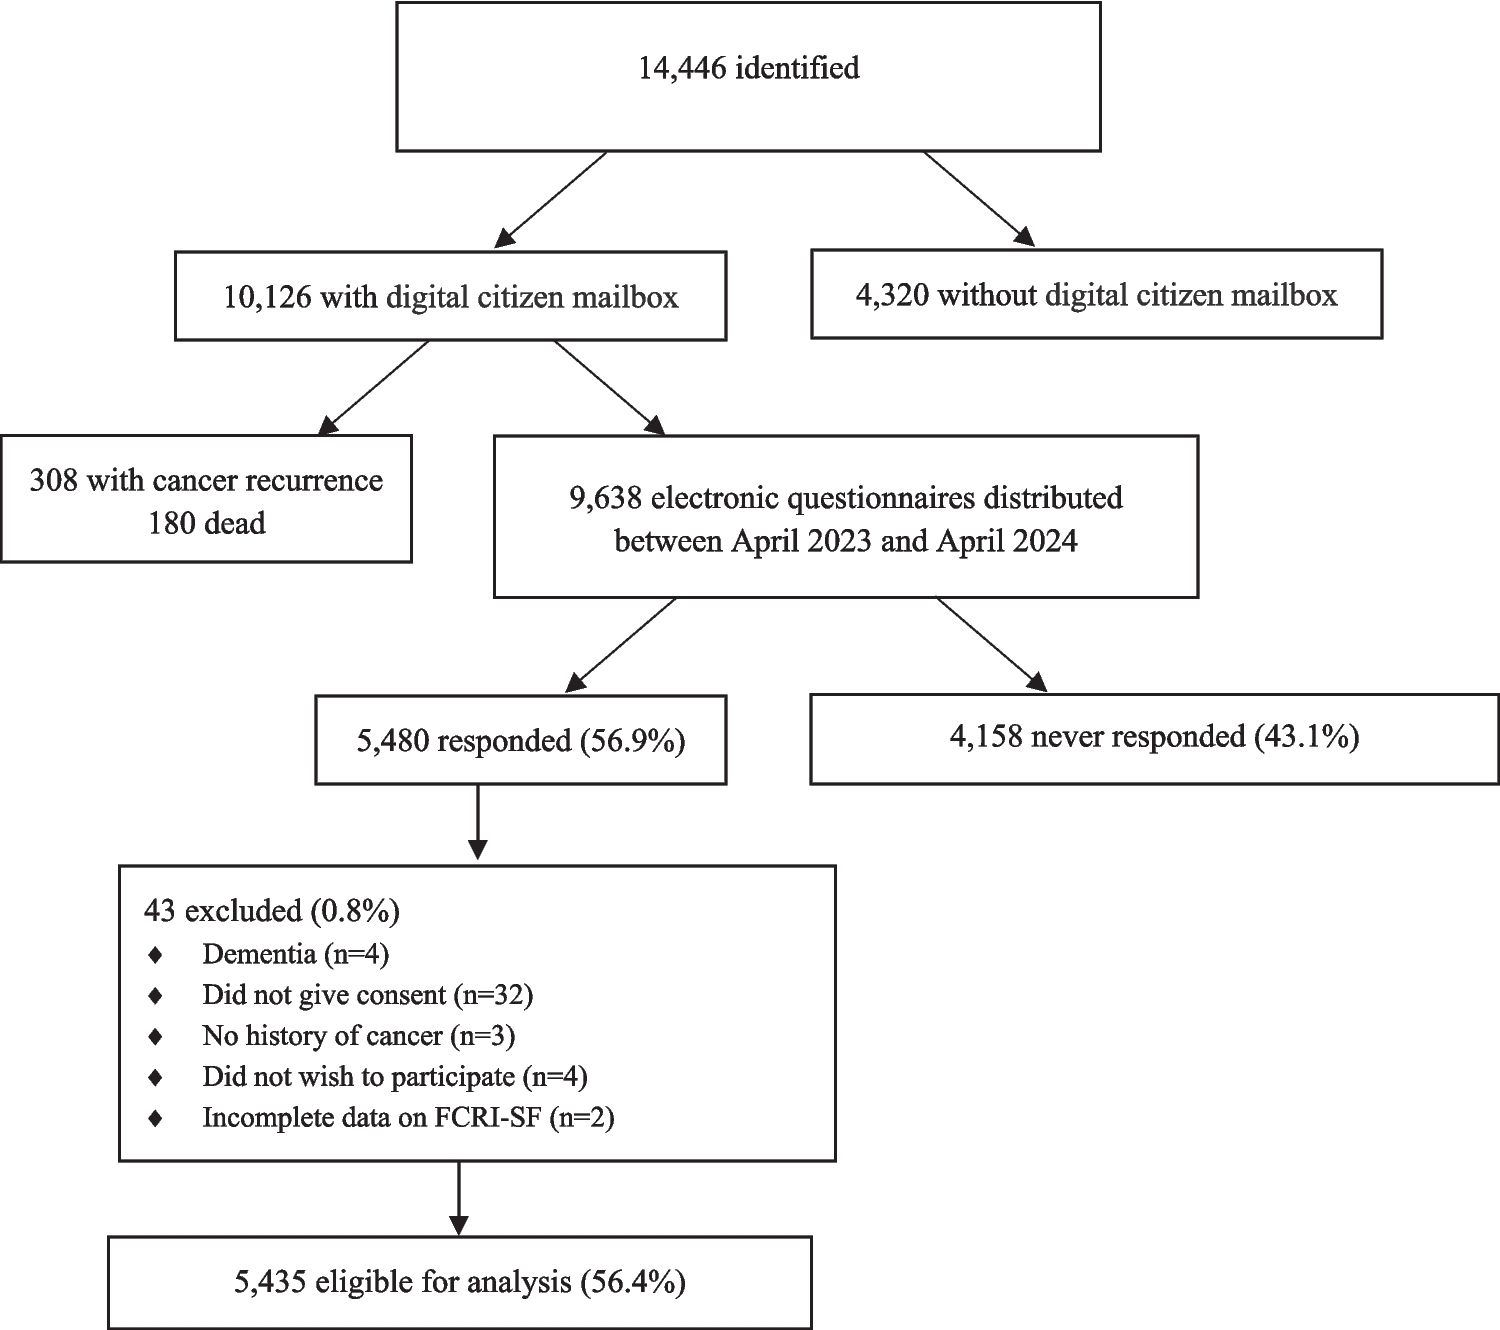
Study populationThe target population comprised all Danish CRCS aged 18 or above, diagnosed between March 2014 and December 2018, treated surgically with curative intent according to the Danish Colorectal Cancer Group’s (DCCG) prospective database, which holds information on 99% of patients with colorectal cancer in Denmark [14]. The study was approved by The Regional Committees on Health Research Ethics for Southern Denmark (Project-ID: S-20190061).
Study procedureElectronic surveys from “Vejle Hospital” were distributed to a digital citizen mailbox between May 2023 and May 2024. In case of no response, two reminders were sent out after 10 and 20 days. Reasons for non-participation were occasionally reported by phone or email to the primary investigator. Death was noted by automatic email return. Consent for the use of responses in research was obtained through the survey. The completed questionnaires were directly uploaded into the REDCap database for clinical research.
The surveyParticipants were invited to complete an electronic questionnaire to screen for physical and psychological symptoms and health-related quality of life (HRQoL).
Patient-Reported Outcomes (PROMs) 1.Fear of cancer recurrence
FCR was measured by the 9-item Fear of Cancer Recurrence Inventory-Short Form (FCRI-SF) [6, 15]. The FCRI-SF is the most widely validated and used screening tool with response categories ranging from not at all/never (0) to a great deal/all the time (4). Scale scores range from 0 to 36 with higher scores indicating greater FCR severity. Originally, two cutoff scores were proposed and validated (a cutoff of 13/36 to indicate any level of FCR and a cutoff of 16/36 to indicate potential severe FCR). More recently, a cutoff of 22 has been suggested for identifying clinical cases of FCR according to clinical interview [16]. The sensitivity of this high cutoff has been reported to be 90% and the specificity 83.3%. Survivors were categorized into groups according to FCRI-SF score: nonclinical FCR (nFCR, FCRI-SF score ≤ 13), subclinical FCR (sFCR, FCRI-SF score 13–21), and clinical FCR (cFCR, FCRI-SF score ≥ 22). All respondents were informed about their level of FCR based on the FCRI-SF.
2.Anxiety and depression
Anxiety and depression were measured with the Symptom Checklist-90-R (SCL) [17] subscales [18] for anxiety (SCL-anx, 4 items) and depression (SCL-dep, 6 items). The SCL measures symptoms of anxiety and depression during the previous 4 weeks on a scale ranging from 0 (not at all) to 4 (extremely). Scale scores range from 0 to 16 for anxiety and 0 to 24 for depression. Higher scores indicate higher severity of symptoms. The SCL has undergone psychometric testing as a part of the Common Mental Disorder Questionnaire (CMDQ) in a primary care setting with 701 patients [18, 19]. SCLs ability to correctly classify those with ICD-10 diagnoses above/below cutoff compared to psychiatric research interview (SCAN) were excellent with an area under the curve for SCL-dep (cutoff ≥ 9) on 0.88 (95% CI 0.84–0.91) and for SCL-anx (cutoff ≥ 6) on 0.87 (95% CI 0.82–0.92) [18].
3.Health anxiety
Health anxiety was measured with the Whiteley-6-R Index [20]. The Whiteley-6-R Index measures symptom of health anxiety during the previous 4 weeks on a scale ranging from 0 (not at all) to 4 (extremely). Scale scores range from 0 to 24. Higher scores indicate higher severity of symptoms. The Whiteley-6-R has been validated in a general population sample of 9656 individuals showing good content validity (relevance) with a low number of missing responses on all items, good construct validity evaluated by structural validity (exploratory factor analysis and confirmatory factor analysis), and good convergent and discriminant validity (hypothesis testing) [20]. Criterion validity has been examined with excellent results against an interview-based diagnosis of health anxiety as a gold standard in a sample of 1590 individuals in the general population with an area under the curve on 0.88 (95% CI 0.84–0.92) [20]. No established cutoff for the Whiteley-6-R has been published to date. However, a recent randomized controlled trial from the Department of Functional Disorders at Aarhus University Hospital, Denmark [21], used a cutoff of > 21.4 (scale 0–100) on the Whiteley-7 Index, which corresponds to ≥ 6 on the Whiteley-6-R (scale 0–24). This cutoff is adopted in the present study and will be assessed further in an upcoming publication.
4.Physical symptoms
Physical symptoms were identified by the Bodily Distress Syndrome (BDS) checklist [22]. The BDS checklist measures physical load on a scale from 0 (not at all) to 4 (extremely). The 25-item checklist covers symptoms related to cardiopulmonary symptoms, bowel symptoms, musculoskeletal symptoms, and general symptoms, including tiredness.
Colorectal cancer-specific symptoms were defined using four items from the BDS checklist: frequent, loose stools; abdominal pain; abdominal bloating, tension, or heaviness, and diarrhea. These were supplemented with three additional items covering well-known late effects after colorectal cancer with the same response categories: Involuntary passage of air and/or loose stool, urgent bowel movement, and difficulty emptying the bowels during toilet visits. The remaining items from the BDS checklist were categorized as non-colorectal cancer-specific symptoms and were supplemented with four new items: altered sexual function, involuntary bladder leakage, frequent urination, and difficulty emptying the bladder as sexual and urinary symptoms are also common after colorectal cancer, but not assessed by the BDS checklist.
5.Health state and health-related quality of life
Health state was assessed by the EQ-5D-5L [23], which includes five domains (mobility, self-care, usual activities, pain, and anxiety/depression). Each domain is assessed on a five-level scale, ranging from 1 (no problems) to 5 (extreme problems). HRQoL was assessed using the single visual analogue scale (EQ-VAS) where participants were asked to self-rate their overall quality of life TODAY on a VAS scale ranging from 0 to 100 with 0 being “The worst health you can imagine” and 100 being “The best health you can imagine.” A difference 10 out of 100 points between groups was considered significant.
6.Clinical characteristics and sociodemographic information
Purpose-designed questions regarding the time since the last cancer surveillance visit, time until the next visit, and the receipt of chemotherapy and/or radiation were included. Furthermore, the participants were asked to report marital status, employment status, educational level, citizenship (Danish or other), and children (yes or no). In case of a FCRI-SF score ≥ 22, participants were automatically asked whether they were interested in information about a trial specifically developed for treatment of FCR [24].
Registry dataThe following demographic and clinical characteristics were available through the Danish Clinical Quality Program – National Clinical Registries (RKKP): age and gender, cancer type (colon or rectum), date of diagnosis, tumor stage, and if the patient was diagnosed as consequence of colorectal cancer screening (yes/no).
Data cleaningResponses were excluded in case of cancer recurrence, or if “dementia,” “terminal/too somatic ill,” or “dead” were communicated by caregivers to the primary investigator by telephone or email. If the survivor indicated “no memory of cancer” (often surgical removal of a polyp) or “do not want to participate” (often because the participant did not want to be reminded of the cancer period) their response was excluded. Responses without consent for research use were also excluded as were cases with incomplete demographic data. Finally, completion of all FCRI-SF items was mandatory; however, one respondent exited the questionnaire before completing the FCRI-SF and was subsequently excluded from the analysis.
Statistical analysesDescriptive statistics were reported for each FCR severity group as absolute number/percentages or range for demographic measures. To minimize the risk of type 1 errors, differences in percentages between groups exceeding 10% were deemed clinically relevant rather than relying on statistical testing. Factors predicting interest in engaging in treatment for FCR were investigated with chi-squared test and one-way ANOVA. Logistic regression models were used to estimate the odds ratio (OR) of having sFCR and cFCR compared to nFCR depending on symptom severity, adjusted for possible confounders (gender, age, marital status, education, employment status, having children, language, and citizenship). A Directed Acyclic Graph (DAG) [25] was made at DAGitty.net to identify the confounders to include in the minimal adjustment set (Supplementary File 1, Fig. 1). The logistic regression models were extended to include symptoms that were weakly correlated (Pearson correlation coefficient < 0.3) with each other to avoid multi-collinearity. Sensitivity analyses excluding patients with survival durations under 5 years were conducted for all outcomes. Symptoms of anxiety and depression were dichotomized according to established cutoffs and included in the models. All physical symptoms were divided into severity with “No symptoms” corresponding to 0, “Mild symptoms” corresponding to 1 or 2, and “Severe symptoms” corresponding to 3 or 4. In case of missing items within the PROMs, the item was replaced with a 0 indicating a conservative approach assuming that the symptom in question was not present. If more than half of items were missing, the sum score was not calculated. No imputation was performed. Statistical analyses were performed using STATA 17 (Stata Corp., College Station, TX, USA).
Fig. 1
留言 (0)