Improving myocardial perfusion MRI is critical for assessing perfusion defects, requiring a balance between high spatial resolution, temporal fidelity, and slice coverage (1–3). Clinically, sufficient spatial resolution is necessary to detect subtle perfusion abnormalities but achieving enough spatial resolution (<3.0 mm) (4) and extensive slice coverage is particularly challenging under high heart rate conditions. The need to capture more slices (≥3 slices) within a short acquisition window further complicates the ability to fully resolve both motion and perfusion dynamics (5).
Recent techniques such as parallel imaging and compressed sensing (6–8), using both Cartesian (2) and non-Cartesian sampling (7, 9), have made progress in accelerating acquisition and increasing resolution in myocardial perfusion MRI. However, there remains open questions regarding the trade-offs between spatial and temporal fidelity, motion correction (10), as well as the potential for residual artifacts (11). Moreover, these methods typically require the complete acquisition of the entire temporal series to apply temporal regularization (1, 2) and motion correction, which can hinder the ability to display real-time images during contrast inflow and washout.
Given the ongoing challenges, there remains a need for alternative strategies to increase imaging speed for high temporal resolution and expanded slice coverage while simultaneously maintaining spatiotemporal fidelity. Low-resolution (LR) acquisitions inherently allow for faster imaging and higher signal-to-noise ratio (SNR), which can be crucial for capturing rapid contrast changes and minimizing the effects of cardiac and respiratory motion. By leveraging super-resolution (SR) methods (12, 13), these images can be enhanced to achieve higher spatial fidelity, offering a balance between imaging speed and diagnostic quality.
However, low-resolution perfusion may suffer from reduced spatial details and fidelity, as well as more severe dark rim artifacts and partial volume effects (14). These artifacts can interfere with accurate perfusion analysis and affect diagnostic outcomes. To address this, strategies must be developed to compensate for the loss of spatial resolution and mitigate artifacts. Recent advances in deep learning, particularly generative models, provide a promising way for enhancing the quality of LR images in cardiac MR imaging (15–18). However, Generative Adversarial Networks (GAN) are prone to experience unstable training and mode collapse issues (19). In contrast, diffusion models have proven to produce high-quality images with robust training stability and superior image quality (12, 20–21). Additionally, diffusion generative models offer a robust mechanism for improving spatial resolution of myocardial perfusion MRI without relying on temporal regularization. Previous studies have investigated GAN-based generative models on cardiac MRI (15, 18), but applying generative models to myocardial perfusion MRI has not been explored. By conditioning the diffusion model on low-resolution perfusion images, it is possible to enhance image detail while retaining the benefits of rapid acquisition, high temporal resolution and expanded slice coverage.
We propose to develop a conditional diffusion-based generative model for myocardial perfusion MRI super resolution, termed PerfGen, that leverages existing clinical imaging protocols and data to generate myocardial perfusion images conditioned by low-resolution images. This study explores the proof-of-the-concept that diffusion generative models can be integrated with myocardial perfusion MRI to synthesize high-resolution (HR) perfusion images and demonstrated its feasibility to accelerate the acquisition. This model provides an alternative solution that balances spatial resolution, temporal fidelity, and slice coverage, offering a new way for efficient and high-quality myocardial perfusion MRI.
2 Materials and methods 2.1 Data acquisition and preprocessingAll patients provided informed consent, and all studies were performed in accordance with protocols approved by our institutional review board.
2.1.1 Retrospective myocardial perfusion dataDynamic contrast-enhanced (DCE) perfusion data were collected from 47 heart disease patients using standard clinical MRI protocols at the University of Missouri-Columbia Hospital. The dataset was divided into an 80:20 split, with 38 patients for training and 9 patients for testing. Each subject had 3 short-axis slices (base, mid, and apex), with all temporal frames used, resulting in a total of 8,040 images for training and 1,830 images for testing. A mixed dataset with both rest and stress perfusion data were collected using gadolinium contrast for perfusion and Regadenoson for stress with free breathing acquisition. Prospective electrocardiogram triggering was used for all patients. Within the training group, 15 patients underwent rest perfusion only, and 23 underwent stress perfusion only. For the testing group, 3 subjects were assessed under rest conditions and 6 under stress. All testing data and most training data were acquired on a 1.5 T MAGNETOM Aera (Siemens Healthineers), except for 4 subjects from the training group were imaged using a 3 T MAGNETOM Vida (Siemens Healthineers).
Imaging parameters for the gradient echo perfusion sequence included a repetition time of 2.2–2.3 ms, echo time of 1.08 ms, flip angles between 12° and 15°, resolution of 2.3–2.4 mm × 2.3–2.4 mm, 60–80 temporal measurements, and a GRAPPA acceleration rate of 2. We use chest and spine phased-array receiver coils (20–34 channels) with an acquisition matrix of 160 × 120–160, a temporal resolution of 138–184 ms per slice, a saturation pulse delay of 100–120 ms, and acquire 3 slices per R-wave peak to R-wave peak (RR) interval.
2.1.2 Prospective myocardial perfusion dataNine DCE rest perfusion patient data were collected at University of Missouri-Columbia Hospital using a 3 T MAGNETOM Vida (Siemens Healthineers), with 8 acquired using GRAPPA-3 and 1 using GRAPPA-2. Prospective electrocardiogram triggering was used for all patients. Five to six short-axis myocardial perfusion slices were acquired per RR interval during free breathing. Imaging parameters of the gradient echo perfusion sequence included a repetition time of 2.2–2.3 ms, echo time of 1.08 ms, flip angles between 12° and 15°, resolution of 2.3–2.4 mm × 2.3–2.4 mm, 60 temporal measurements, and a GRAPPA acceleration rate of 2–3. Late gadolinium enhancement (LGE) imaging was used as a reference for validating the super-resolved perfusion defects, particularly in the presence of late enhanced regions. The acquisition matrix size is 160 × 48–62 following a 35%–36% low-resolution acceleration, with 16–22 actual phase encoding lines acquired using GRAPPA-3. The temporal resolution was 36.8–50.6 ms per slice, with an inversion time of 100 ms for the saturation pulse, resulting in a total acquisition time of 118.4–125.3 ms per slice. For the GRAPPA-2 data, the acquisition matrix size is 176 × 62 following a 35% low-resolution acceleration, with 32 actual phase encoding lines acquired using GRAPPA-2. The temporal solution was 73.6 ms per slice, resulting in a total acquisition time of 136.8 ms.
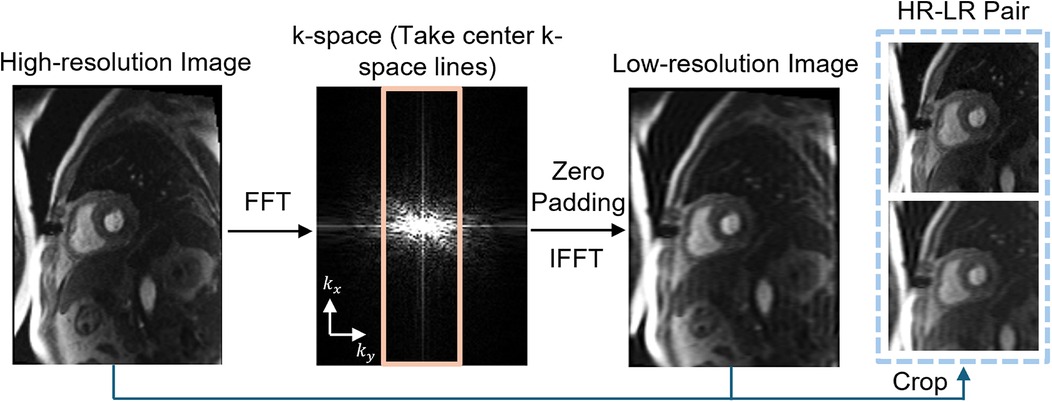
2.1.3 Low-resolution data preparationTo simulate LR perfusion data from HR perfusion images for model training, we used the following steps to generate LR and HR pairs (Figure 1). Fast Fourier Transform was applied to the original HR magnitude image to convert to k-space domain for retrospective experiments. The center 30%–50% of the phase-encoding lines were used, with the dynamic low-resolution ratio aiming for data augmentation. The outer k-space lines were zero-padded with the data in the readout maintained and converted back to the image domain using an inverse fast Fourier transform followed by taking the absolute value. Both the synthesized LR images and paired HR images were cropped to the same central 96 × 96 matrix size followed by the image normalization. The cropping was performed manually to position the heart within the cropped region. On-the-fly data augmentation included random vertical flip and horizontal flip, each applied with a probability of 50%. HR perfusion images served as the reference, and the LR synthetic images were enhanced using zero-padding and PerfGen. In the prospective study, the multi-coil complex-valued k-space data was truncated by setting the phase resolution to 35% in the sequence.

Figure 1. Illustration of the framework of synthetic data pipeline. High-resolution (HR) myocardial perfusion images are processed to generate synthetic low-resolution (LR) images. This involves Fast Fourier transform (FFT) of the perfusion image, taking the center k-space lines, applying zero-padding, and performing an inverse FFT (IFFT), resulting in paired HR and LR images.
2.2 Conditional generation with denoising diffusion probabilistic modelsGiven a dataset of LR-HR perfusion MRI pairs, D=(xi,yi}i=1N, which are samples from an unknown conditional distribution of high-resolution myocardial perfusion MRI domain, a parametric approximation of p(y|x) was learned through a stochastic iterative refinement process that maps the source LR image x to target HR image y0^. We adapted the Denoising Diffusion Probabilistic Models (DDPM) and Image Super-Resolution via Iterative Refinement (SR3) (12) to generate HR MR perfusion images from LR image through diffusion process.
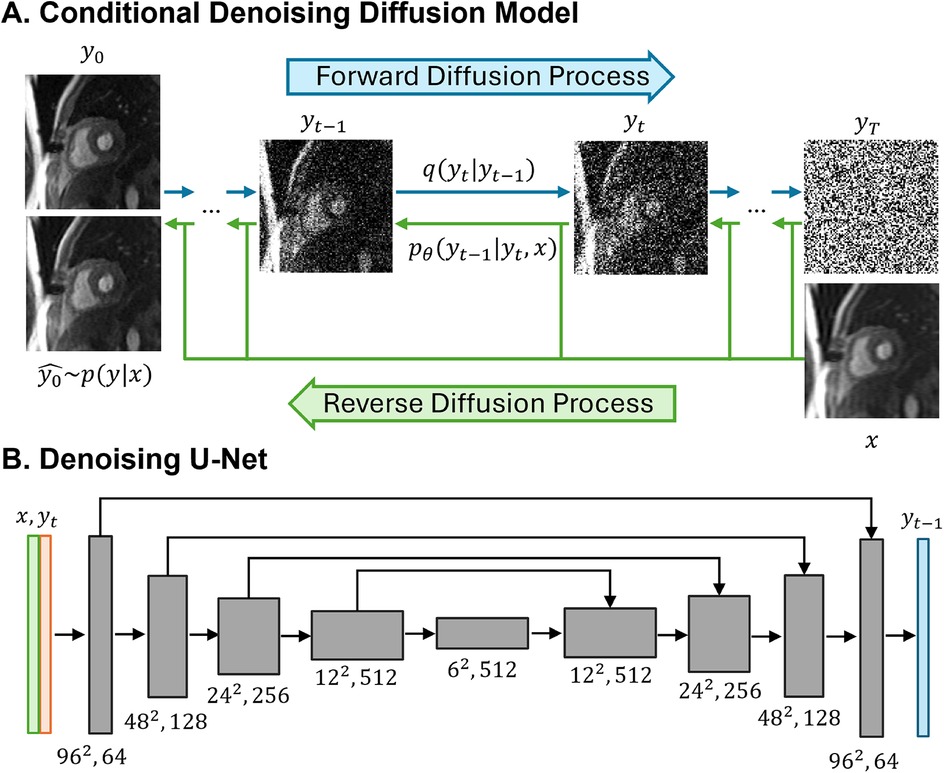
Figure 2A provides an illustration of a conditional diffusion-based model to map Gaussian noise yT to a HR image y0^, conditioned on the source LR image x. The forward diffusion process q follows the Markov process to gradually add Gaussian noise to the HR perfusion image y0 step by step until the image converges to a pure Gaussian distribution yT. The reverse process p utilizes a U-Net model (22), trained to conditionally denoise the image to reconstruct a HR perfusion image y0^ using the LR perfusion image x as the guidance.

Figure 2. Illustrations of the conditional denoising diffusion model and the denoising U-Net architecture. (A) The forward diffusion process q (left to right) gradually add noise to the high-resolution image y over T steps until it converges to pure Gaussian noise y. The reverse diffusion process p (right to left) iteratively denoises the noisy images, conditioned on the low-resolution (LR) image x, to recover the high-resolution image. (B) The input to the U-Net is composed of two channels: the LR image x concatenated with the noisy image y at timestep t. The model outputs the denoised image y.
2.2.1 Forward diffusion processThe forward diffusion process gradually added Gaussian noise to the HR perfusion image y0 over T iterations until the image converges to a Gaussian distribution via the diffusion kernel (Equation 1). Equation 2 provides the complete generation process.
q(yt|yt−1)=N(yt|αtyt−1,(1−αt)I),(1)q(y1:T|y0)=∏t=1Tq(yt|yt−1),(2)
where αt,1≤t≤T are variance schedule subject to 0<αt<1, I is the identity matrix. T is set to 2,000, and the added Gaussian noise to the HR image generated a sequence of noisy images with increasing noise level y∈[y1,y2,…,yT].
Specifically, q(yt) can be obtained directly from y0 at any time step without iterations where γt=∏i=1tαt (Equation 3).
q(yt|y0)=N(yt|γty0,(1−γt)I),(3)
2.2.2 Reverse Diffusion ProcessThe reverse diffusion process is defined as a reverse Markov process, starting from Gaussian noise yT and progressively denoised to reconstruct the HR perfusion images y0^ (Equations 4–6):
pθ(y0:T|x)=p(yt)∏t=1Tpθ(yt−1|yt,x),(4)
p(yT)=N(yT|0,I),(5)
pθ(yt−1|yt,x)=N(yt−1|μθ(x,yt,γt),σt2I)(6)
pθ(yt−1|yt,x) is the posterior distribution to be learned, distribution variance σt2 is fixed to be 1−αt, distribution mean μθ(x,yt,γt) is reparametrized as (Equation 7):
μθ(x,yt,αt)=1αt[yt−1−αt1−γtfθ(x,yt,γt)](7)
where fθ(x,yt,γt) is the denoising model which takes the source LR perfusion image x and a noisy image yt to predict the noise ϵ.
After the parametrization, each denoising step in the reverse process will be (Equation 8):
yt−1←1αt[yt−1−αt1−γtfθ(x,yt,γt)]+1−αtϵt(8)
where fθ(x,yt,γt) is the denoising model, ϵt is the predicted noise at step t with ϵt∼N(0,I).
2.2.3 Model implementationWe adapted the SR3-DDPM model to super-resolve a 2D low-resolution MR perfusion image into a HR image. The denoiser is achieved using a U-Net model and the optimization that employs KL-divergence to maximize the likelihood of the generated HR images y0^ and the ground truth HR image y0. L1-loss between the noise predicted by the network and the amount of noise added was used, and the objective function for training fθ was defined as (Equation 9):
argminθL=‖fθ(x,γy0+1−γϵ,γ)−ϵ‖11(9)
where fθ represents the denoising U-Net model, x is the LR image, y is the corresponding HR image, ϵ is the added noise with ϵ∼N(0,I), γ is a scalar parameter related to the variance scheduler with γt=∏i=1tαt.
The model starts with pure Gaussian noise and a LR perfusion image, using the corresponding HR perfusion image as the ground truth. The model will iteratively refine the noisy output through a U-Net model trained to denoise at various noise levels and generate images with the desired HR perfusion data distribution. By using the LR perfusion MR image to condition the generation process, the SR image is specifically determined to maintain anatomical consistency similar to the original LR perfusion images.
In the U-Net architecture (Figure 2B), the input comprised two channels representing the LR image and the noisy image, and one output channel, representing the generated less noisy HR images. The LR and HR pairs in our synthesis pipeline maintained the same matrix size, and the conditioning LR image was used at the shallowest level of the U-Net by channel-wise concatenating with the noisy image. Both the LR image and noisy image at time step t were encoded through a convolutional layer followed by two linear layers for further encoding. The U-Net structure was composed of convolution, group normalization, Swish activation, residual connections and pooling layers. The U-Net structure consisted of five levels, with the number of channels in each level being [64,128,256,512,512]. Each level contained two ResNet blocks (23) with a dropout rate of 0.2. At the bottleneck, an additional self-attention was applied after the convolution layers. The self-attention module employs convolutional layers to compute the query, key, and value representations for spatial attention. It is followed by another convolutional layer to refine the output and is interleaved with the original ResNet block at the bottleneck for enhanced feature representation. Detailed model architecture was depicted in Supplementary Figure S1.
PerfGen was implemented using Python and PyTorch on two 48GB NVIDIA A6000 GPUs. PerfGen had 92M trainable parameters. The model was trained for 50,000 iterations with AdamW optimizer with a learning rate of 3e-5 and a batch size of 128. During inference, we used DDPM sampling with full inference steps (T = 2,000).
2.3 Model evaluationFor synthetic data, to compare PerfGen with GAN-based super-resolution model trained on cardiac MRI (15), normalized Root-Mean-Square-Error (nRMSE), Peak Signal-to-Noise Ratio (PSNR), and Structural Similarity Index (SSIM) were calculated, using original HR images as reference. The metrics were evaluated within the 96 × 96 field of view, focusing specifically on the heart region. The nRMSE (24) was calculated as (Equation 10):
nRMSE=1max(I)−min(I)1N∑i=0N−1(I~i−Ii)2(10)
where I~ is SR images super-revolved by PerfGen or GAN, I is the reference HR image, N is the total number of pixels, I~i and Ii are the pixel intensities at position i in the SR and HR images, respectively. PSNR (25) was calculated as (Equation 11):
PSNR=10×log10(25521N∑i=0N−1(I~i−Ii)2)(11)
SSIM (26) was calculated as (Equation 12):
SSIM=(2μI~μI+c1)(2σI,~I+c2)(μI~2+μI2+c1)(σI~2+σI2+c2)(12)
where μI~ and μI are the average and variance of I~ and I, σI,~I is the covariance of I~ and I, and c1 and c2 are constants to prevent division by a near-zero denominator.
Differences between GAN super-resolved images and PerfGen super-resolved images were statistically tested using a paired t-test (P < 0.05). For prospective data, images super-resolved by two methods were qualitatively compared with LGE images at matched slice position to identify perfusion defects. One cardiologist and one radiologist scored prospectively acquired datasets on a 1–5 scale (1 being the worst and 5 being the best), assessing perfusion image sharpness and overall quality relative to clinical perfusion image standards. Differences between methods were assessed with the Wilcoxon signed-rank test.
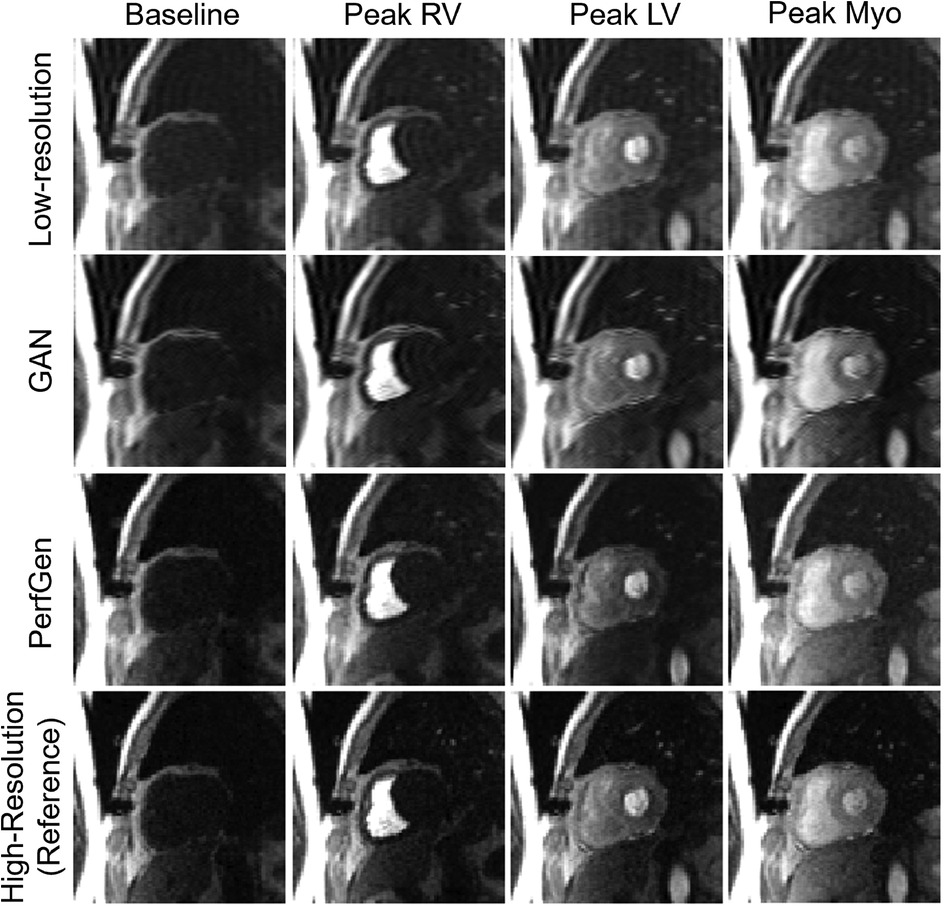
3 Results 3.1 Model validation with synthetic data 3.1.1 Qualitative comparisonFigure 3 compares the myocardial perfusion images across different phases of contrast enhancement during first-pass perfusion using synthetic test data. The PerfGen super-resolved images are compared to LR, GAN super-resolved and HR reference images at baseline, peak right ventricle (RV), peak left ventricle (LV), and peak myocardium (Myo). The results show an improvement in the image resolution and contrast for the PerfGen super-resolved images, allowing for enhanced visualization of contrast perfusion through the myocardium. The enhanced detail provided by PerfGen aligned better with the HR reference images than LR and GAN methods.

Figure 3. Comparison of myocardial perfusion images across perfusion phases for one retrospective test data. From left to right, the images show the perfusion image at baseline, peak right ventricle (RV), peak left ventricle (LV), and peak myocardium (Myo). Each column represents different time points, illustrating the progression of contrast perfusion through the myocardium, highlighting key cardiac phases with distinct contrast enhancement in the RV, LV, and myocardial tissue. Each row shows the low-resolution images, GAN-based super-resolved images, PerfGen super-resolved perfusion images, and high-resolution reference images.
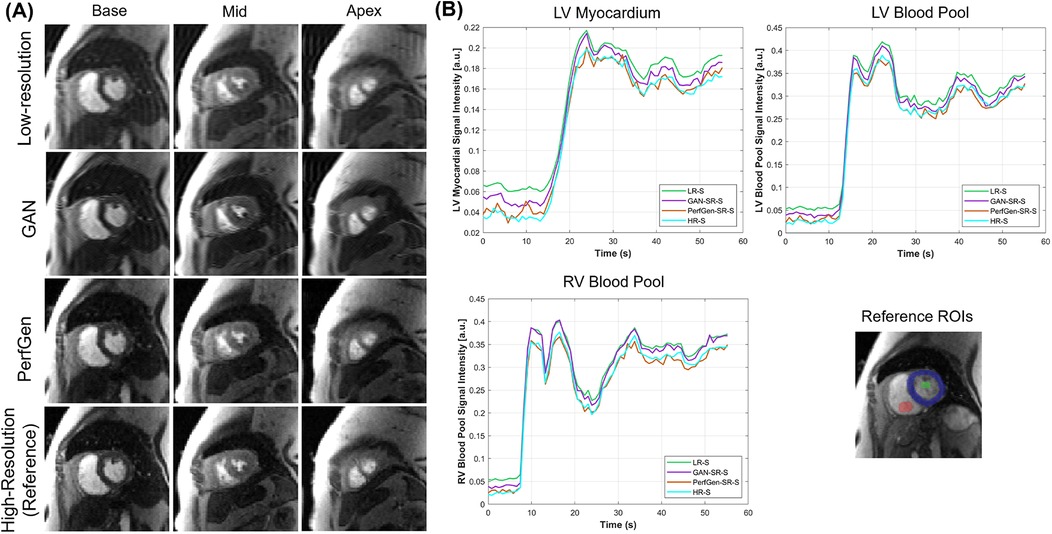
Figure 4A further demonstrates the evaluation of the PerfGen by comparing myocardial perfusion images at the basal, midventricular, and apical slice locations. The PerfGen super-resolved images show enhanced resolution and structural details across all slice locations compared to the HR reference. Figure 4B shows the signal-t plot illustrating the changes in the LV myocardial region, LV blood pool, and RV blood pool. The spatially super-resolved images demonstrate better alignment with the reference high-resolution spatial images compared to the acquired LR spatial images and GAN-based super-resolved images.

Figure 4. (A) Comparison of GAN-based super-resolved images, PerfGen super-resolved images and high-resolution (HR) perfusion images across different slice locations for one synthetic test data. From left to right, the myocardial perfusion images are shown at the base, midventricular, and apical slice locations. The top row showed low-resolution (LR) images, the following rows showed GAN-based and PerfGen super-resolved images, and the bottom row showed the corresponding HR reference images. This comparison highlights the effectiveness of PerfGen in enhancing image resolution and better alignment with reference images than GAN-based approach across various slice locations of the heart. (B) The signal-t plots illustrate the signal intensity of the basal slice in (A) in terms of the left-ventricular (LV) myocardial region, LV blood pool and right-ventricular (RV) blood pool changes over time. The spatially super-resolved images by PerfGen (PerfGen-SR-S) aligns better with the reference HR spatial images (HR-S) than the acquired LR spatial images (LR-S) and the GAN-based super-resolved images (GAN-SR-S).
Figure 5 presents example cross-sectional time-intensity profiles from the subject shown in Figure 4, comparing LR images, GAN super-resolved images, PerfGen super-resolved images, and reference HR
留言 (0)