
記住我


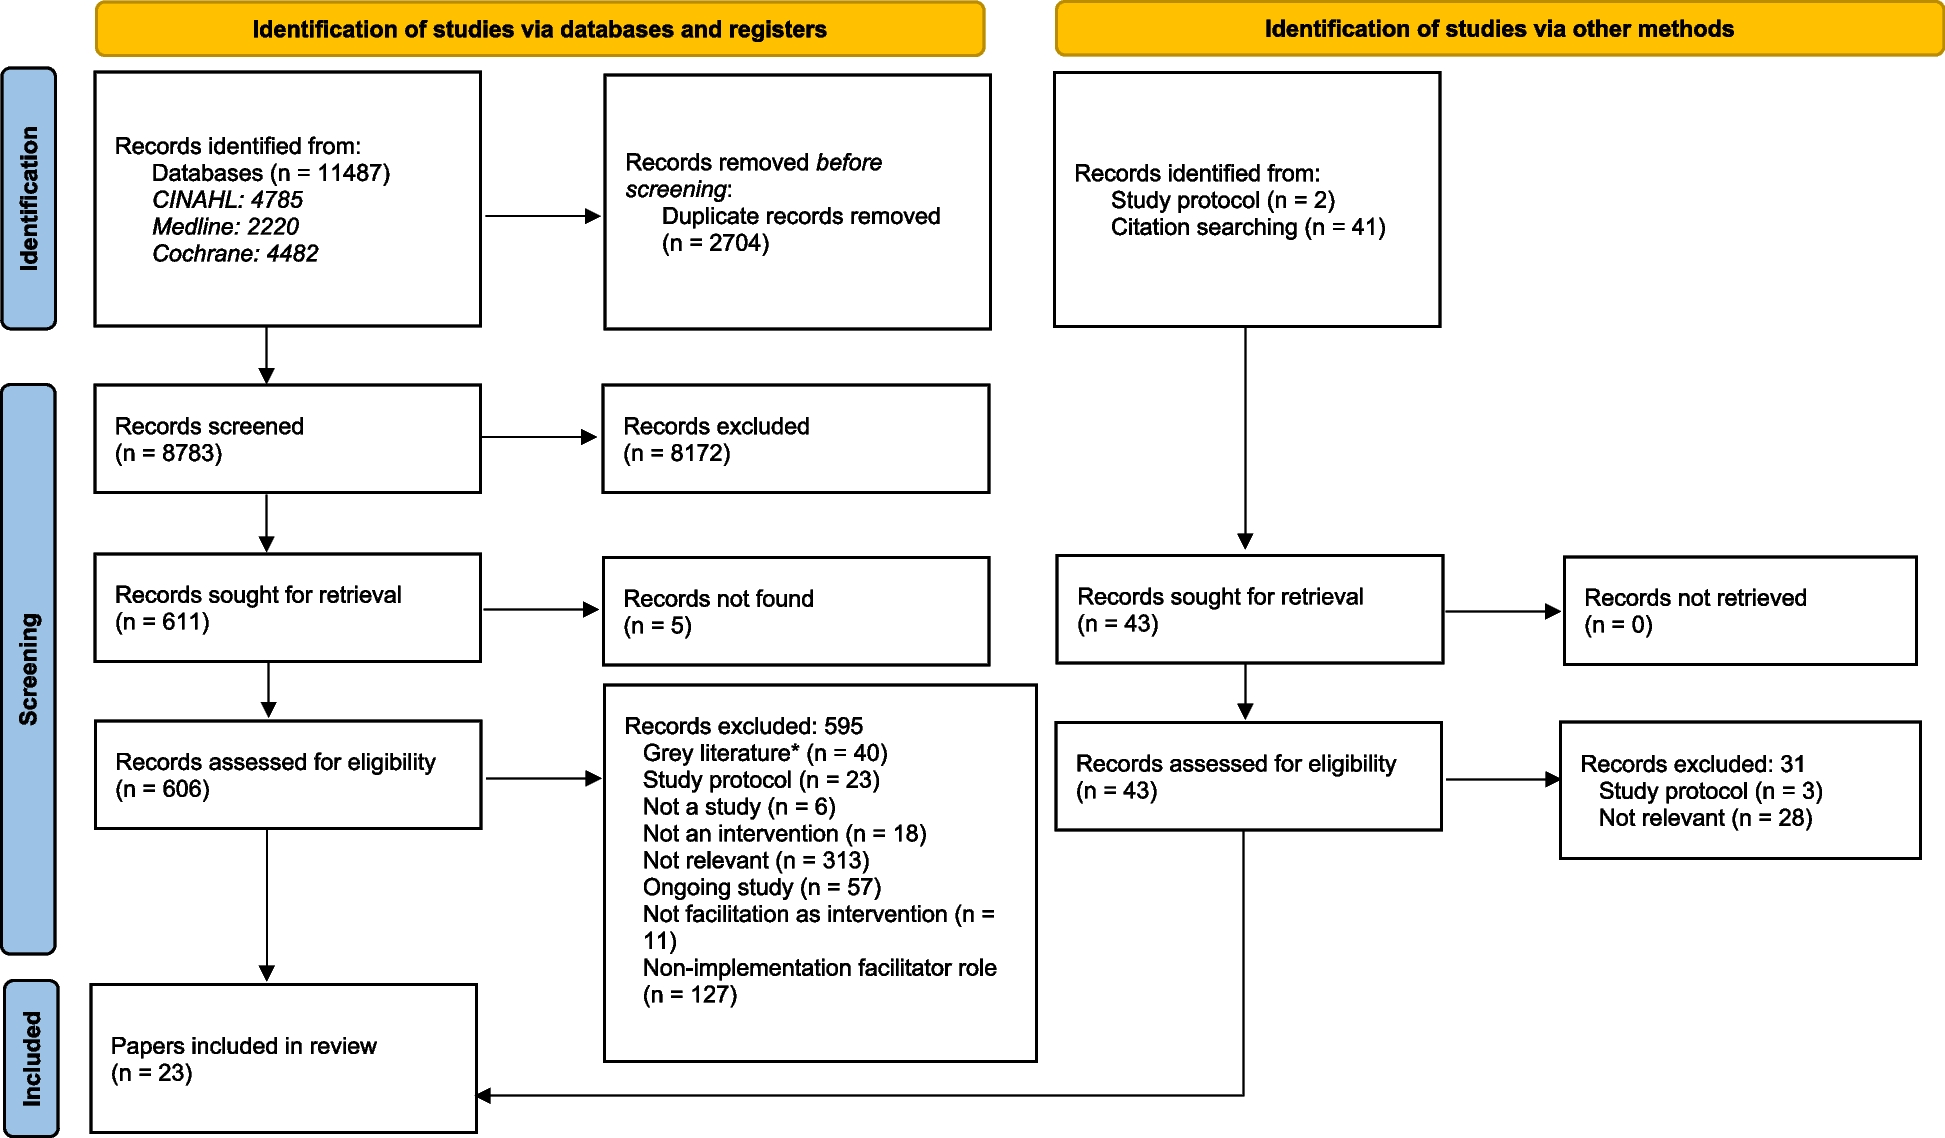
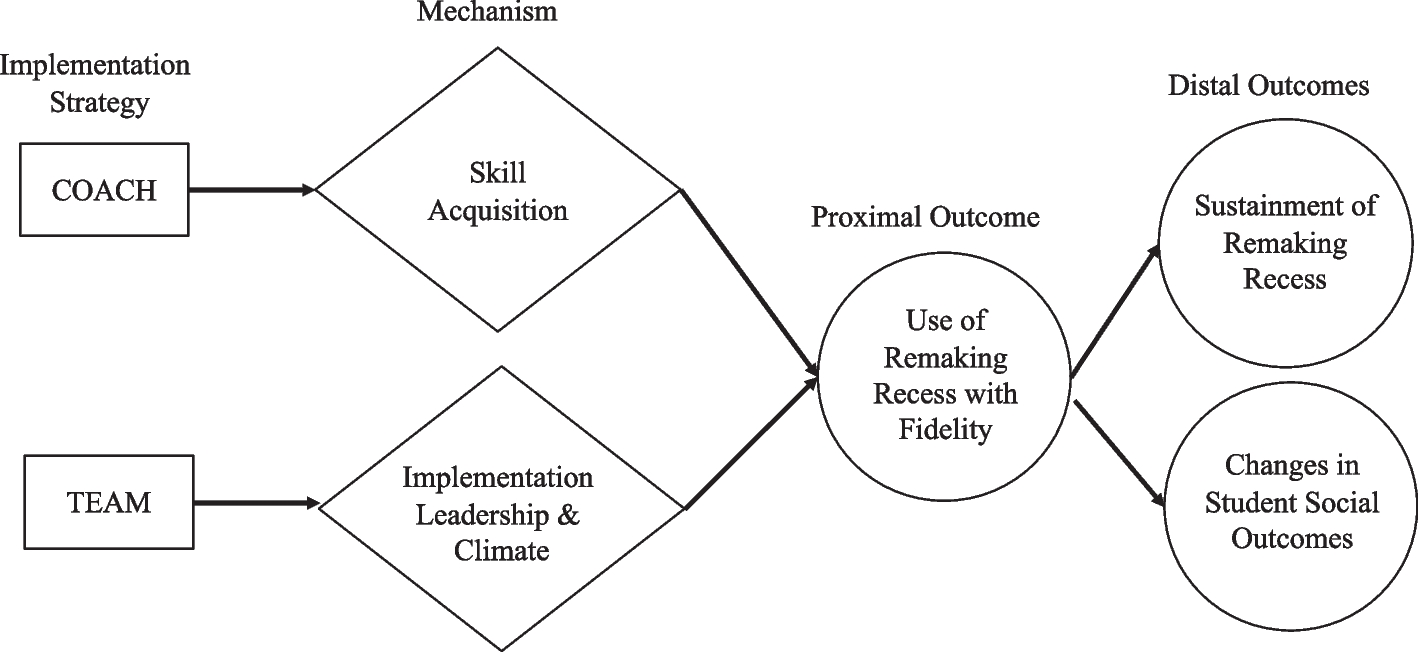


A hybrid type 3 effectiveness-implementation trial will be conducted (Fig. 2). After baseline assessments at the beginning of the school year, all schools will be provided RR training (Table 2). Schools will be randomized to coaching with school-based teams or coaching only.
Fig. 2 Table 2 Variables, measures, and timepoint of collectionParticipants
We will recruit 55 elementary schools across Washington, California, and Oregon. To be eligible, schools must have at least two educators directly involved with RR implementation, and at least two autistic students and/or students who are isolated, rejected, or peripheral on their classroom social network.
Inclusion/exclusionWe will recruit n = 121 educators who attend recess and are school district employees, to ensure they have the capacity to participate in research activities. We also will recruit n = 55 general and/or special education teachers to complete study measures about students and school-level constructs and n = 83–138 other school personnel (e.g., administrators, teachers) to serve on the school-based teams (approximately 3–5 participants). Participants will remain in the study for 18 months unless they withdraw or change jobs. School personnel involved with RR coaching will receive $50 for their data completion. School personnel involved with school-based teams will receive $25 per session and $25 for their data completion. Teachers will receive $25 for their data completion and an additional $10 per student per data collection timepoint.
We will recruit 118 autistic students and allistic classmates. Autistic students will be included if they: 1) have a documented autism classification; 2) are between the ages of 5–12 and enrolled in Kindergarten through 5th grade; and 3) share a recess period with allistic peers. Allistic classmates will be included if they are: 1) isolated or peripheral on their classroom social network; and 2) require support during recess. Autistic students and their peers without an available educator supporting recess will be excluded. Participants will not be excluded given their sex, gender identity, age, or racial/ethnic background, and will not be asked to disrupt any other service utilization.
ProceduresRecruitment in schools will include an informational email and video about the study, RR, coaching, and school-based teams. We will meet with school administrators via Zoom to share study information, participation requirements, and answer questions. We will then meet with educators to obtain consent and subsequently ask teachers to send recruitment materials (electronic/paper) to caregivers of focal students and classmates to participate in the Friendship Survey. The results of the Friendship Survey will determine social network inclusion status (isolated, peripheral, secondary, and nuclear). We will invite classmates who are classified as isolated, rejected, or peripheral and who may need additional support at recess (n = 1–2 per school) into the study.
An independent statistician will randomize all schools. The randomization (coaching with school-based teams vs. coaching only) has equal assignment probability to each group. Randomization will be stratified on the number of educators who will deliver RR (educators = 2 vs. > 2). Unmasking of randomization will not be permissible.
Data collectionData will be collected during the following timepoints: T1 = baseline; T2 = Exit of RR 1; T = 3 End of Year 1; T4 = fall, the following school year; and T5 = spring, the following school year. At baseline, we will collect demographics from all participants, as well as time in inclusion from teachers and autism symptomatology from caregivers. We also will ask caregivers to rate the quality of play for their child at all timepoints (T1-T5). A masked rater will code RR fidelity and peer engagement at all timepoints (T1-T5) provided the student remains at the school the following year. Educators and school-based teams members will be asked to complete acceptability and a cost survey at T1-T5 and rate sustainment at T4-T5. All consented students will be administered the Friendship Survey (~ 5–10 min) at T1-T3, and teachers will be asked to complete a measure of social skills per enrolled student at T1-T3. We will continue to collect implementation outcomes the following school year. Educators, teachers, and school-based team members will be asked to rate implementation leadership and climate and team processes at T1-T5. Participants will be assigned a numerical code. De-identified data will be entered into REDCap, and all efforts will be made to prevent risks. Progress reports will be submitted as required. De-identified data will be shared with the National Database for Autism Research twice a year.
Schools will receive an initial 60–90-min didactic at the start of the school year, followed by 20–30 min of weekly coaching. RR experts will provide both the initial training and weekly coaching via Zoom. Research staff will receive training to reliably administer measures and achieve coaching and school-based teams fidelity.
CoachingAll schools will receive coaching in RR [15, 16, 34, 35, 40]. All coaches will be trained to fidelity and in the school consultation process [46]. We will use a blended coaching model which includes semi-structured conversations around setting goals, creating plans, reviewing progress, and revising/refining plans. Coaching sessions will use a behavioral skills training (BST) approach that entails direct instruction, rehearsal, and feedback [47], and ensures consistent trainings across each research site. Coaching will take place at a convenient time for the participant and target one didactic skill from RR per session. The coach will first explain the skill, how it applies to autistic students or their classmates, and its importance in relation to the development of students’ social functioning. Subsequently, the coach will show educators how to use the targeted skill via visual supports and modeling. Then, educators will be asked to practice the skill via role-play, so the coach can provide immediate feedback. At the end of the session, educators will be asked to practice the skills with focal students in between coaching sessions. Practice will be reviewed at the next session.
School-based teamsWe will use the same procedures as in coaching to conduct manipulation checks on school-based teams fidelity. School-based teams will focus on the school personnel implementing RR. Facilitators from the research team will: (a) create a trusting interpersonal context within which school-based teams feel comfortable to talk about what is and is not working to support RR use, (b) help identify whether preconditions for successful implementation leadership and climate are in place, (c) leverage existing school-based teams that support EBP implementation (e.g., Multi-tiered Systems of Support, Positive Behavior Interventions and Supports) [48], and (d) work with the school-based teams to use existing communication systems (e.g., staff meeting, email) or help establish a communication system to ensure all RR implementers are abreast of the implementation and sustainment plan and action steps. Monthly school-based teams sessions will be recorded on Zoom. Session attendance, composition, team stability, and individual participant contributions will be documented. School-based teams will be individualized to each school to address its specific implementation needs [16]. Table 3 outlines the school-based teams components.
Table 3 TEAM Session TopicsUsing the CFIR domains, we will work with school-based teams to identify, prioritize, and rate implementation barriers on their feasibility and importance [33, 49]. We will present implementation strategies and their definitions [16, 50, 51] that directly address identified barriers to implementation to participants to review and rate feasibility. The research team also will rate the degree to which the strategy is integral to RR fidelity on a scale of “1” for low to “3” for high impact. We will then select and match appropriate implementation strategies, with high feasibility and impact to RR barriers. Last, we will help participants create an implementation plan for the implementation and sustainment phase to provide a roadmap for RR implementation [33].
MeasuresWe will collect the measures below that align with the CFIR domains.
Demographics and contextSchool personnel will complete a demographic form. Teachers will document percent time and activities where the student is included in general education settings. School characteristics (e.g., school size, percent eligible for free lunch, racial/ethnic composition) will be obtained via school records. Caregivers will complete a demographic form on students.
Autism symptomatologyAutistic students must have an educational eligibility of autism (e.g., IEP) and a Social Communication Questionnaire (SCQ) [52] score ≥ 15. Caregivers will rate the student’s “lifetime” characteristics to support an autism classification (sensitivity = 0.93; specificity = 0.93).
Implementation outcomesFidelity (primary outcome). An observer-rated fidelity checklist will be used to measure RR fidelity. A masked observer will measure RR skill acquisition and quality of intervention delivery. Skill acquisition will be scored “0” for “no” and “1” for “yes” to determine whether educators use the RR component. The number of components will be totaled and used for analysis. Quality of RR delivery will be coded on a Likert scale from “1” (not well) to “5” (very well) for each RR component that was used. The average quality rating across all intervention components will be used for analysis. Observer-rated fidelity will be collected during recess. Observers will be trained to ≥ 90% percent agreement on each item.
SustainmentThe extent to which RR is sustained will be calculated using the Provider Report of Sustainment Scale (PRESS) [53] at T4 and T5. Internal consistency is high (α = 0.95).
Fidelity checksWe will use the RR coaching fidelity checklist and the school-based teams fidelity checklist. A proportion score will be calculated for each measure.
AcceptabilityWe will use the Acceptability of Intervention Measure [54], a 4-item instrument. Raters score items on a 5-point scale ranging from “Completely Disagree” to “Completely Agree.” Internal consistency (α = 0.89) and test–retest reliability were good (α = 0.83). RR will be the referent.
CostsWe will use activity-based costing, an approach to micro-costing consistent with the “ingredients approach,” [55, 56] to estimate the costs of coaching with or without school-based teams. We will determine costs from multiple perspectives including system/payors (i.e., state education agency, regional education service agency and district), organizational (e.g., school) and provider perspectives as these are the primary stakeholders in implementation efforts [57]. While an aggregated (e.g., societal) perspective remains the gold standard in economic evaluation, it may not provide sufficient information for understanding why implementation fails to achieve desired objectives [58, 59]. Determining implementation strategy costs from multiple perspectives is essential to data-driven decision-making about resource allocation for EBP implementation. We will track time and other costs related to key activities across implementation phases, consistent with previous research [57, 59, 60]. Implementation costs will include fixed, time-dependent and variable costs. With input from the research team and school system partners, we will identify key activities associated with coaching and school-based teams across implementation phases – and with RR. Example activities during the implementation phase, for example, will include initial training of educators, and coaching sessions. Cost data collection will include a qualitative component with open-ended items that ask respondents to identify resources, needs, and priorities related to coaching with or without school-based teams [61, 62].
Student outcomesPeer engagement. The Playground Observation of Peer Engagement (POPE) [63] will be used to capture peer engagement at T1-T5. The POPE is an interval coding system where a masked evaluator conducts a live 10-min observation in 1-min intervals during recess (i.e., observation for 40 s, coding for 20 s). Each interval is assigned one mutually exclusive engagement state that represents the majority of the interval (e.g., solitary, jointly engaged, etc.). Observers will be trained and considered reliable with a criterion α > 0.80 [64]. The POPE has been used to measure peer engagement in autistic students [8, 10, 65,66,67], and has demonstrated high levels of reliability across multiple sites [68].
Friendship Survey [69]. The Friendship Survey is a 5-item questionnaire that assesses students’ peer relationships, rejection, and social network inclusion, that has been reliably used with elementary-aged autistic students and their peers [7, 8, 10, 70,71,72]. Students will be asked: “Are there kids in your class who like to hang out together? Who are they?” to identify specific students within each classroom social network [73].
Friendship Survey Coding. Social network inclusion refers to the prominence or salience of each individual in the overall classroom social structure. Three related scores will be calculated: 1) the student’s “individual centrality” (the total number of nominations to any peer group within the classroom), 2) the group’s “cluster centrality” (the average centrality of the peer group), and 3) the student’s “social network inclusion” (salience in the classroom). Four levels of social network inclusion are possible: 1) isolated; 2) peripheral (connected to one or two classmates); 3) secondary (well-connected); and 4) nuclear (very well connected) [73]. Students who do not receive any peer nominations to a group are considered isolated. Students in the bottom 30% of the classroom are considered peripheral. Students in the middle 40% of the classroom are considered secondary, and students in the top 30% of the classroom are considered nuclear. Social network inclusion scores will be normalized on the most nominated student in the classroom and calculated using students’ individual centrality divided by the highest individual centrality score within the classroom to provide a continuous metric of students’ social network inclusion (range 0–1) (Fig. 3).
Fig. 3
Social skills.Teachers will rate students’ social skills using the Teacher Perceptions Measure, a 12-item questionnaire that uses a 3-point Likert scale to rate teachers’ perceptions of students’ social skills (1 = never, 2 = sometimes, 3 = very often). This measure has been used with autistic and allistic students, and has good internal consistency, ranging from 0.72–0.88 [8].
Quality of Play. Caregivers will rate the quality of their child’s playdates using a modified version of the Quality of Play Questionnaire (QPQ) [74], a 17-item measure that considers the frequency of playdates and the amount of conflict during interactions to quantify play quality.
Organizational mediatorsImplementation Leadership.Educators will complete the School Implementation Leadership Scale (S-ILS) [72], a 21-item measure that assesses seven subscales of implementation leadership: knowledgeable (understanding of RR and implementation issues), supportive (support for RR use), proactive (anticipating and addressing challenges), perseverant (consistent and responsive to challenges), communicative (shares implementation related information with staff), has a vision/mission (oriented towards using RR), and available in implementing RR [39, 75]. The S-ILS is a psychometrically validated and reliable instrument (α = 0.95–0.98). Implementation leadership is scored using aggregate individual ratings to the school level.
Implementation Climate. Participating educators will complete the School Implementation Climate Scale (S-ICS) [76], a 21-item measure that assesses seven subscales of implementation climate: focus, educational support, recognition, rewards, use of data, existing supports, and RR integration [75, 76]. The S-ICS is a psychometrically validated and reliable instrument (α = 0.81–0.91; 39, 79). Implementation climate is scored using aggregate individual ratings to the school.
Team Processes. TEAM members will complete the Team Processes Survey (TPS) [77] short form, a 10-item self-report of team processes (mission analysis, goal specification, strategy formulation and planning, monitoring progress toward goals, systems monitoring, team monitoring and backup, coordination, conflict management, motivation, and confidence building, and affect management). Responses are structured on a 5-point Likert-type scale from “1” = not at all to “5” = to a very great extent. The TPS has good internal consistency (α = 0.82–0.85). Table 4 outlines the complete study timeline, including data collection timepoints.
Table 4 SPIRIT Flow DiagramData analysisAll subjects, once randomized, will be included in the intent-to-treat sample, and every effort will be made to collect all primary and secondary outcomes even if the participant (educator, school personnel, or student) does not engage in randomly assigned treatments.
Primary aim 1Primary Aim 1 analysis will contrast coaching with school-based teams vs. coaching only on change in RR fidelity (primary outcome) and students’ peer engagement (secondary outcome) from T1-T5. Generalized linear mixed models (GLMM) will be used to analyze change in T1-T5 for RR fidelity and sustainment as well as peer engagement and from T1-T3 for all other social outcomes. Separate models will be fitted for each primary and secondary outcome and a piecewise-linear model with potential knot(s) at T2 and T3, will be used to model the temporal trajectories across the study as the trajectories of the outcomes may occur at the end of each semester. The analysis will fit a GLMM with fixed effects for the intercept, time, and a group-by-time interaction. The GLMM will include random effects for the intercept and time (slope) and model the correlation between the two random effects. All outcomes will be assessed for normality. If outcomes are non-normally distributed, other distributions will be assumed or transformations of the outcomes will be considered. The GLMM also can be extended to model the nesting effects (e.g., educators nested within schools or students nested within classrooms or educators). The GLMM will adjust for the following baseline measures X when evaluating the primary outcome—RR fidelity: site and years of experience at current position. For models evaluating student outcomes, the GLMM will adjust for X: site and child’s age. The primary aim contrast in this study is the between groups difference in change in outcomes from T1-T5 for RR fidelity and sustainment as well as playground engagement and between group differences in changes from T1-T3 for all other student outcomes.
Secondary aim 2Secondary Aim 2 aims to evaluate whether implementation leadership and climate mediates the effect of coaching with school-based teams (vs. coaching only) on RR fidelity and student outcomes. We will extend the regression models from Primary Aim 1 to evaluate the mediation effect [78]. The analysis will result in estimates of and confidence intervals for the direct effects for coaching with school-based teams (vs. coaching only) on outcomes and the indirect effects of the strategies on outcomes via implementation leadership and climate.
Secondary aim 3Secondary Aim 3 aims to explore whether child characteristics collected at T1 moderate the effect of coaching with school-based teams vs. coaching on primary outcomes. GLMM will be expanded to include a third order interaction term (and all lower order interactions) of child characteristics (age, gender, autism classification) with strategy group (coaching with school-based teams vs. coaching only) with time (T1-T3) to evaluate the moderation effect.
Supplemental analysisWe will explore whether the effect of implementation strategies on student outcomes differ by 1) autistic students versus classmates who are peripheral/isolated on their social network; and 2) demographic characteristics (e.g., age, gender, and race/ethnicity) by extending the moderation analysis in Secondary Aim 3.
Missing dataFor modeling and hypothesis testing, the proposed likelihood-based approach regards missing data as missing at random (MAR; i.e., missing data are independent of unobserved data). The likelihood-based solutions are robust to violations of ignorable missing data (i.e., situations where the MAR assumption is not met) [79]. We will examine the degree of randomness in missing data by comparing the frequency, reasons, pattern, and time to dropout and missing values across strategies. Missing data will use multiple imputation [80]. In sensitivity analyses, all aims will be analyzed with and without the multiple imputed data.
Sample size and power considerationsThe sample size for the study (n = 121 educators, n = 118 students in n = 55 elementary schools) was determined based on statistical power for the Primary Aim 1 contrast, a between implementation strategies (coaching with school-based teams vs. coaching only) mean comparison in change in RR fidelity (primary outcome) from T1-T3. Based on a Type-I error rate of 5%, a within-person correlation in paraeducator fidelity of ICC = 0.36 (based on preliminary data), a total number of 98 educators are needed to detect a difference of at least 0.15 in the comparison of slopes in educator’s RR fidelity with 80% power. After accounting for an estimated attrition rate of 10% and a 10% variance inflation factor for clustering by school, a total number of N = 121 is needed. Similarly, for our Primary Aim 1 secondary outcome, peer engagement, assuming a Type-I error rate of 5%, a within-person correlation in students’ joint engagement of ICC = 0.18 (based on preliminary data), a total number of 118 students are needed to detect a difference of at least 14% in total time spent in joint engagement in the comparison of slopes in joint engagement between coaching with school-based teams vs. coaching only with 80% power and 10% attrition and 10% variance inflation factor for clustering by school.
Cost and cost-effectiveness analysisWe will adopt a mixed-methods approach to cost and economic evaluation to obtain a comprehensive understanding of the resources required to implement RR and economic consequences not captured solely using quantitative methods [61].
Cost Analysis. For each personnel-related cost, we will determine hourly wage + fringe based on national or state-level sources such as Bureau of Labor Statistics data and multiply that by time for each activity across phases [81]. We make needed adjustments for inflation and discounting, as applicable and characterize geographic variation in prices, as needed [55, 61]. We will generate descriptive statistics describing the base case (i.e., means) and variability in costs (i.e., standard deviations) for coaching and school-based teams. We will calculate total costs for each group coaching with school-based teams vs. coaching only. We will conduct sensitivity analyses to examine the robustness of our cost estimates and characterize uncertainty [56, 82]. We also will estimate costs in aggregate (e.g., societal) and by perspective group (e.g., school building), to provide tailored information on actual cost burden (and benefit) in implementing RR.
Qualitative Analysis. We will use qualitative data to expand and explain our quantitative findings. The qualitative data will be coded using directed content analysis – which makes use of existing frameworks to identify coding categories and derive the meaning of communications [83]. A codebook will be developed over multiple iterations via a close reading of the initial set of transcripts (i.e., inductive approach) [84], code generation, and group meetings. The codebook will include operational definitions of each code, examples of the code from the data, and guidance on when to use and not use the code. Two raters will code each transcript independently and resolve disagreements through consensus dialogue [85, 86]. Inter-rater reliability will be calculated using established Kappa statistic cutoffs (moderate: 0.40; substantial: 0.60; outstanding: 0.80) [87].
Economic Evaluation. We will determine cost-effectiveness of coaching with or without school-based teams [56, 88]. This will involve calculating a series of incremental cost-effectiveness ratios (ICERs) using implementation (fidelity, sustai
留言 (0)