• We standardized the framework for RNA barcoding technology and optimized the existing barcode segment validation algorithms.
• Highly conserved barcode segments of DENVs were intercepted through SNP sites.
• The barcode segments achieved a perfect identification precision rate of 100% for DENVs, as validated through Blast analysis against a large dataset of sequences from the GISAID’s EpiCoV, GISAID’s EpiArbo, BV-BRC, NGDC, NCBI-influenza and RVDB databases.
• These barcode segments can effectively and reliably identify DENVs from high-throughput sequencing data.
• The “Barcoding” software streamlined the segment design procedures and increased analytical efficiency.
IntroductionFour distinct serotypes of dengue viruses (DENVs), DENV-1 to DENV-4, belong to the Orthoflavivirus genus within the Flaviviridae family (Brillet et al., 2024). These small and single-stranded RNA viruses exhibit genetic differences that allow multiple infections in humans, each compromising specific long-term immunity (Paz-Bailey et al., 2024). DENVs are primarily transmitted through bites from Aedes aegypti and Aedes albopictus mosquitoes, posing significant public health challenges in tropical and subtropical regions (Porse et al., 2015). Recent advancements in whole-genome sequencing and molecular biology techniques have provided detailed insights into the genetic diversity and evolutionary dynamics of DENV, enabling more precise characterization of viral lineages and transmission patterns (Stica et al., 2022; Boolchandani et al., 2019).
The concept of Barcoding technology, first proposed by Paul Hebert in 2003, has been crucial in biodiversity research and species identification (Pomerantz et al., 2018). By sequencing specific nucleic acid segments, often from chloroplasts or mitochondria, it enables rapid and accurate identification of a specific species. Besides, this technique has been widely applied for virus identification. For instance, Lam et al. (2020) identified SARS-CoV-2-related coronaviruses (SARSr-CoV-2) from pangolin tissues using species-specific markers. Dr. You distinguished SARS-CoV-2 from human coronaviruses (HCoVs) and SARSr-CoV lineages through genomic data analysis (You et al., 2024). The application of barcoding technology appears to offer an efficient molecular tool for DENVs’ identification and detection, as suggested by recent findings.
Real-time quantitative reverse transcription polymerase chain reaction (RT-qPCR) remains the gold standard for DENV detection and serotyping in viremic (RNA-positive) cases, offering high sensitivity and specificity (Álvarez-Díaz et al., 2021). Additionally, serological tests such as enzyme-linked immunosorbent assay and neutralization assays are employed to assess infection rates and vaccine efficacy (e.g., CYD-TDV) (Galula et al., 2021). Advanced methods like amplicon-based sequencing have also been developed, such as the “DengueSeq” protocol (Vogels et al., 2024), enabling cost-effective, full genome recovery of all dengue virus serotypes using multiplexed sequencing on platforms like Nanopore. However, these methods have limitations: they are time-consuming, labor-intensive, and require specialized equipment and trained personnel, which may not be feasible in resource-limited settings. They are also heavily dependent on the timing of sample collection, with late collections potentially leading to decreased viral loads and false-negative results (Kok et al., 2023). Methods like RT-qPCR and next-generation sequencing require high-quality RNA samples collected during a narrow window of viremia. In comparison, barcoding technology provides a rapid and cost-effective alternative for DENV detection. This method significantly reduces detection time compared to RT-qPCR and amplicon-based sequencing, offering results in less than 2 h due to simplified procedures that require less manual handling and no need for thermal cycling equipment or extensive amplification cycles. Barcoding technology is less dependent on the timing of sample collection, as it can detect viral genetic material even when viral loads are low, thereby minimizing false-negative results associated with late sample collection. While barcoding technology may not offer full genome information, it simplifies the detection process by reducing the need for complex data analysis and specialized equipment. This technology also shows potential in identifying genetic variations among DENV strains, which is crucial for epidemiological surveillance and timely public health interventions. Although metagenomic sequencing is required for full genome characterization of new viruses, barcoding technology provides a valuable initial screening tool that enhances the efficiency of dengue surveillance programs. Furthermore, barcode segments can be utilized to design specific probes with fluorescent labels for RT-PCR to enhance serotype identification (Zhuang et al., 2023). By targeting conserved regions unique to each DENV serotype, these barcoded probes improve the specificity and sensitivity of RT-PCR assays. This integration not only accelerates the diagnostic process but also provides detailed serotype information essential for epidemiological surveillance and outbreak management.
Due to their extensive variability and global distribution, DENVs are crucial for informing public health surveillance strategies, such as outbreak prediction, monitoring transmission dynamics, and guiding vaccine deployment efforts (Cattarino et al., 2020). Barcoding technology has improved the rapid detection of microbial samples from environmental matrices, enabling detection within hours, along with precise serotyping and data analysis of DENVs’ genetic diversity and evolutionary trajectories (Johnson et al., 2005). This advancement elucidates intricate genetic relationships among DENV serotypes, providing key insights into their adaptive mechanisms and mutation patterns (Bell et al., 2019). Examining DENV surface protein genes has highlighted viral mutation trends, providing crucial insights into antigenic variability, which are essential for evaluating vaccine efficacy and developing evidence-based intervention strategies (Afroz et al., 2016; Villar et al., 2015; Rather et al., 2017). Barcoding technology based on the high-throughput sequencing results allows rapid and extensive analysis of viral sequences, significantly enhancing the efficiency of identifying multiple viral variants in a single run, which is essential for broad DENV surveillance during epidemic seasons and early outbreak characterization (Massart et al., 2019). Comprehensive phylogenetic and mutation analysis of DENV genetic data enables researchers to explore mechanisms of host and environmental adaptation. In terms of host adaptation, this includes mutations that affect immune evasion and receptor binding affinity (Zimmerman et al., 2018). Regarding environmental adaptation, it involves alterations in viral replication efficiency at different geographical locations or changes in vector transmission efficiency, which have led to the spread of DENVs across various ecological niches. These findings have provided detailed insights into how DENVs evolve to maintain infectivity and transmissibility, explaining their resilience and persistence in both endemic and newly affected regions.
Leveraging design principles from SARS-CoV-2 RNA barcoding studies, we refined RNA barcoding methodologies applied on DENVs by optimizing the algorithms for evaluating barcode segments and performing primer simulation, design, and validation (Lam et al., 2020; You et al., 2024). We aimed to create barcode segments for both interserotype (DENV strain-specific) and intraserotype (four DENV serotypes-specific) identification, evaluating their accuracy and applicability for identifying cryptic viral specimens. Using multiple sequence alignment of the four DENV serotypes, we developed a training set (TRS) to assess genetic diversity and elucidate phylogenetic relationships. Single nucleotide polymorphism (SNP) sites for each DENV serotype were identified and used to segment initial sequences. High-quality barcode segments were selected using the basic local alignment search tool (Blast) and evaluated with a suite of testing evaluation sets (TESs) for testing the ability of barcode segments to identify four DENV serotypes across different taxonomic groups. These segments, along with ancillary data, were visualized in one- (1D) and two-dimensional (2D) codes and made accessible through an online database. Researchers can access the detailed barcode segments via 2D code scanning or by directly visiting the online database. Additionally, the “Barcoding” Windows client software automated the batch processing of experimental data by incorporating functions (such as data importation, sequence preprocessing, the evaluation of the identification capability of barcode segments, the visualization of barcode segments and the simulation of the primer design for barcode segments) into a unified pipeline, thereby enhancing the efficiency of viral identification processes.
Materials and methodsThe technology roadmap and operational flowchart of RNA barcode technology were shown in Figures 1A, B. Given the widespread prevalence of dengue in many tropical countries, effective surveillance and rapid identification methods were crucial for controlling outbreaks (World Health Organization, 2023). High notification rates (≥100 per 100,000 persons) were observed in some Latin American countries, including Mexico, Brazil and Colombia, as well as in Southeast Asia (e.g., The Philippines et al.). Moderate rates (1.0–99 per 100,000 persons) were reported in countries like Sudan, Pakistan, Indonesia, India and Australia, whereas lower rates (0.01–0.99 per 100,000 persons) were noted in countries like China and the United States.
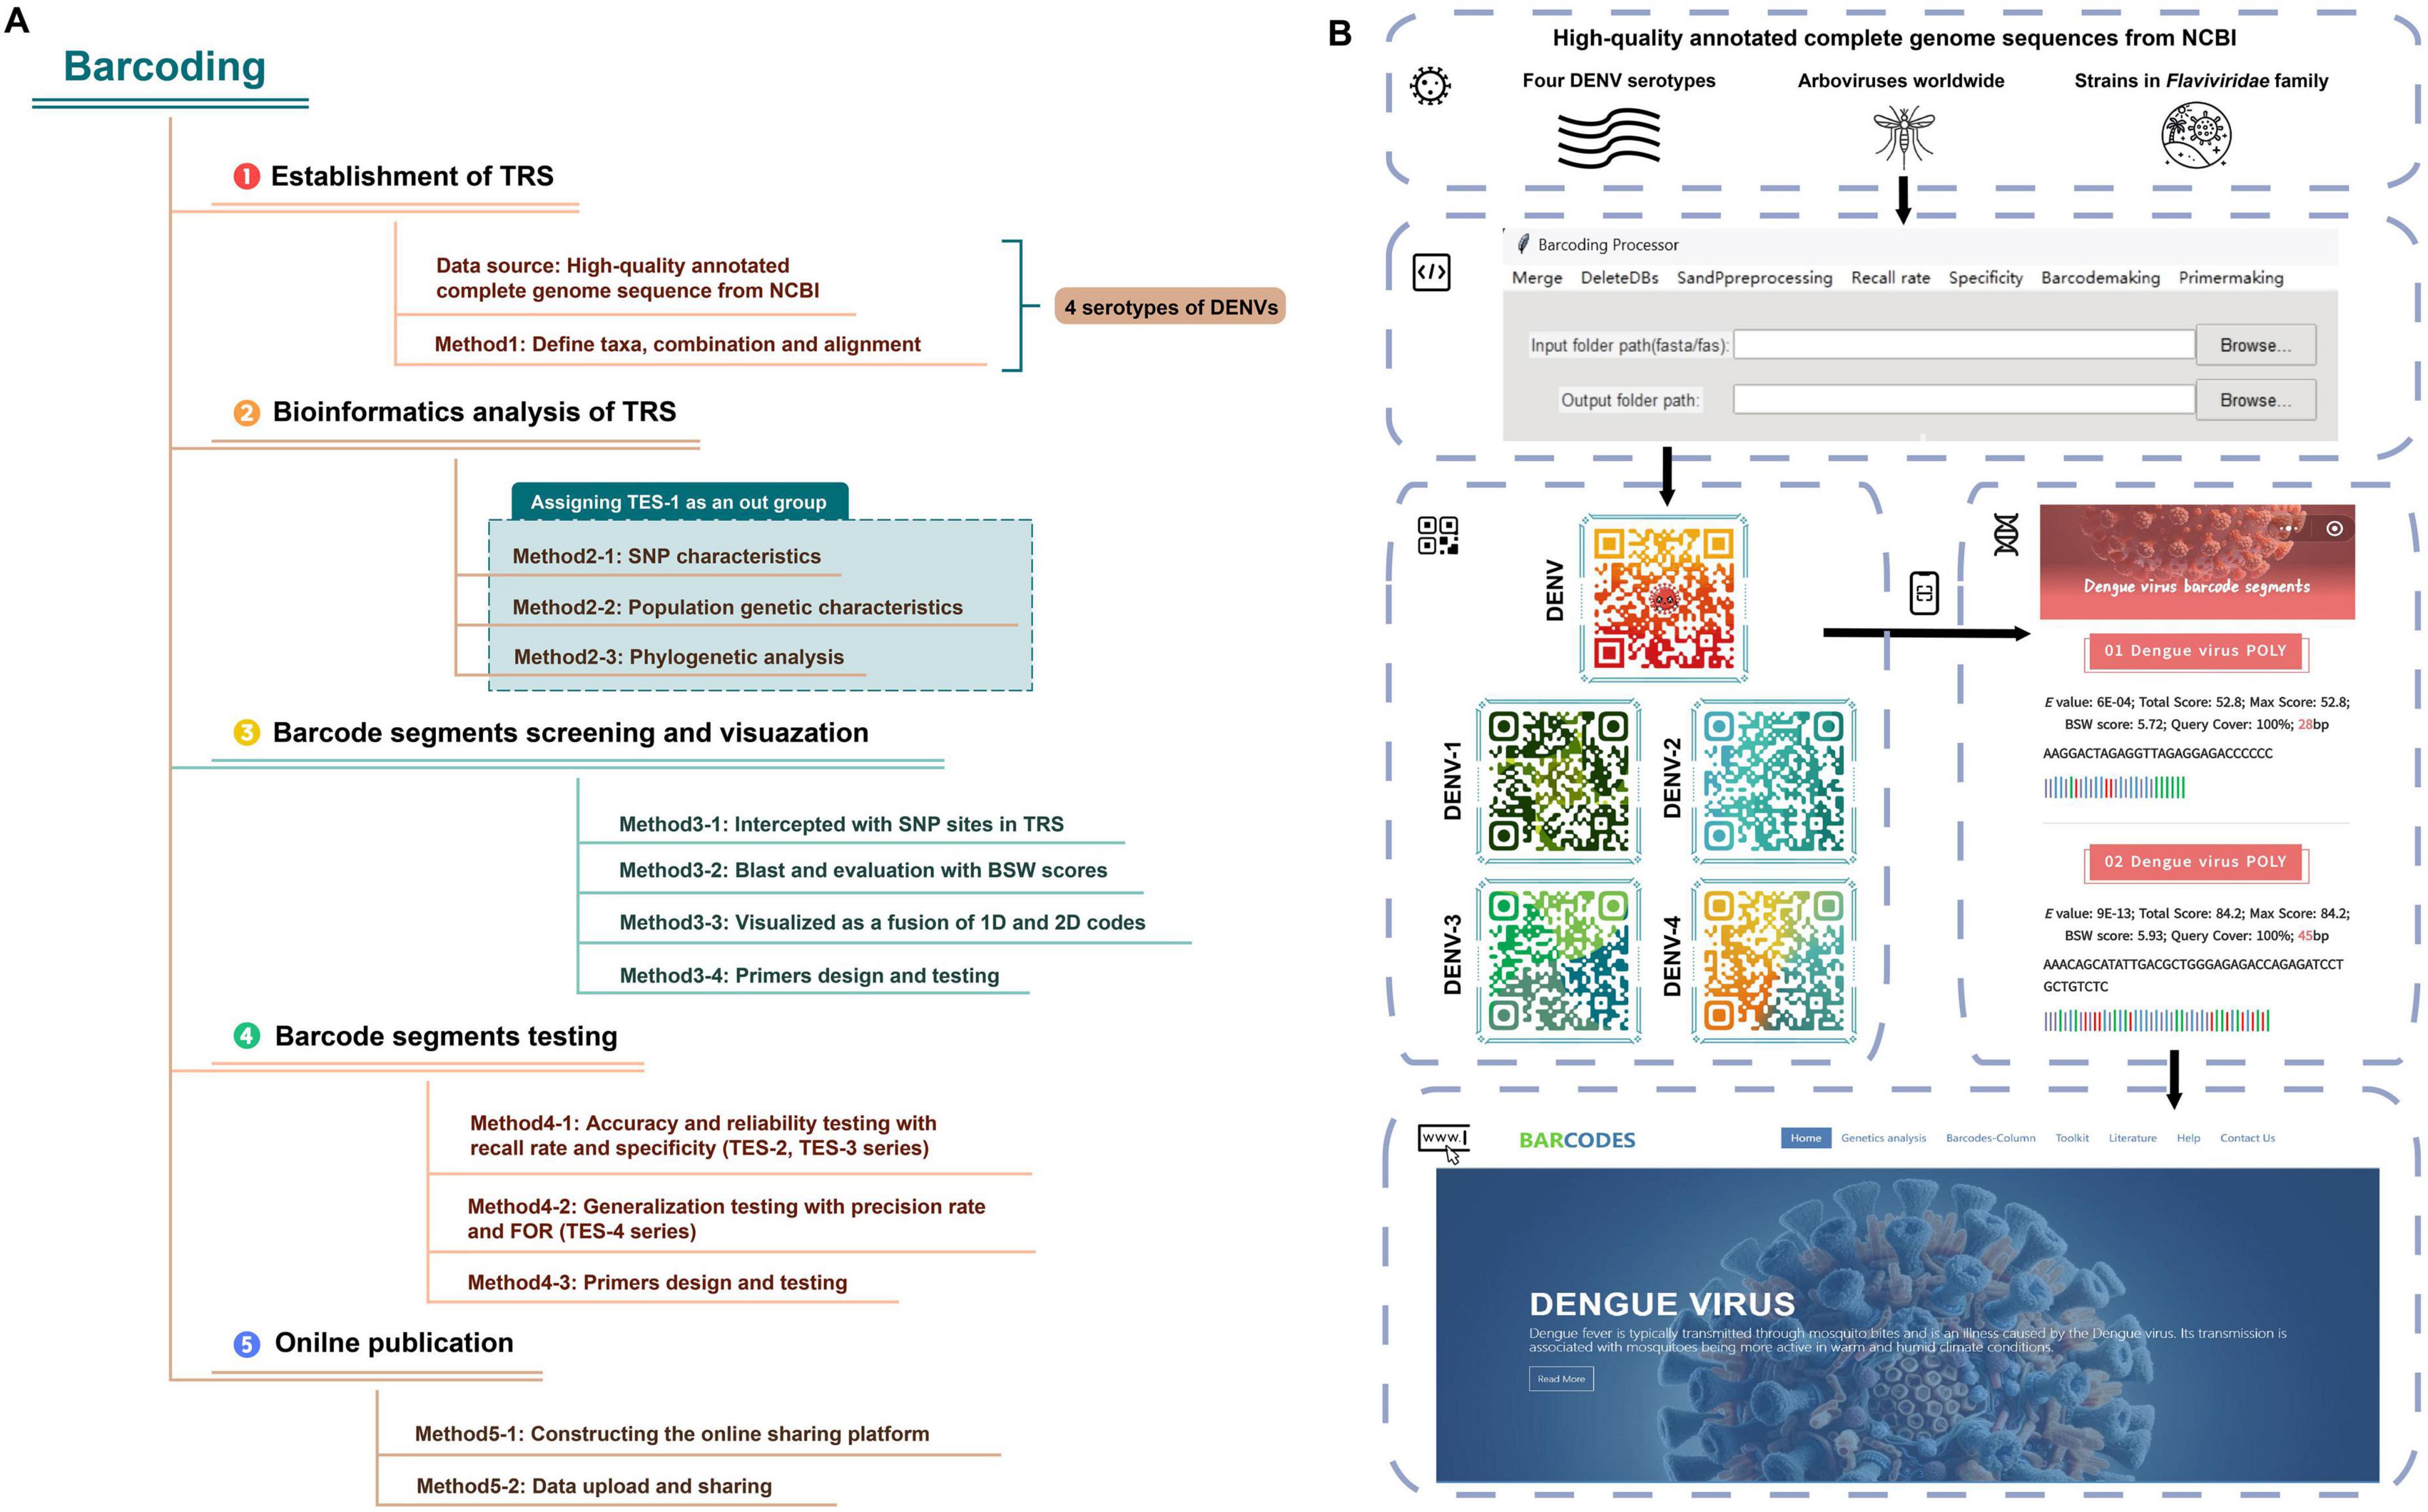
Figure 1. The flowchart of RNA barcoding. (A) The technology roadmap of RNA barcode technology. (B) The operational flowchart of RNA barcode technology.
Establishment and bioinformatic analysis of TRSThe complete genomic sequences of the four DENV serotypes (DENV-1 to DENV-4) were curated from the NCBI (Lam et al., 2020). This compilation served as the foundation for the TRS, with core sequence metrics tabulated in Table 1 and search details in Supplementary Table 1, sheets 1–4. Sequences with significant length variation were removed, resulting in datasets containing: 2,157 sequences of DENV-1 (average length 10,647bp), 1,813 sequences of DENV-2 (average length 10,656bp), 1,003 sequences of DENV-3 (average length 10,650bp) and 257 sequences of DENV-1 (average length 10,616 bp). To enhance alignment precision and facilitate integration with bioinformatic tools, all TRS sequences underwent rigorous refinement using the custom software “Barcoding” (a detailed description of “Barcoding” was provided in the section “Development of barcode-assisted design software”). This involved excising degenerate bases (R, Y, M, K, S, W, H, B, V, D, N) and standardizing sequence lengths to ensure consistency across the dataset. To elucidate the genetic diversity of DENVs and assess barcode segment identification capabilities, we compiled all complete RefSeq genome sequences of all Flaviviridae species from NCBI, encompassing five genera: Flavivirus, Hepacivirus, Orthoflavivirus, Pegivirus, Pestivirus [basic information of TES-1 and detailed annotations about these sequences including accession and version numbers, names of strains and sequence types were provided in Table 2 and Supplementary Table 2, sheet 1, based on NCBI-taxonomy and the International Committee on Taxonomy of Viruses (Federhen, 2012; Schoch et al., 2020; Siddell et al., 2023)]. These sequences formed TES-1, which included 651 sequences providing a comprehensive reference for comparative analysis and ensuring that our evaluation considered the full spectrum of genetic variability within the Flaviviridae family.

Table 1. Basic information of TRS (the four DENV serotypes).
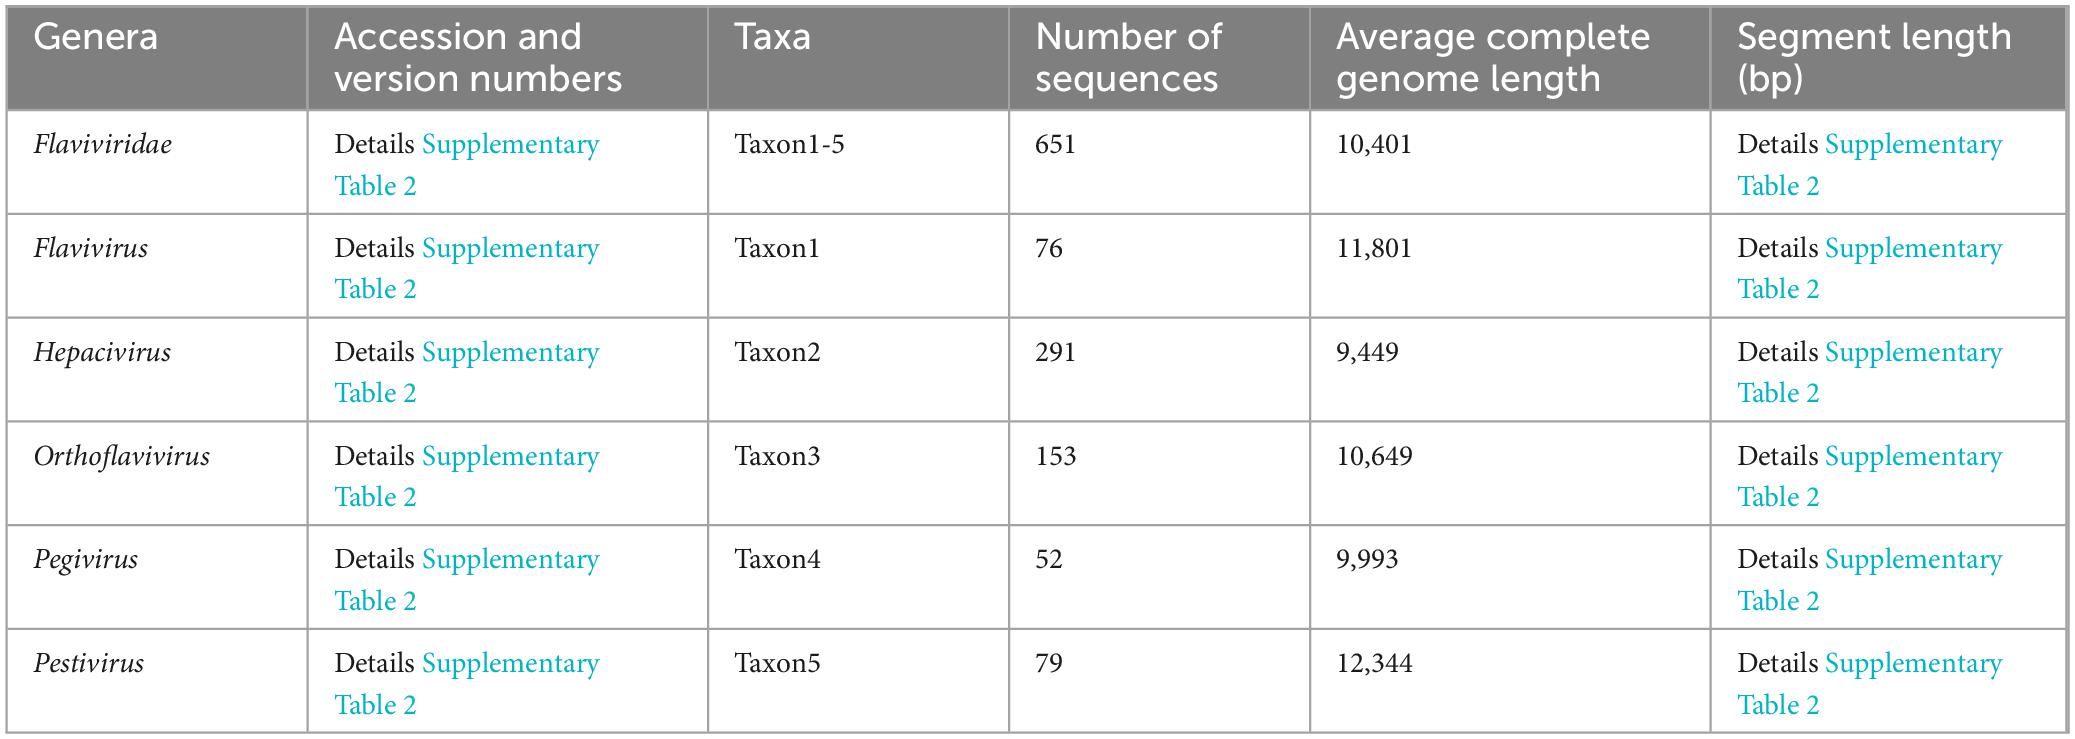
Table 2. Basic information of TES-1 (Flaviviridae family).
Given the minor length variations among TRS sequences, we employed MAFFT v7 (online version) for global alignment (Rozewicki et al., 2019). Subsequent analyses with MEGA v11 software delineated SNP characteristics (Tamura et al., 2021), identified base substitutions, and calculated genetic evolutionary distance indices (GEDI) matrices using the Kimura 2-parameter model to assess genetic divergence for inter- and intra-taxa within TRS and TES-1. These matrices were visualized using the heatmap format in R language (ggplot2 package v3.5.1, algorithm: Euclidean distance with average linkage clustering) (Zhao et al., 2014; Wang et al., 2023). Additionally, “Gene Flow and Genetic Differentiation” analyses on TRS and TES-1 were performed using DnaSP v6 (Rozas et al., 2017). These analyses provided insights into population genetic differences, evolutionary processes, and speciation mechanisms among DENVs and within the Flaviviridae species (Waman et al., 2016).
Construction of phylogenetic treesTo improve the accuracy of phylogenetic analysis and reduce computational load, we utilized a curated dataset of high-quality DENV serotype sequences from the taxonomy database. This dataset comprising 3 DENV-1, 2 DENV-2, 5 DENV-3, and 5 DENV-4 sequences was used to replace the TRS and subsequently merged with TES-1 to establish a phylogenetic tree reflective of the taxonomic levels pertinent to DENVs. The accession and version numbers of these sequences (listed in Supplementary Table 1, sheet 5) were provided to allow for verification of the exact sequences used and to facilitate reproducibility in future research. The function of measuring substitution saturation in the DAMBE v7.3.32 software was used to evaluate the obtained tree construction reliability (Xia, 2018). The feature of “Find Best DNA/Protein” models and the optimal substitution model in MEGA v11 were used to fabricate the tree based on the maximum likelihood algorithm (the bootstrap value of the maximum likelihood tree was set to 90% with 1,000 replicates to ensure the stability and reliability of the results). Additionally, an intraspecific bayesian evolutionary tree for DENVs at the species level predicated on the Markov chain Monte Carlo algorithm was constructed using BEAST v1.10 software to validate the phylogenetic outcomes (the posterior probability of the bayesian tree was set to 90% to ensure the stability and reliability of the results) (Suchard et al., 2018). The obtained phylogenetic tree was visualized online via iTOL v6 (Letunic and Bork, 2024).
Barcode segments screening and visualizationThrough DnaSP v6, SNP sites for the entirety of DENV as well as for each of the four serotypes within TRS were identified (Page et al., 2016). Using these SNP sites as boundaries, we partitioned the sequences to obtain the original segments. The retained segments were aligned against the standard nucleotide database within the NCBI Blast portal (Pruitt et al., 2005), encompassing all nucleotide sequences, totaling approximately 107 million sequences across all species as of July 20, 2024. The “Program selection parameters” (the target identity was 95%) and “Max target sequences” (selected the maximum number of aligned sequences to display) were adjusted to the highest value (5,000 comparison outcomes) to enhance the reliability of the Blast results. When all 5,000 outcomes belonging to the same DENV serotype showed a “Percent Identity” of 100%, the segments were deemed capable of accurately and reliably identifying a specific serotype. This consistent 100% identify across all comparisons provided empirical evidence qualifying them as serotype-specific barcode segments for DENVs.
Some Blast outcomes were categorized as “partial genome/cds,” leading to scenarios where a uniform “Percent Identity of 100%” in coverage rates for some segments was not obtained. In Blast alignment results, longer sequence alignments typically produced higher total scores (Altschul et al., 1997). This observation was significant for our results because, when identifying DENV sequences using barcode segments, longer alignments could enhance the confidence in matching accuracy. However, the total score was not solely dependent on length; it was also influenced by the number of matched bases, mismatches, and insertions or deletions. These factors could affect the accuracy of viral identification, highlighting the need to consider both alignment length and sequence quality in our analyses. Leveraging the “Conserved Regions” functionality in DnaSP v6, which detected sequence regions that remained unchanged (highly conserved) across multiple sequences, we set the minimum window length to 20 nucleotides and the conservation threshold to 100%. We chose a minimum window length of 20 nucleotides to ensure that the conserved regions were sufficiently long for reliable analysis, as shorter regions might not provide meaningful conservation data. A conservation threshold of 100% was selected to focus exclusively on regions that were completely conserved across all sequences in the dataset. This approach allowed us to calculate conservation test scores (P-values) for the barcode segments extracted from the TRS, thereby assessing their conservation levels (Riaz et al., 2011). Marrying the strengths of Blast alignment and the DnaSP v6 algorithm, we introduced a new metric called the barcode segment weight (BSW) score, defined by the equation: BSW = lg(max total Blast score/P-value). In this equation: Max total Blast score referred to the highest total alignment score obtained from Blast searches for a given barcode segment. This score reflected the degree of similarity between the barcode segment and reference sequences in the database; higher scores indicated greater similarity. P-value was the conservation test score calculated by DnaSP v6 for the barcode segment. It represented the statistical significance of the conserved regions within the segment, with lower P-values indicating higher conservation across the sequences analyzed.
All barcode segments were visualized as a combination of the 1D and 2D codes. The 1D codes allowed for direct inspection and analysis of the genetic sequences by researchers, while the 2D codes facilitated rapid and accurate data retrieval through scanning technologies. This combination significantly improved data sharing, storage, and processing efficiency in viral identification workflows. In the 1D representation, nucleotide bases A, T(U), C, and G were encoded in light purple, red, green, and blue, respectively. These colors were chosen for their high contrast and to facilitate easy recognition of each nucleotide during analysis (Li et al., 2021). Additionally, complementary base pairs were visually differentiated using distinct graphical markers to represent their bonding characteristics. The A-T(U) pairs were indicated by long vertical lines, while G-C pairs were represented by short vertical lines. The 2D codes generated through QR Code Generator, encapsulated both the 1D visual representations and essential information of the barcode segments within a dynamic 2D code framework. Accessing these codes via mobile devices allowed seamless retrieval of information, supported by an error tolerance of 30% (You et al., 2024), ensuring accessibility even with partial image loss.
Finally, primers were meticulously designed for all barcode segments, with amplification fidelity confirmed through the primer-Blast service provided by NCBI (Ye et al., 2012). Specifically, we evaluated the primers for specificity by ensuring they uniquely matched the target species without significant homology to non-target species. We assessed their melting temperatures to ensure compatibility with PCR conditions. Additionally, we checked for the absence of secondary structures such as hairpins and primer-dimers using Primer-BLAST’s analysis tools. This thorough in silico validation ensured that the primers would amplify the intended barcode segments accurately and efficiently.
Identification capabilities of barcode segmentsBy July 20, 2024, we had extracted 5,370 full-genome sequences of the four DENV serotypes from NCBI to serve as TES-2 (collection date and search details on NCBI were detailed in Supplementary Table 2, sheet 2). This compilation allowed for cross-validation of the average recall rate of the barcode segments at nucleotide-level and species-level and the recall rate among DENV serotypes at nucleotide-level and species-level.
To calculate the average nucleotide-level recall rate of the barcode segments, we first aligned each barcode segment with the corresponding regions of all DENV species sequences. For each species, we counted the number of nucleotide sites where the barcode segment and the species sequence matched exactly. We then divided the total number of matching sites across all species by the product of the barcode segment length and the number of species to obtain the average nucleotide-level recall rate: (Σspecies Number of matching sites)/(Barcode length × Number of species). The average nucleotide-level recall rate was visualized in Figure 2A. We set a threshold to determine the effective recall of the barcode segments for each species. If the nucleotide-level recall rate for a species exceeded the threshold (e.g., 95%), the recall rate for that species was set to 100%; otherwise, it was set to 0%. We then summed these rates across all species and divided by the total number of species: (Σspecies the average nucleotide-level recall rate)/(Number of species). This binary evaluation simplified the assessment of the barcode’s effectiveness at the species level. The choice of threshold was based on the desired stringency of matching; a higher threshold ensured that only highly similar sequences were considered matches, reducing the possibility of false positives.
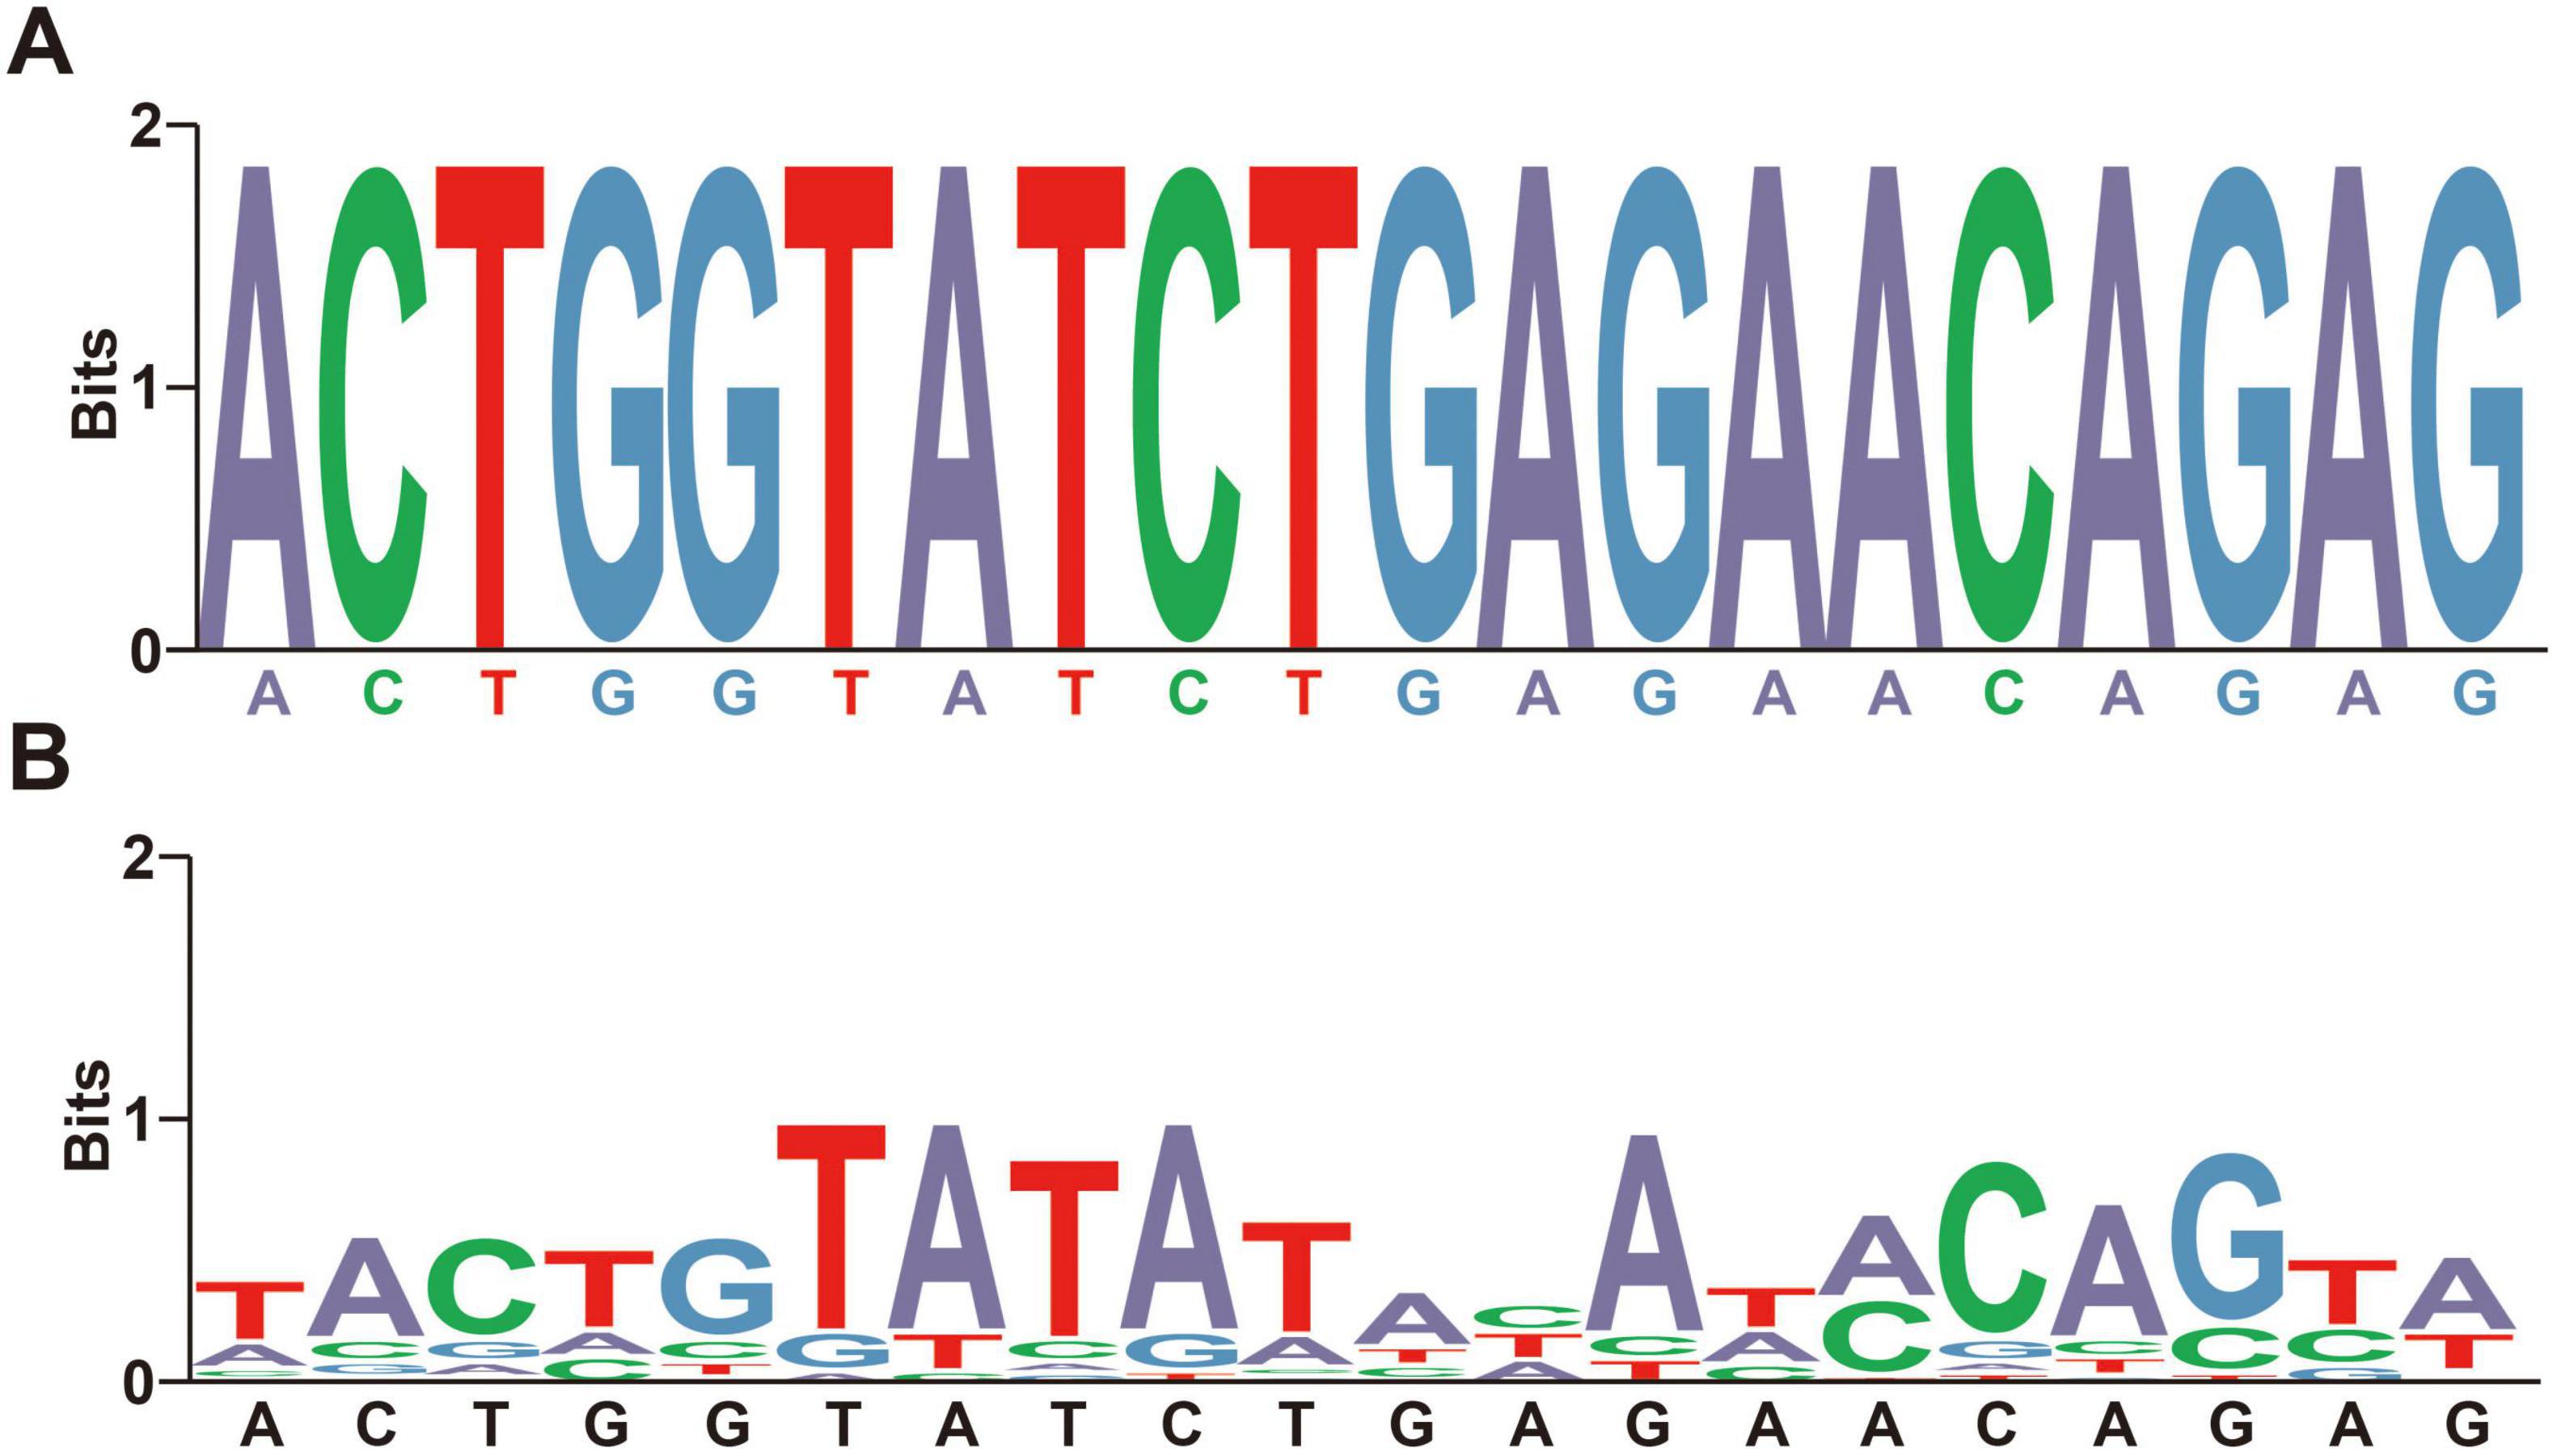
Figure 2. The visualization of recall rate and specificity algorithms. (A) The visualization of recall rate algorithms. The identical base colors above and below the horizontal axis indicate a high degree of consistency in nucleotide composition and sequence alignment between the barcode segments and the tested species. (B) The visualization of specificity algorithms. The different base colors above and below the horizontal axis indicate a high degree of difference in nucleotide composition or sequence alignment between the barcode segments and the tested species.
To evaluate the specificity of the barcode segments, we aligned them with all non- DENV Flaviviridae strains (TES-1) and the complete genomic sequences of globally impactful arboviruses from the NCBI database (Marceau et al., 2016), constructing TES-3-1 and TES-3-2 (names of strains containing in TESs were detailed in Supplementary Table 2, sheets 3, 4). We calculated the nucleotide-level specificity by counting the number of nucleotide mismatches between each barcode segment and the sequences of non-DENV species. Simliarly, the average specificity at the nucleotide and species level was calculated as: (Σspecies Number of mismatching sites)/(Barcode length × Number of species); (Σspecies the average nucleotide-level specificity)/(Number of species), respectively. We set a specificity threshold based on the acceptable number of mismatched bases (e.g., if there are more than × different bases between a species and a barcode segment, specificity was set to 100%; otherwise, it was set to 0%). This threshold ensured that only sequences sufficiently different from DENV were considered non-specific, thereby reducing false positives in detection. The visualization method for nucleotide specificity at the average species level was shown in Figure 2B. Besides, for gaps (“-”) existing in sequences after alignment in TES-3-1 and TES-3-2, we treated them as a unique type of base distinct from the standard DNA bases (A, G, C, T) to accurately account for insertions or deletions.
The recall outcomes from aligning barcode segments against species within TESs were significantly impacted by alignment algorithms that process variable regions within the sequences, such as insertions and deletions (indels). This processing led to extensive missing data and gaps, which significantly reduced recall rates and hindered accurate predictions for species with close phylogenetic relationships. For TESs derived from large datasets with abundant internal sequence polymorphism, increasing the threshold value, which set a higher similarity requirement for sequence alignment, paradoxically lowered recall rates because it excluded true positive matches that had natural sequence variations. Conversely, for TESs derived from smaller samples with sample sizes of fewer than 100 sequences and minimal sequence polymorphism, setting the maximum threshold directly might be feasible for calculating recall rates in identifying phylogenetically related species. As the nucleotide divergence among the DENV serotypes was markedly smaller than among the distinct subtypes of the influenza virus or Flaviviridae species (Kumari et al., 2023; Rijnink et al., 2023), the thresholds for recall rates were maintained at a comparatively elevated level.
TES-2, TES-3-1, and TES-3-2 were amalgamated with all barcode segments for subsequent comparison. These TESs then utilized “Barcoding” software to evaluate the recall rates and specificity of barcode segments. To investigate the impact of gaps on the diagnostic power of barcode segments, we assessed the presence and extent of gaps within virus sequences covered by barcode segments in the TESs. The measurement of gaps was based on their length relative to the average length of all barcode segments: no gaps (0 bp), small gaps (up to 6 bp, 20% of the average segment length), medium gaps (up to 15 bp, 50% of the average segment length), and large gaps (over 15 bp).
The generalization testing of barcode segmentsThe high degree of sequence similarity inherent within the TRS, stemming from conserved genetic regions among the four DENV serotypes, could potentially lead to overfitting. This meant that the barcode segments perform exceptionally well on the TRS data but may not generalize effectively to new, unseen viral sequences when distinguishing the four DENV serotypes. To further assess the identification capabilities of these segments, we constructed TES-4 series to test them against datasets containing viruses of unknown homology or phylogenetically distant strains, such as influenza viruses, coronaviruses, and poxviruses. We utilized the Blast functionalities of several databases to evaluate the generalizability (applicability and consistency) of barcode segment identification across diverse viral species. These databases included GISAID’s EpiCoV (Torrens-Fontanals et al., 2022), GISAID’s EpiArbo (see text footnote 12), BV-BRC (reference and representative viral genomes) (Olson et al., 2023), NGDC (covering the Coronaviridae and Poxviridae families, Monkeypox virus genomes, and NCBI RefSeq viruses representation genomes) (CNCB-NGDC Members and Partners, 2023), the NCBI-influenza virus resource (Influenza A, B, and C viruses) (Bao et al., 2008), and RVDB (nucleotide database) (Goodacre et al., 2018). Parameters for Blast comparisons were uniformly set to “Optimize for highly similar sequences.”
Development of barcode-assisted design softwareWe encapsulated Python code into a Windows-compatible software named “Barcoding” (refer to Figure 1B for the software interface and for the software and the user manual/operation guide). This automation facilitated tasks such as merging sequences, handling degenerate bases, calculating specificity and recall rates, visualizing 1D barcode segments, and designing primers, significantly reducing the development cycle for barcode segments. “Barcoding” was intricately designed for data management and bioinformatics analyses specific to barcoding technology. Emphasizing the Liskov substitution principle (Friedel et al., 2014), the tool was designed with a modular architecture, allowing different components of the code function independently. This modularity enhanced reusability, allowing code components to be used in multiple parts of the program or in other projects without modification.
The graphical user interface offered an intuitive display of information, with straightforward and consistent operation, easing the learning curve for new users. The Barcoding software optimized data batch processing workflow, significantly enhancing the accuracy and efficiency of data analysis compared to manual operations. For instance, a data analysis task that previously required several days of manual work could now be completed in just a few minutes using the software.
Constructing an online sharing platformUsing a web-based platform and a database management system (Supplementary Table 3), we developed an online database as a service (DBaaS) of DENV barcode segments (Agosto-Arroyo et al., 2017; Oh et al., 2015). This service was accessible via the domain (see text footnote 1) (the main interface of the webpage was shown in Figure 1B). Users could access basic information about barcode segments, download construction codes and software, and obtain genomic annotations for viruses, as well as receive updates on dengue fever outbreaks and scholarly articles from both domestic and international sources through an online platform. Additionally, we have designed an online Blast tool for comparing user-submitted sequences against the DENV barcode segments. Embedded within the Blast tool were barcode segments for DENVs at both species and serotype levels. By adjusting the “Percent identity” parameter, users could fine-tune the balance between sensitivity and specificity in their search results. Lowering the “Percent identity” threshold allowed detection of more distantly related sequences (increasing sensitivity); while raising it yielded more exact matches (increasing specificity). This feature enabled users to obtain comparison results tailored to their specific research needs.
Results SNP analysisThe average GC base pair content (BPC) for the four DENV serotypes was 46.3 ± 0.8%, while the AT(U) BPC was 53.7 ± 0.8% (Figure 3A and Supplementary Table 4, sheet 1, which listed the GC and AT(U) content for each serotype in detail). Compared to HCoVs (GC BPC ranging from 30 to 40%) (You et al., 2024), DENVs showed higher genetic stability. The higher GC BPC predisposed DENVs to CpG methylation, a process where methyl groups were added to cytosine nucleotides adjacent to guanine nucleotides (CpG sites), potentially affecting viral gene expression and replication. This underscored their greater genomic stability and provided insights into their molecular evolution and potential mechanisms for epigenetic regulation. Conversely, TES-1 did not exhibit a significant preference for varied bases at identical codon positions or identical bases at various codon positions, though marked disparities in GC BPC (52.6 ± 6.5%) were evident among the taxa, ranging from 46.1% in taxon5 to 58.6% in taxon4. These disparities in GC content could influence the viruses’ mutational biases and adaptability, with taxon1 (48.5%), taxon3 (50.1%) and taxon5 (46.1%) being more prone to adaptive mutations and recombination with phylogenetically proximate strains due to selective pressures (Figure 3B and Supplementary Table 4, sheet 1) (Bobay and Ochman, 2017). Furthermore, there was a notable disparity in overall GC BPC between DENV (46.3%) and taxon3 (50.1%). Specific molecular-level nucleotide genetic markers significantly facilitated distinguishing DENVs from closely related species within the Flaviviridae family and even those in the Orthoflavivirus genus.
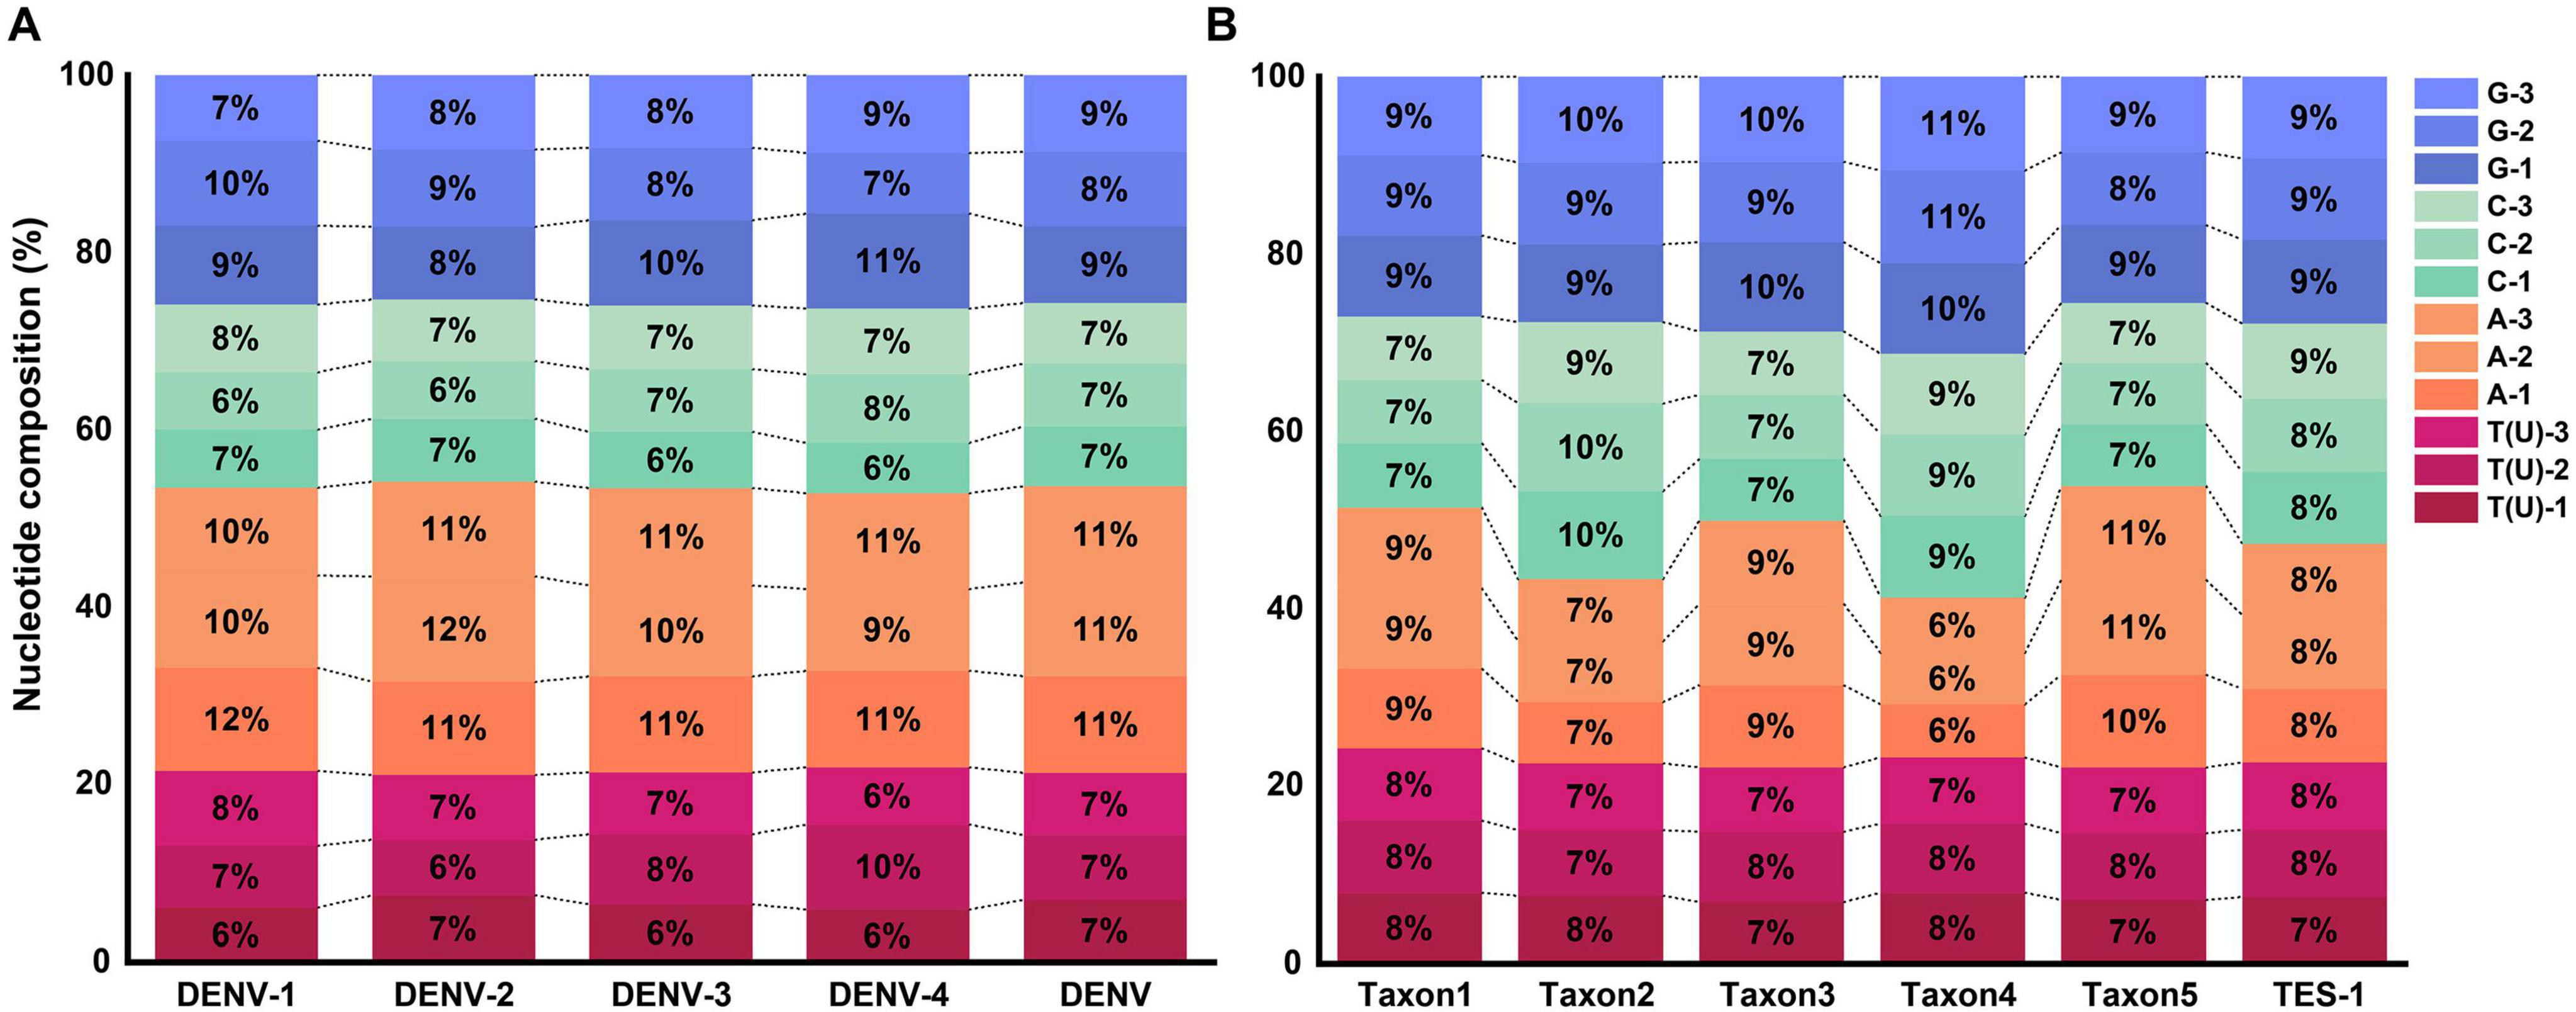
Figure 3. Nucleotide composition at different codon positions. (A) Nucleotide composition of TRS. (B) Nucleotide composition of TES-1.
Base substitution analysis revealed that all four DENV serotypes exhibited R-values above 1, indicating a predominance of transitionsal pairs (SI) without notable extremes (Figure 4A and Supplementary Table 4, sheet 2). This finding suggested low nucleotide substitution saturation, meaning that the rate of mutation accumulation has not reached a level where it obscured true evolutionary signals. Additionally, the analysis indicated reduced evolutionary noise, referring to the limited interference from random mutations, and robust evolutionary propulsion, indicating strong directional selection maintaining specific mutations. These factors might contribute to the persistent recurrence of dengue outbreaks by ensuring that advantageous mutations are conserved and promoted through natural selection (Schmidt et al., 2011). In contrast, base substitution dynamics across the serotypes were primarily characterized by transversional pairs (SV) with R-values below 1, notably with taxon5 registering the highest R-value at 0.99 (Figure 4B and Supplementary Table 4, sheet 2). R-values below 1 indicated a higher rate of transversion mutations relative to transitions, which could lead to more radical changes in the nucleotide sequence. These findings indicated that while most Flaviviridae species, such as West Nile virus and Zika virus, maintained stable evolutionary trajectories characterized by balanced mutation rates; viruses with multiple serotypes or subtypes, such as DENVs and Hepatitis C virus, possessed broader evolutionary capacities. These evolutionary capacities include a higher propensity for recombination with rapidly evolving species, such as influenza viruses or SARS-CoV-2. This increased recombination potential necessitated stricter conservation of molecular genetic markers to ensure accurate DENV identification (Focosi and Maggi, 2022). Additionally, the significant share of identical pairs among the four DENV serotypes (>93%, Supplementary Table 4, sheet 2) provided a wide range of sequence variations for barcode segment extraction. This extensive sequence space (identical pairs) allowed for the development of highly specific and sensitive barcode segments that could effectively distinguish between closely related viral strains.
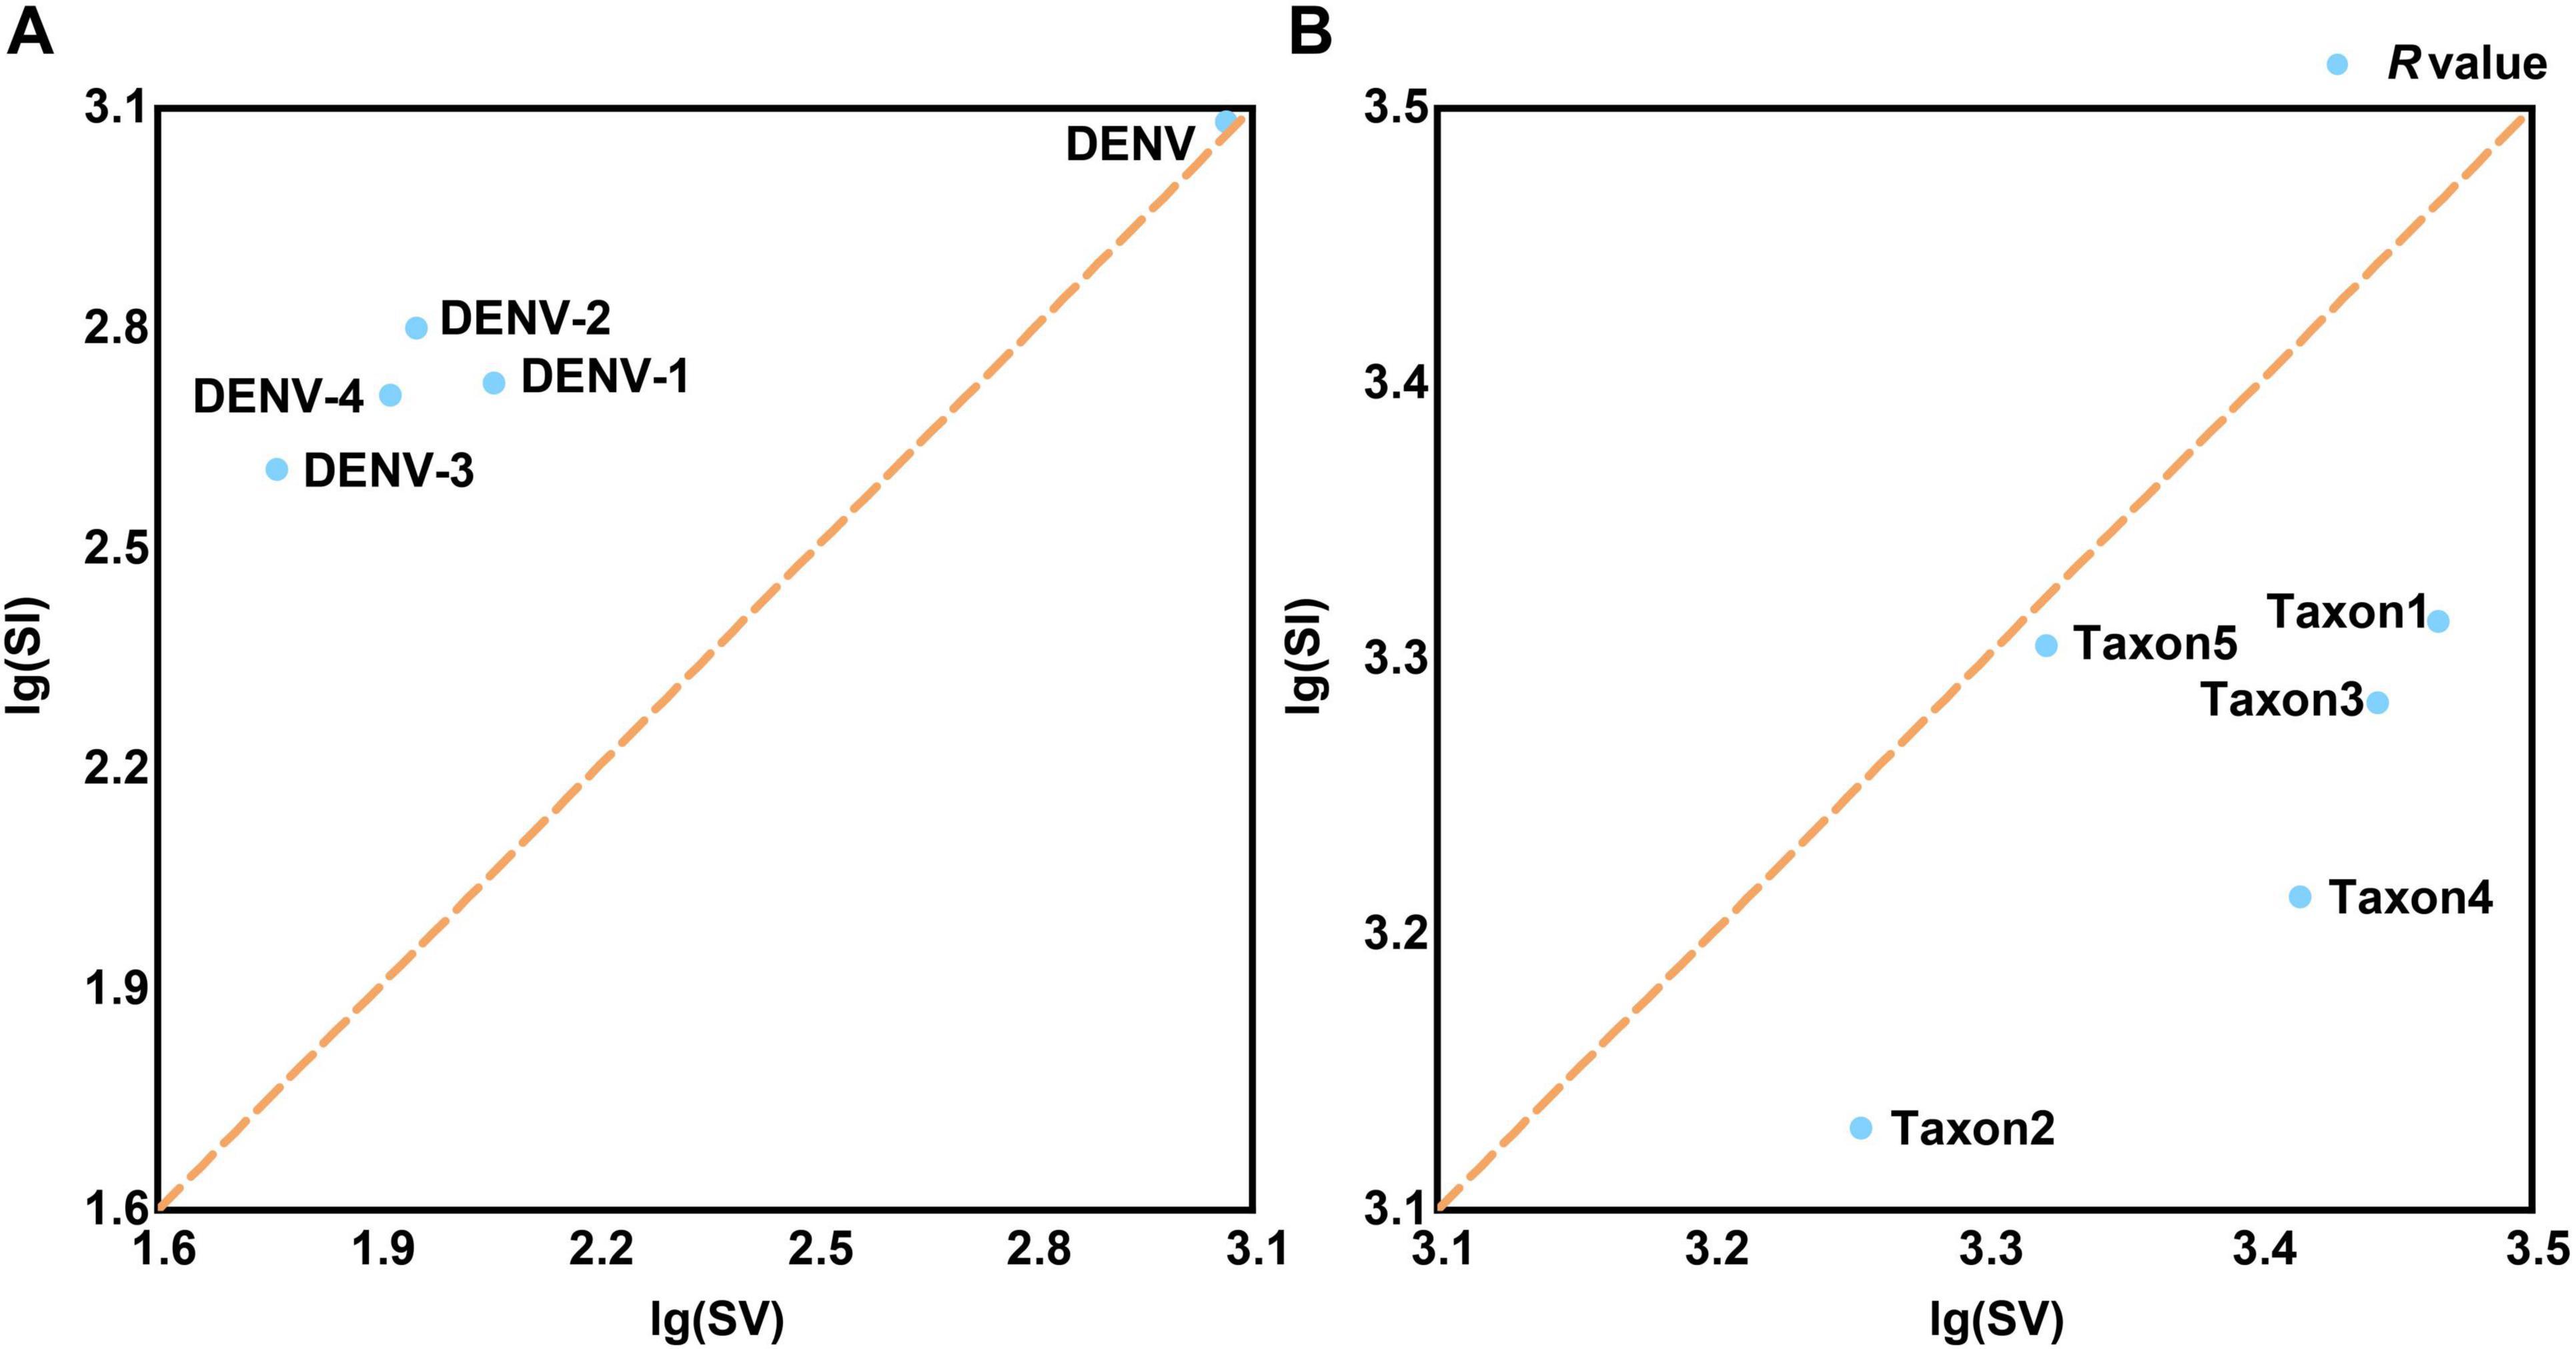
Figure 4. The tests for the frequencies of base substitution. (A) The frequencies of base substitution in TRS. (B) The frequencies of base substitution in TES-1. The common logarithmic treatment is applied since the SI and SV values of viral strains differ significantly. The brown dashed diagonal line (x = y) divides the coordinate system into upper and lower regions. The R-value [the ratio of lg(SI) and lg(SV)] anchor point is above the line (R-value > 1), suggesting that the species’ base substitution form is biased toward SI, otherwise the form is biased toward SV (R-value < 1). SI, transitional pairs; SV, transversional pairs.
Substitution saturation testing results (Table 3) (P-value < 0.0185) showed that Iss values were consistently lower than the Iss.cSym values across all categorized groups. The Iss measured the extent to which multiple substitutions have occurred at the same nucleotide site, potentially obscuring true evolutionary relationships. An Iss value lower than Iss.cSym indicated that substitution saturation was minimal, ensuring that the sequence data retained sufficient phylogenetic signal for reliable evolutionary analysis. For the Flavivirus species, the Iss and Iss.cSym values were closely aligned (0.7370 vs 0.7895). This proximity suggested that substitution saturation was approaching a level that could compromise the accuracy of phylogenetic inferences within the Flaviviridae family.
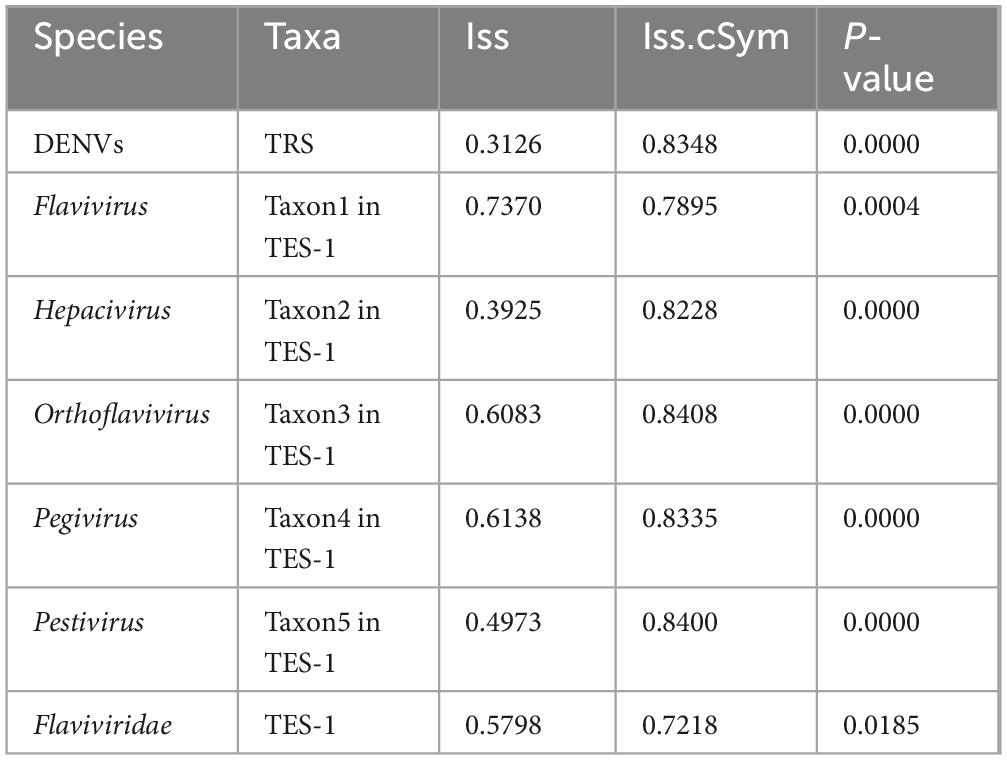
Table 3. The substitution saturation testing results of TRS and TES-1.
Population genetic characteristicsThe maximum interserotype GEDI observed between DENV-1 and DENV-4 was 0.3821, while the overall mean GEDI for the four DENV serotypes was 0.2517 (Figure 5A and Supplementary Table 4, sheet 3). These values were significant because they demonstrated that the genetic divergence between different serotypes (interserotype) was notably higher compared to the divergence observed within the same serotype (intraserotype). Specifically, the maximum interserotype GEDl was 6.0 times greater and the overall mean GEDl was 4.0 times greater than the minimum intraserotype GEDl observed for DENV-2 (0.0632). This high interserotype GEDl indicated greater genetic distance between serotypes, facilitating the use of barcode segments to reliably distinguish between them. Furthermore, GEDI values for TES-1 (0.6840) and taxon3 (0.8073) were 3.8 and 2.4 times greater than that of the overall DENVs group (without differentiation by serotype, 0.1786 and 0.3416, respectively) (Figure 5B and Supplementary Table 4, sheet 3). This indicated that genetic variation among phylogenetically closer groups within the four DENV serotypes was significantly less compared to that of more distantly related groups. Specifically, the GEDI values showed that the four DENV serotypes shared a high level of genetic similarity, whereas the TES-1 and taxon3 groups exhibited higher genetic divergence. These findings suggested that the relatively lower genetic variation within the DENV serotypes made it easier to identify and differentiate them using barcode segments, which was crucial for accurate serotype classification and surveillance.
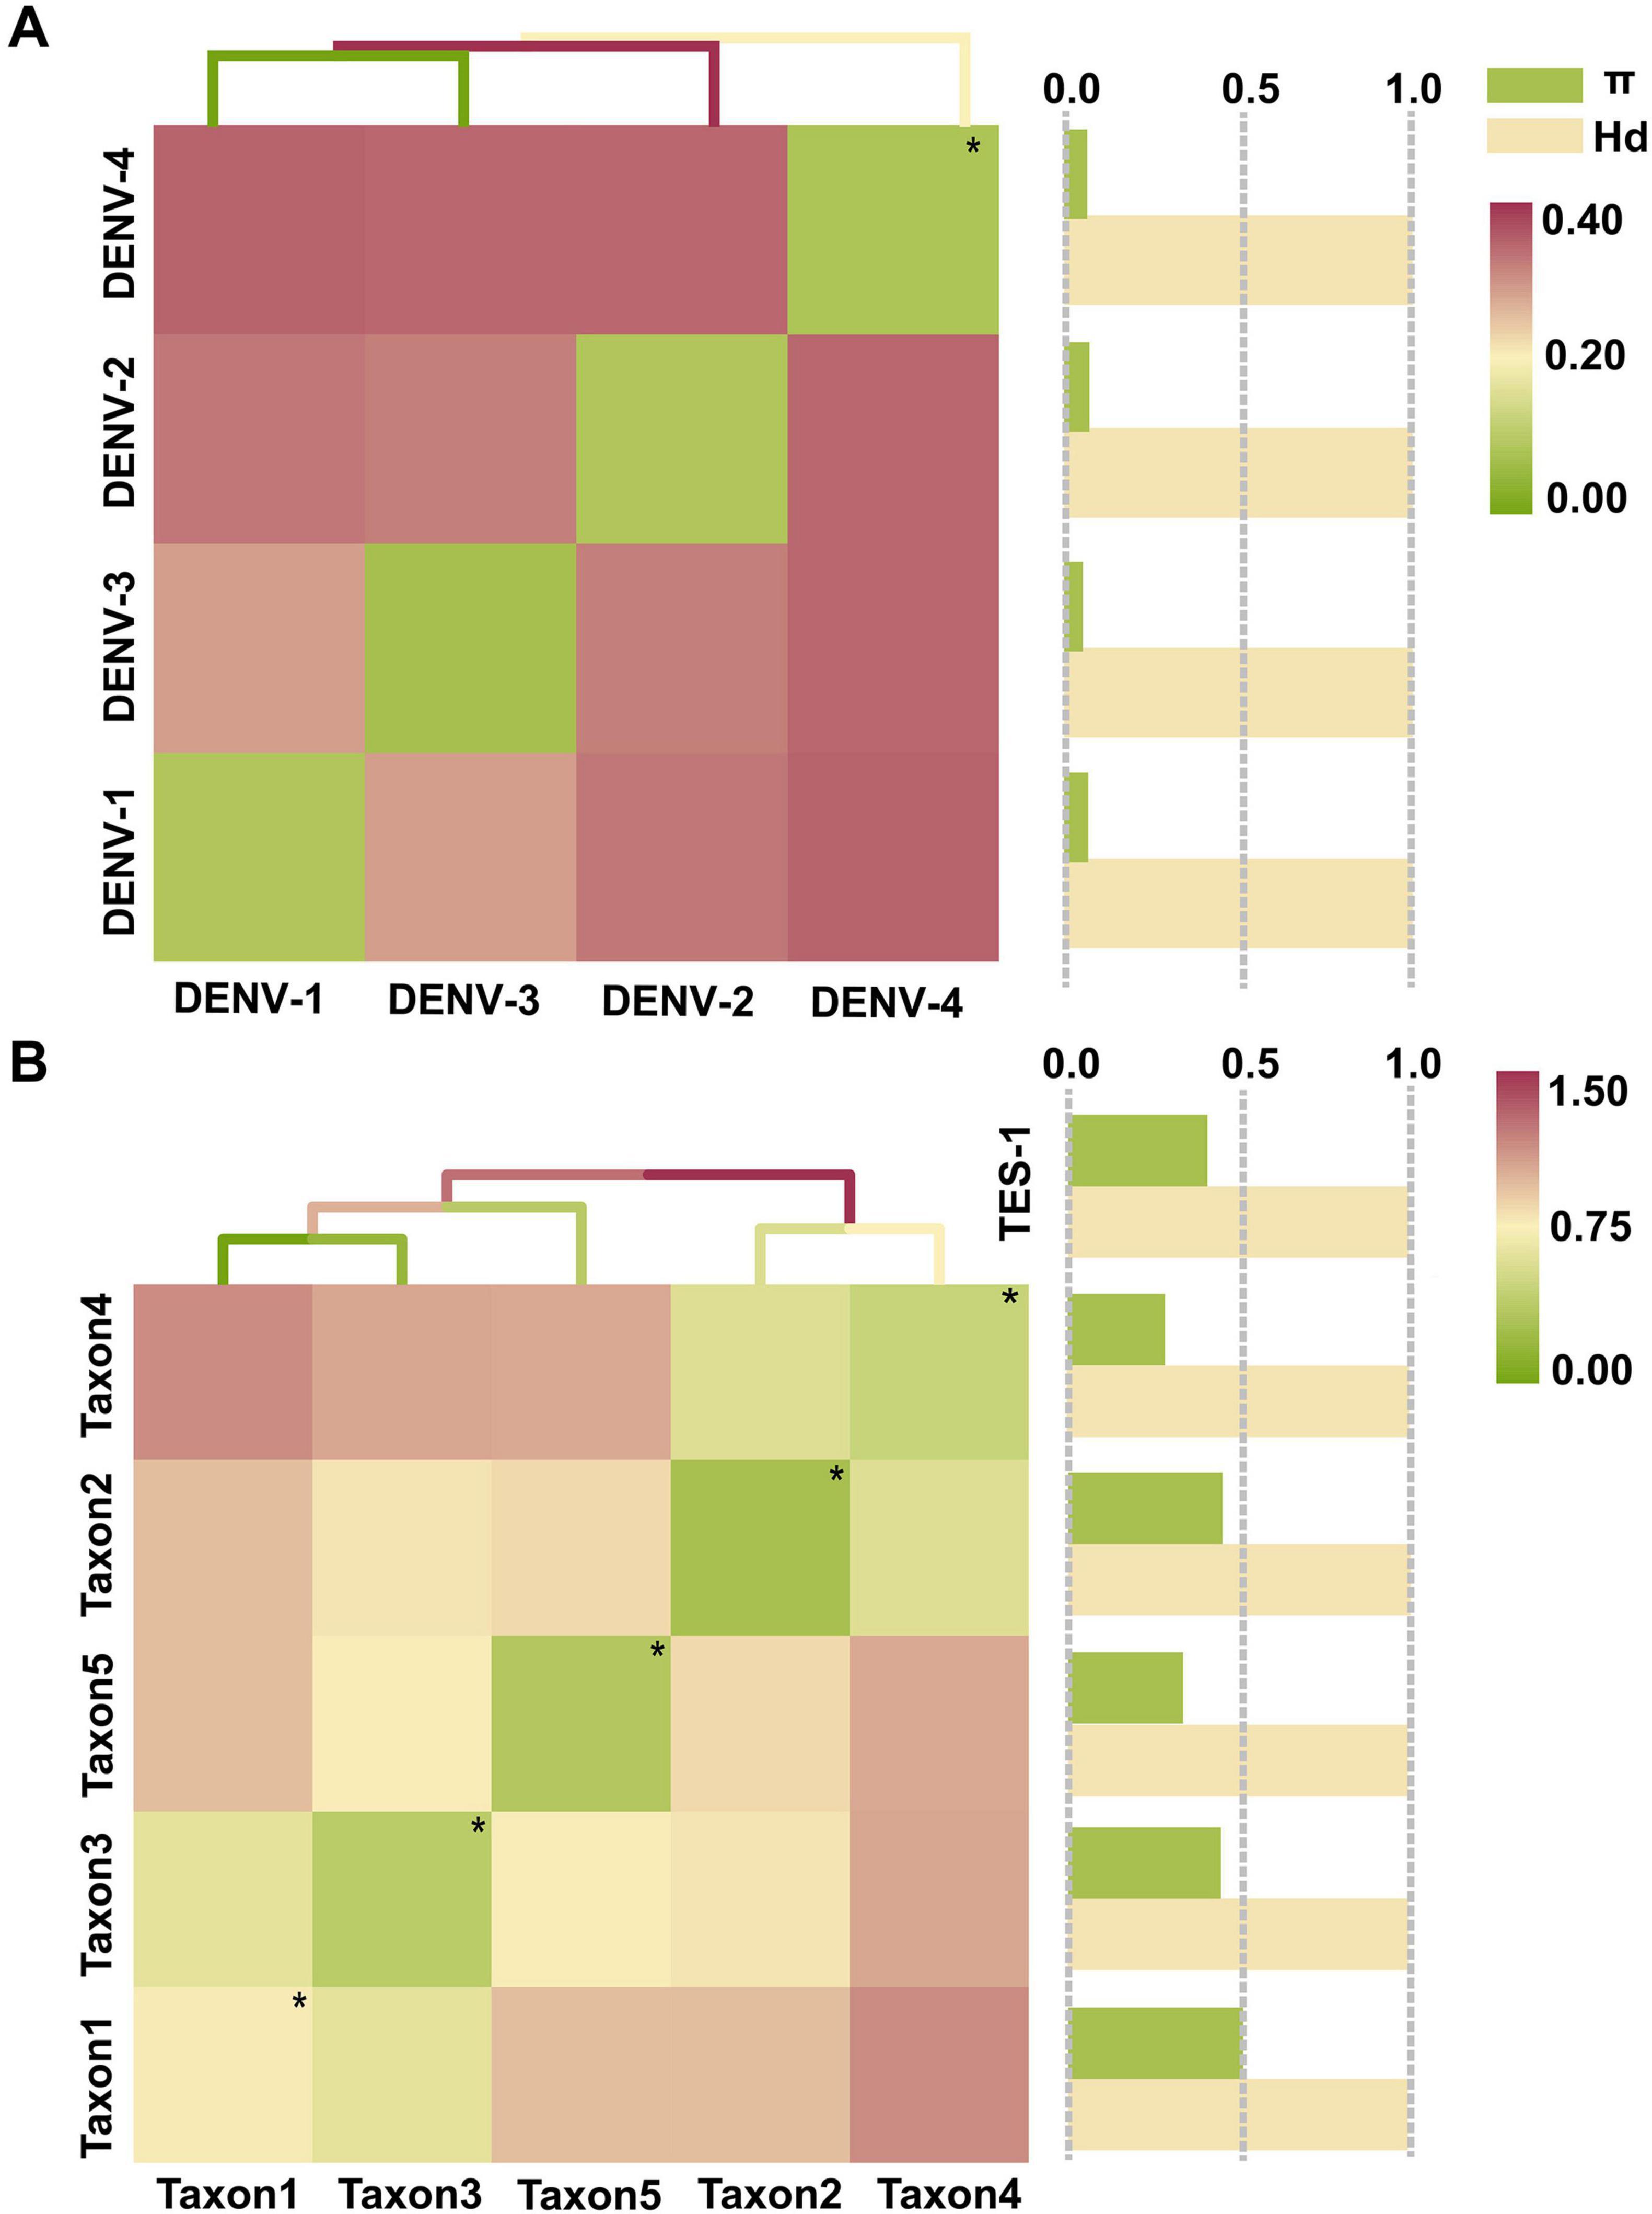
Figure 5. The tests for GEDI matrix and gene flow. (A) GEDI matrix and gene flow of TRS. (B) GEDI matrix and gene flow of TES-1. The diagonal line of the matrix heat map with “*” and small green spots indicates the average intraserotype GEDI. π and Hd are normalized values (The normalized interval is “[0, 1]”). Hd, Haplotype (gene) diversity; π, Nucleotide diversity.
Gene flow assessments revealed that the haplotype diversity (Hd) among the four DENV serotypes was very high, ranging from 0.9995 to 0.9998 (Figure 5A and Supplementary Table 4, sheet 4), indicating almost complete diversification of haplotypes. Similarly, diversification among species within the Flaviviridae family and genera was showed near complete the diversity of haplotype, with Hd values ranging from 0.9910 to 1.0000 (Figure 5B and Supplementary Table 4, sheet 4). Taxa 1, 3, and 4 had nucleotide diversity (π) values of 0.5104, 0.4455, and 0.4503, respectively, which surpassed the overall π value of TES-1 (0.4063). In contrast, taxon2 and taxon5 had lower π values of 0.2838 and 0.3354, respectively, highlighting substantial divergence in genetic variation among Flaviviridae species. Specifically, the higher π values in taxa 1, 3, and 4 suggest increased genetic diversity, while the lower values in taxon2 and taxon5 indicate reduced genetic variation, pointing to differing degrees of genetic exchange between these taxa. Furthermore, π values among the four DENV serotypes ranged from 0.0440 to 0.0625, providing evidence of genetic exchange among them.
Phylogenetic analysisAfter thorough examination and alignment with data from the NCBI-Taxonomy database, it became evident that the Flavivirus genus suffered from a convoluted species classification. This genus was populated with many unclassified Flavivirus species. These entries compromised the precision and visual clarity of phylogenetic analyses within the Flaviviridae family. Considering that the barcode segments designed in our study aimed mainly at identifying DENVs, we opted to temporarily exclude Flavivirus species from phylogenetic investigation. The efficacy of barcode segments for differentiating Flavivirus species (TES-3-1) would be further deliberated in the subsequent segment “Barcode segments testing”.
The maximum likelihood phylogenetic trees offered superior species classification with unambiguous branches (Figures 6A–C). In contrast, the Bayesian tree was suboptimal with fewer counts (Supplementary Figure 1). Phylogenetic results highlighted a pronounced differentiation boundary for DENVs at the serotype level and at the genus or family levels. These findings suggested the presence of stable molecular genetic markers within DENVs, such as specific non-coding regions and conserved structural protein genes, that distinguished between different serotypes and other closely related species, influencing their adaptive evolution over the long term. Phylogenetically, DENV-1 and DENV-3 shared a closer relationship compared to DENV-2 and DENV-4 (Figure 6A). The distant branches and greater divergence from the common ancestor suggested that DENV-2 and DENV-4 had a stronger trend toward species expansion and robust adaptive evolutionary potential. In Figure 6B, the circular phylogenetic tree revealed that the evolutionary distance between DENVs and Taxon3 was relatively small, suggesting that they might share a common ancestor or have undergone similar environmental selective pressures. The red branches representing DENVs were clearly clustered together, indicating minimal genetic divergence among them and suggesting they could be classified as a single group, reflecting the close relationships among the four serotypes. The observed clustering of Taxon3 and DENVs suggested a shared evolutionary history or the retention of similar characteristics within their genomes. This phenomenon implied that these species might have experienced similar selective pressures or horizontal gene transfer events (e.g., genome integration), resulting in comparable genetic traits. Figure 6C depicted the complex evolutionary relationships among different taxa using a circular phylogenetic tree. Several longer branches indicated that these species or taxa had undergone significant evolutionary divergence, likely due to different environmental selective pressures or events such as genome recombination. In contrast, shorter branches represented smaller differences between species, which commonly occurred within the same group, such as the DENV population. The clustering of DENVs in the phylogenetic tree suggested minimal genetic variation among them, while their proximity to other groups (e.g., Taxon3 and Taxon5) might indicate a shared evolutionary background (Postel et al., 2021). As DENVs have evolved to enhance specific virulence factors, such as increased expression of the NS1 protein that aided immune evasion and viral replication, it was crucial to be cautious of increased transmissibility and avoiding cross-infection with different diseases, which could lead to unknown immune evasion scenarios (Zimmerman et al., 2018).
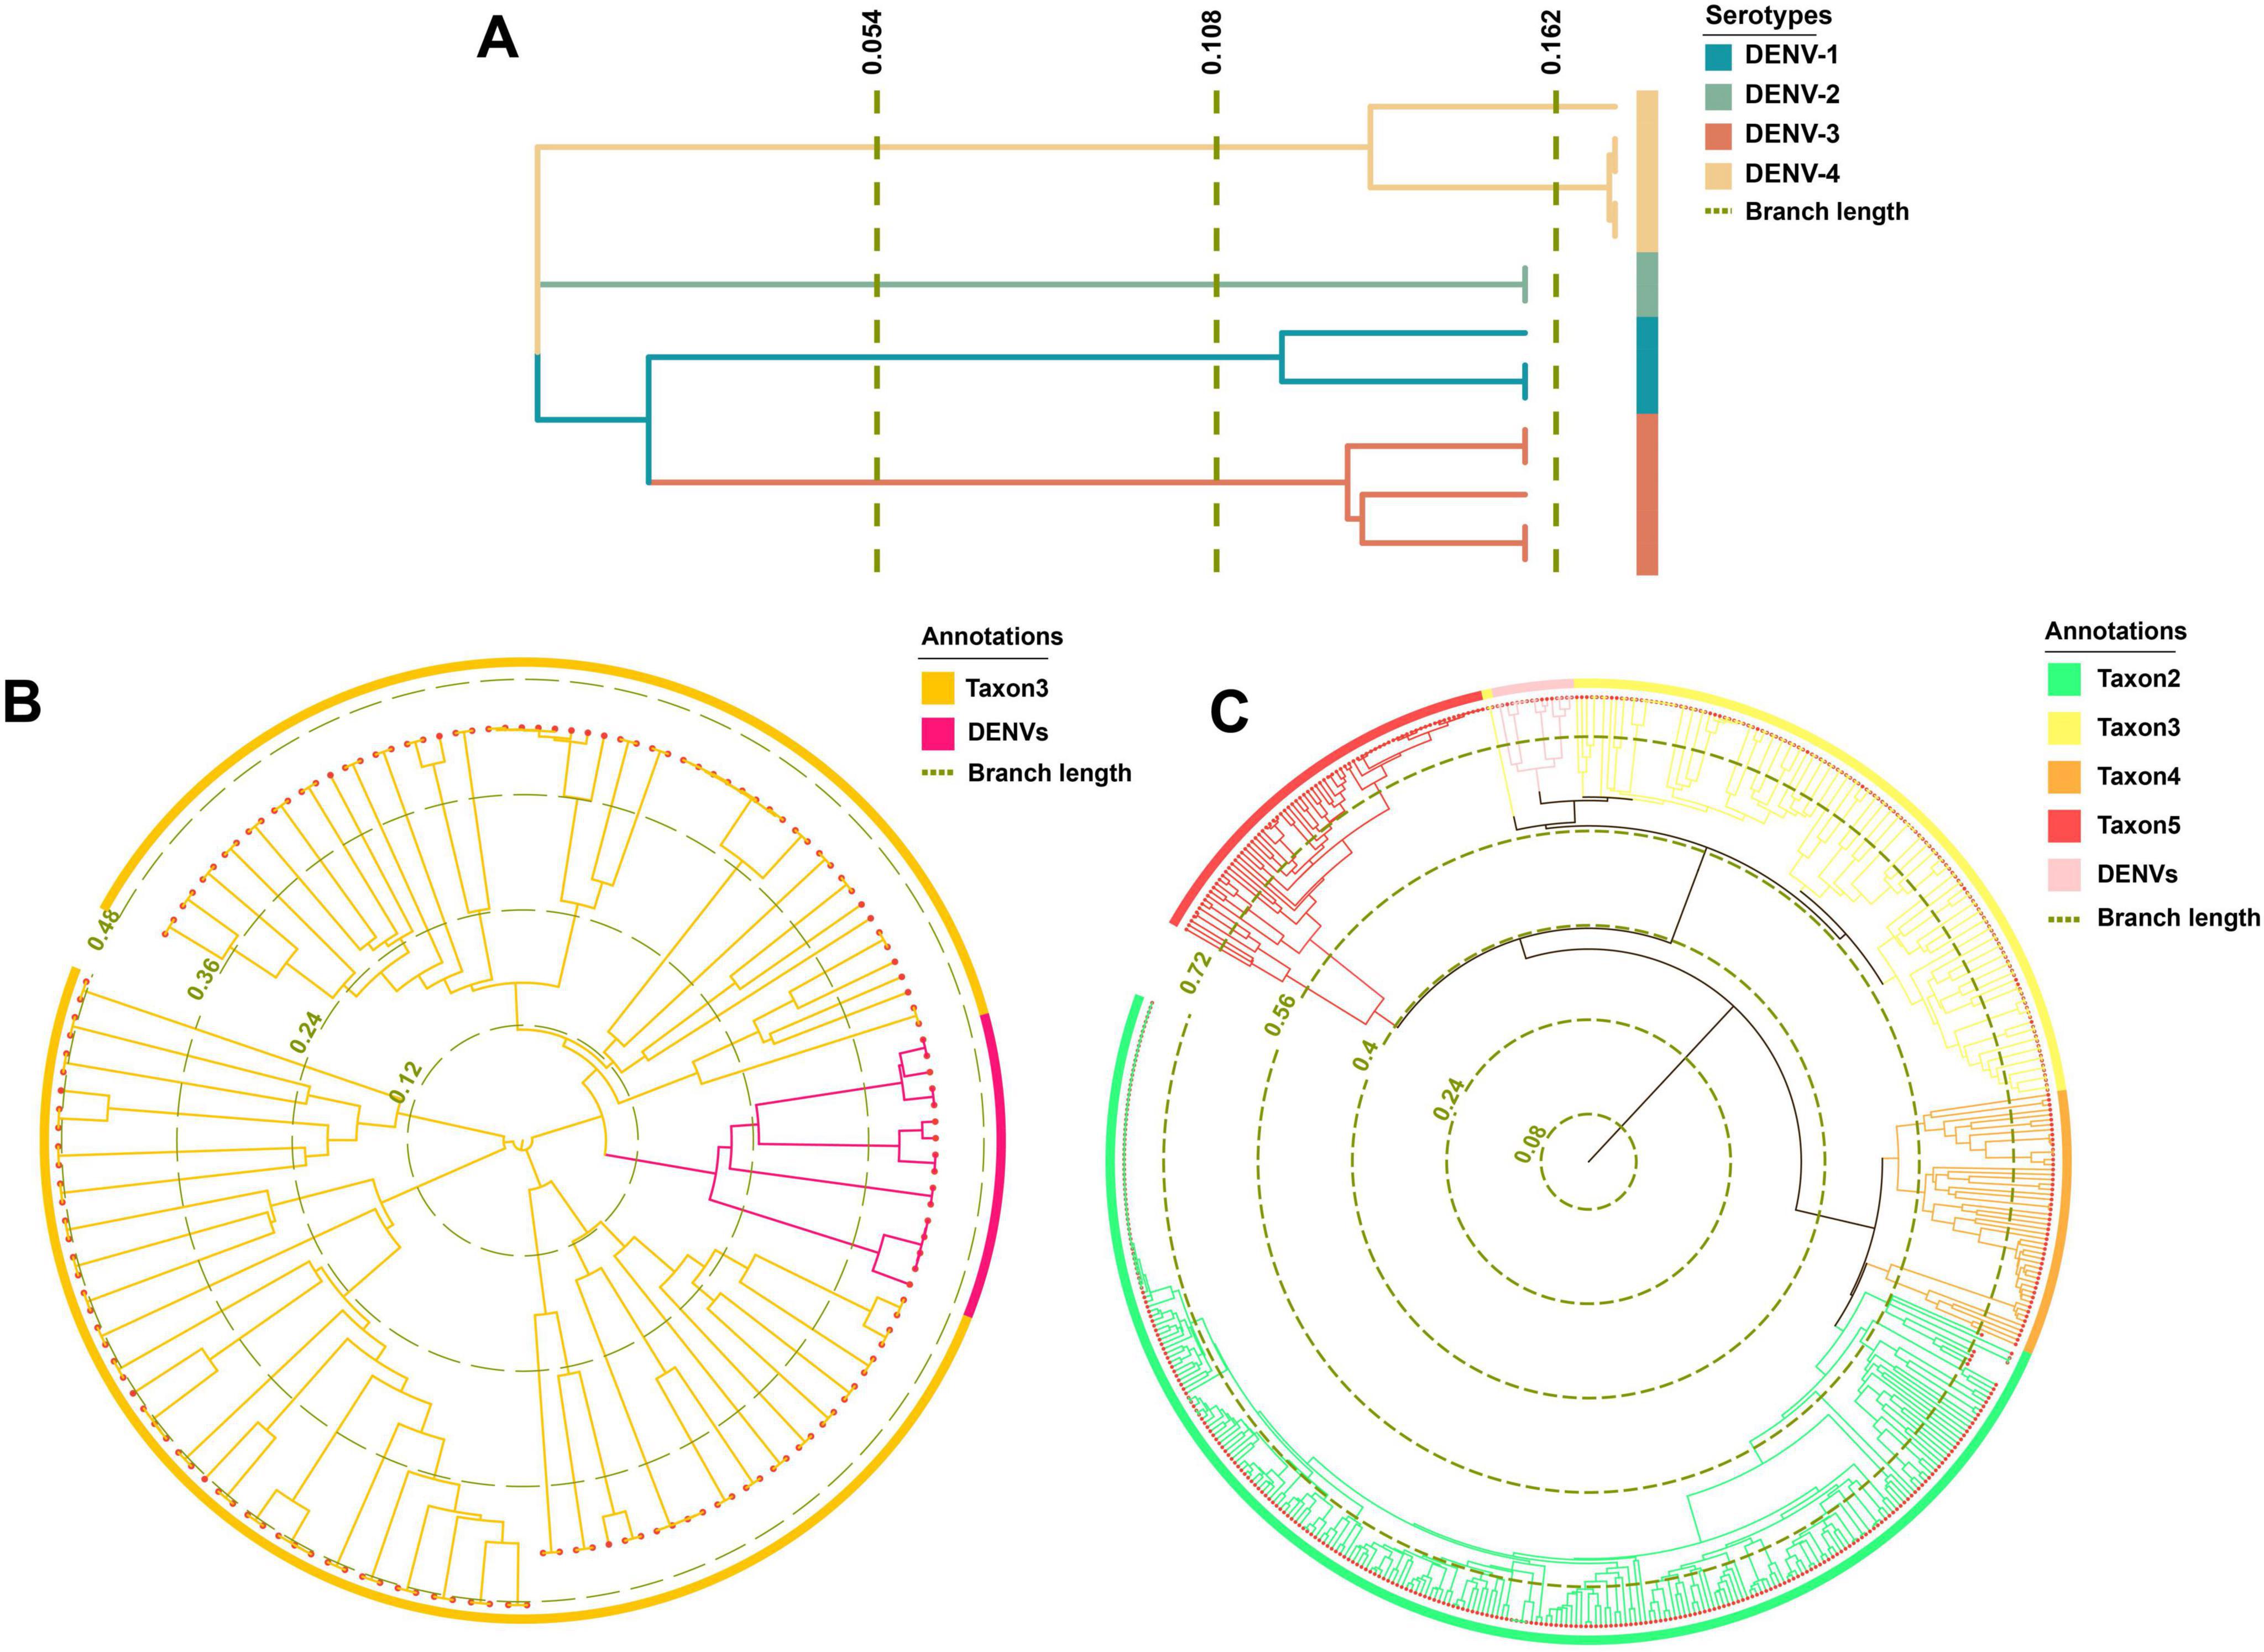
Figure 6. Phylogenetic analysis results. (A) The phylogenetic tree of TRS. (B) The phylogenetic tree of taxon 3. (C) The phylogenetic tree of TES-1.
Visualization of barcode segmentsThe comprehensive cohort of DENVs contained a total of 9,366 SNP sites. Specifically, DENV-1, DENV-2, DENV-3, and DENV-4 had 6,673, 7,213, 5,985, and 4,943 SNP sites, respectively (Supplementary Table 4, sheet 5). These numbers reflected the genetic variability within each serotype, with DENV-2 showing the highest number of SNP sites, indicating potentially higher evolutionary activity compared to other serotypes. Following the selection framework delineated in the “Barcode segments screening and visualization” section, segments of suboptimal quality were removed. After Blast verification (P-value < 0.05), eight SNP-rich barcode segments with high BSW scores were isolated and cataloged (Table 4 and Supplementary Table 5). Based on the criteria of maximal E-value, the usage level of barcode segments DENV-1.2 (600) and DENV-4.2 (600) was designated as “Alternative”, while the others were classified as “Optimal”. All barcode segments were in the 3’ untranslated regions according to Blast results on NCBI. Consequently, the identification efficacy of these barcode segments was not compromised by mutations in CDSs or large-scale genomic variations, prolonging their effective duration of use in virus identification studies. The barcode segments of DENV.2 and DENV-2.1, with the highest BSW scores of 5.93 and 5.94 respectively, appeared to be the most suitable for deployment in complex settings, such as metagenomic analyses involving diverse environmental samples or high-throughput sequencing platforms used for large-scale epidemiological studies (Lizarazo et al., 2019).
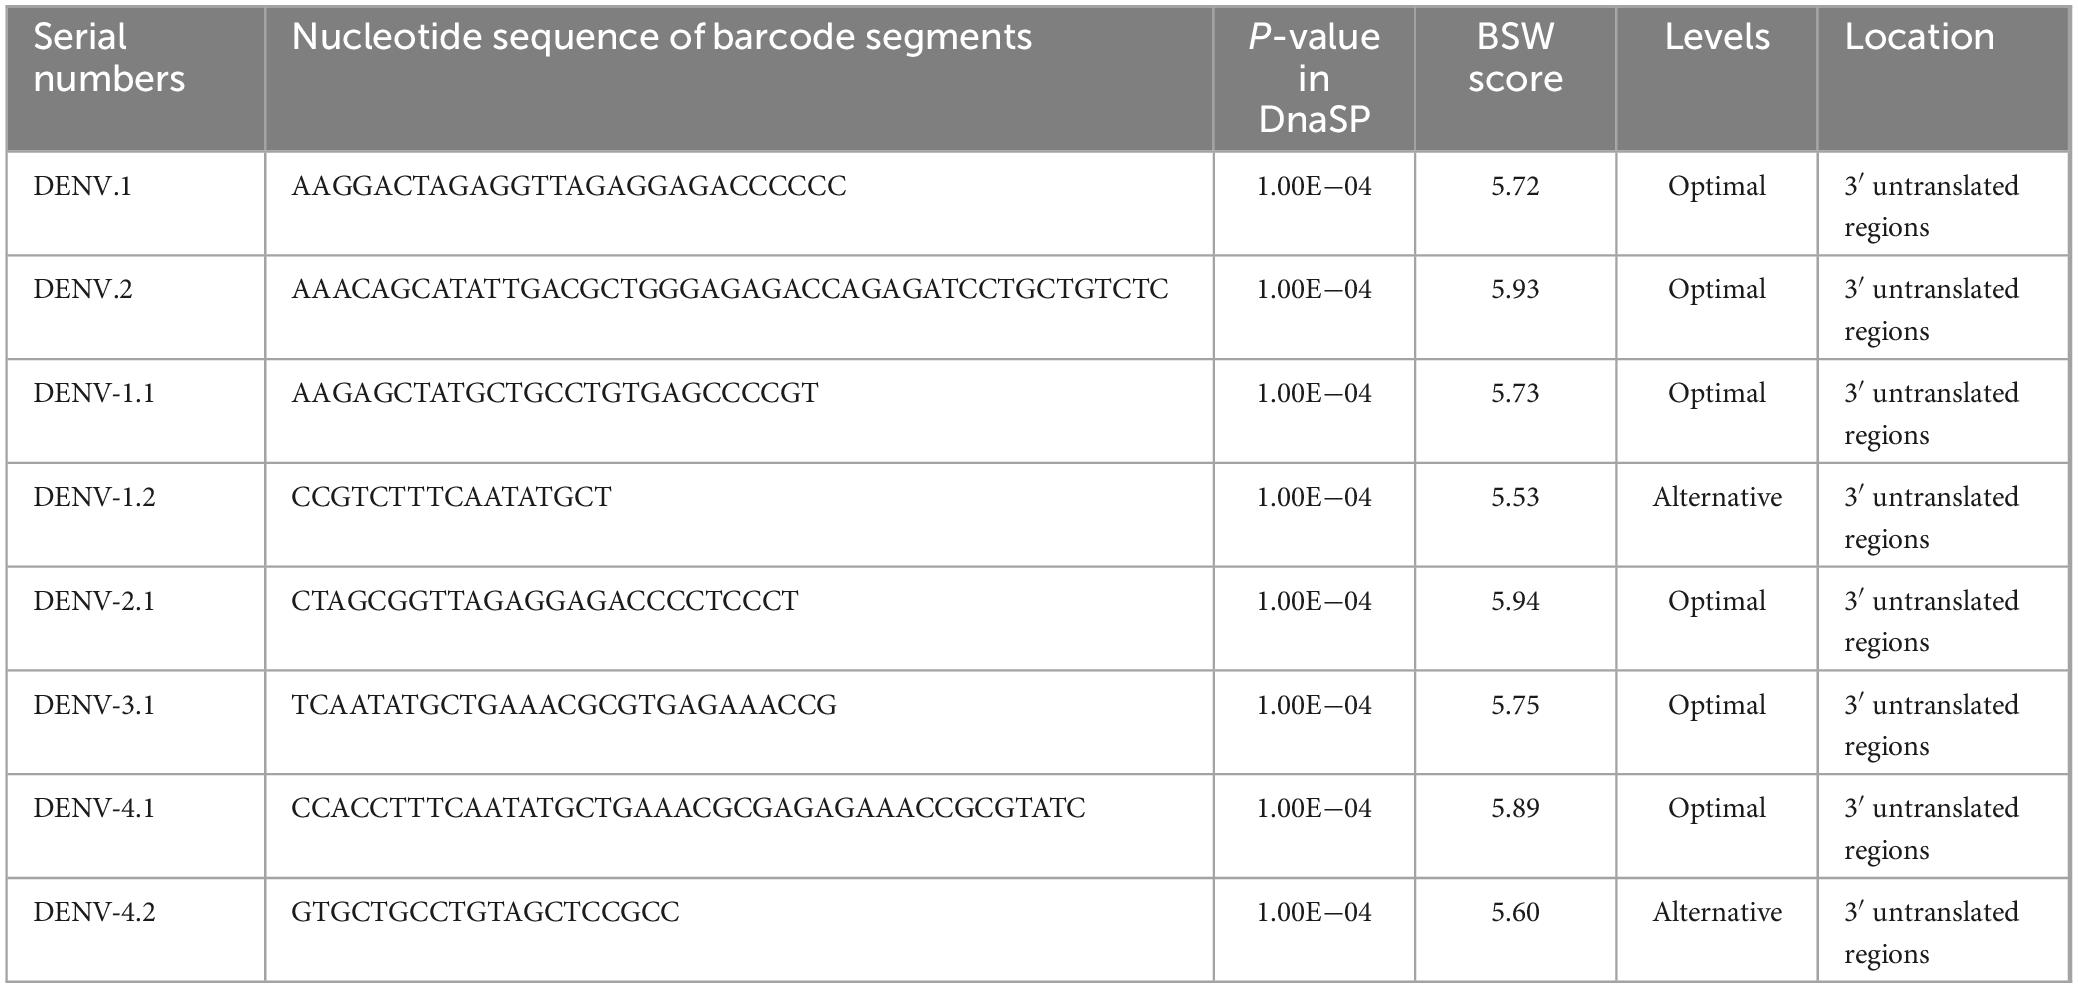
Table 4. Basic information of DENV-specific and DENV serotype-specific barcode segments.
Ultimately, barcode segments were visualized as a combination of 1D and 2D codes, which together provided comprehensive information about the sequences and allowed efficient data retrieval. The 1D codes, presented in text format, displayed essential information such as sequence length, base composition, and Blast result parameters in a clear and intuitive manner (Figure 7A). The inclusion of 2D codes facilitated rapid information retrieval by allowing users to scan the code using mobile devices or scanners to directly access sequence annotations and Blast analysis results, providing an efficient means of sharing and accessing barcode information (Figure 7B). This dual coding approach enhanced accessibility and made data interpretation faster and more user-friendly, especially in field research and laboratory settings where rapid information exchange was critical.
留言 (0)