Despite being Earth’s largest microbial habitat, the subsurface remains understudied due to its inaccessibility (Whitman et al., 1998; Amend and Teske, 2005; Kallmeyer et al., 2012; Edwards et al., 2012; Colwell and D’Hondt, 2013; McMahon and Parnell, 2014). Microbes in the deep continental subsurface respire orders of magnitude slower than their surface-dwelling analogs (Onstott et al., 1999; Price and Sowers, 2004), and catabolize up to a million times slower than laboratory cultures grown in nutrient-rich media (Hoehler and Jørgensen, 2013). This leads to calculated doubling times, ranging from hundreds to thousands of years (Phelps et al., 1994; Jørgensen and D’Hondt, 2006; Lin et al., 2006).
Determining the catabolic reactions catalyzed by such slow-growing microbes is challenging, as many typical metabolic rate measurements are not designed to detect extremely low levels of activity. For example, measuring microbial turnover rates during incubations (Hoehler and Jørgensen, 2013) is not applicable to the extremely slow metabolic processes characteristic of subsurface systems (Parkes et al., 2005). Furthermore, interpreting the results of such lab-based experiments is often complicated by shifts in the community resulting from selective growth under incubation conditions. Metatranscriptomic analysis of the microbial community RNA provides an alternative option to assess microbial activity in the subsurface. This approach, however, is hampered by difficulties with RNA extraction (Schippers et al., 2005; Biddle et al., 2006; Orsi et al., 2013; Urich et al., 2014; Pachiadaki et al., 2016; Zinke et al., 2017) and limited by the quantity of in-situ activity.
To overcome these limitations, we used a nanocalorimeter to measure the heat associated with microbial activity in underground samples collected from the Sanford Underground Research Facility (SURF). Calorimetry allows for the agnostic measurement of heat flow and therefore records the total change in enthalpy for all reactions occurring in a system, biotic and abiotic. Additionally, this technique boasts a low detection limit, ~1.2 nW/mL (Braissant et al., 2010). Nanocalorimetry can measure potential bacterial heat production in cell cultures of approx. 1 × 10²–3 cells/mL (Higuera-Guisset et al., 2005; Braissant et al., 2010; Robador et al., 2018) and natural samples of 1 × 10³–4 cells/mL (Robador et al., 2016). Cell densities in SURF samples are well within this range, between 1 × 10³ cells/mL and 4 × 10⁵ cells/mL. Furthermore, the sum of the total heat over time was complemented with concentration measurements of products and reactants evolving during the experiment to thermodynamically constrain the reactions being catalyzed. For example, Robador et al. (2018) used this technique to identify microbial lactate oxidation as the key reaction in a system where multiple microbial metabolic pathways could be employed. Prior studies at SURF revealed discrepancies in metabolic predictions at identical boreholes, noting that while sulfate and nitrate reduction pathways were frequently identified, they were not the most energetically advantageous (Osburn et al., 2014; Momper et al., 2017). Further analysis of functional genes across DeMMO sites by Momper and colleagues in 2023 showed that genomic potential did not align with the predominant geochemical species at each location. However, the 2023 study also reported ubiquitous potential for the metabolism of small organic molecules, such as amino acids and acetate. This study aims to identify which metabolic pathways are actively employed by microbes, focusing on their actual metabolic activities instead of their potential capabilities.
2 Materials and methods 2.1 Sample collection and geochemical characterizationSamples were collected from all the Deep Mine Microbial Observatory (DeMMO; Osburn et al., 2019) at the Sanford Underground Research Facility (SURF) in Lead, South Dakota, United States. SURF is located within the former Homestake Gold Mine and DeMMO accesses groundwater from six separate areas within SURF, ranging in depth from 244 m to 1,478 m beneath the surface. Prior research utilizing the DeMMO infrastructure has developed a geochemical and biological time series (Osburn et al., 2019; Osburn et al., 2020), and explored the metabolic capabilities at SURF through in-situ cultivation and studies on energetics and metagenomics (Osburn et al., 2014; Momper et al., 2017; Casar et al., 2021a; Casar et al., 2021b; Momper et al., 2021; Momper et al., 2023).
The samples retrieved for this study were obtained in tandem with those of long-term monitoring for geochemical and biological variability within the DeMMO network (Osburn et al., 2019). All six DeMMO boreholes were sampled (DeMMO 1–6) during two expeditions, on December 5–10th, 2016, and September 9–14th, 2018. Data from the time of sampling is available in Table 1. Detailed sampling procedures for geochemical and community analysis are available in companion studies (Osburn et al., 2019; Osburn et al., 2020). As described in these studies, geochemical analysis was performed on samples either directly at the field site or after being prepared and shipped to the laboratory for more comprehensive processing. At the field, temperature, pH, redox-sensitive ions, oxidation reduction potential (ORP), and conductivity were measured using a Hach field testing kit (Hach, Loveland, CO, United States) and a Myron Ultrameter II (Myron L Company, Carlsbad, CA, United States). Additional geochemical analyses were carried out in other academic or commercial labs: major dissolved cations and anions (ACZ Laboratories, Steamboat Springs, CO, United States), dissolved organic carbon (DOC; Anatek Labs, Moscow, ID, United States) and dissolved inorganic carbon (DIC; Northwestern Stable Isotope Biogeochemistry Laboratory, Evanston, IL, United States). Dissolved gasses were measured via gas chromatography on a Shimadzu GC-2014 using FID and TCD detectors and referenced to Scott analytical standards (Air Liquide, Paris, France). Cells from field samples were fixed with paraformaldehyde and stored at −20°C prior to staining with DAPI (4′,6-diamidino-2-phenylindole) and concentration onto a 0.22 μm black polycarbonate filter (Millipore, Burlington, MA).

Table 1. Geochemical concentrations at six DeMMO boreholes during two sampling trips.
2.2 CalorimetryGroundwater samples for calorimetry were collected in sterile, anaerobic, glass serum bottles. Prior to fieldwork, the bottles were combusted at 400°C for 4 h, closed with butyl stoppers and seals, then flushed with nitrogen gas until anaerobic. The anaerobic combusted bottles were autoclaved at 121°C for 30 min, prior to being evacuated to maximum achievable negative pressure. In the field, the tops of the prepared serum bottles were sterilized with 70% isopropanol wipes, and Viton® tubing (DuPont Performance Elastomers LLC, Wilmington, DE, United States) and needles were used to anaerobically and aseptically transfer fluids from the boreholes to the bottles. For each borehole, at least one serum bottle was filled with borehole water that first passed through a 0.2 μm filter. A few weeks after samples were returned to the lab, these filtered borehole water samples were stained with acridine orange and collected onto a 0.22 μm black polycarbonate filter (Millipore, Burlington, MA) prior to visualization on a Zeiss Axiovision Epifluorescent Microscope to inspect for growth indicative of contamination, but no cells were observed in any of the filtered water bottles.
All borehole fluids were kept at 4°C following sample collection until placed in the calorimeter. Samples for calorimetry were prepared as described by Robador et al. (2016), with slight modifications. Briefly, 4 mL TA Instruments ampules were sealed with aluminum foil and combusted at 400°C for 4 h (TA Instruments, New Castle, DE, United States). Combusted ampules were then autoclaved at 121°C for 30 min. Groundwater was aseptically and anaerobically removed from the serum bottles collected in the field and 2 mL was transferred into each ampule in a Coy Laboratories anaerobic chamber (Grass Lake, MI, United States) at <5 ppm oxygen. Ampules were sealed with a crimp top cap, which includes a built-in rubber stopper. For the experiments that included amendments, the added chemical was mixed with the groundwater aseptically in the anaerobic chamber prior to being transferred into the calorimetric ampule.
For all calorimetric analyses, a TAM III thermal activity monitor (TA Instruments-Waters LLC, New Castle, DE, United States) equipped with two nanocalorimeters was equilibrated to 28°C prior to the start of experiments. Reference ampules, calorimetric samples identical in chemical composition to the groundwater sample ampules, but with biomass removed via a 0.1 μm filter, were loaded into the reference position in each calorimeter prior to the beginning of each new experiment. Once the reference ampules equilibrated with the calorimeters, samples were lowered into the sample slots on each calorimeter, allowing for thermal equilibration halfway through the lowering process into measuring position.
Due to the high system sensitivity, it is necessary to adjust the experimental data to compensate for the heat produced when lowering experimental ampules into the calorimeter’s measuring position. In this manuscript, two methods were utilized for the removal of perturbation signal. For low total-signal samples (such as in Figures 1–3), the “synchronization method” was used, which involved synchronizing the heat signals across all experiments to make the initial disruption in each experiment’s heat curve easily recognizable. Only data collected after this initial surge of heat are presented; any data collected before this convergence point are deemed artifacts resulting from the insertion process and are thus disregarded. In the amino acid amended experiments (such as in Figures 4, 5), microbial activity generated a significant heat signal, allowing for the use of the less human-biased “power function method.” This permitted the use of a power function (f(x) = a*xb + c) to model the artificial heat effects. The function helped identify the initial and final data segments as background noise due to disturbances resulting from the insertion of the sample, which were then excluded from the analysis. An illustration of this method can be found in Supplementary Figure 1. A variety of negative controls were tested to subtract out the potential confounding factors in quantification. To assess whether the 0.1 μm filtered borehole fluid in the reference ampule was not, in fact, sterile, reference ampules were prepared with borehole fluid autoclaved once, twice, and once with additional 0.1 μm filtration. Different methods to reduce baseline heat signal introduced during sample-insertion process were also tested. The duration of time that the sample was allowed to equilibrate during lowering was varied, as was the time the sample was given to return to 28°C after storage at 4°C. Based on this test work, the methodology described earlier in this section for reference and sample ampule handling was selected.
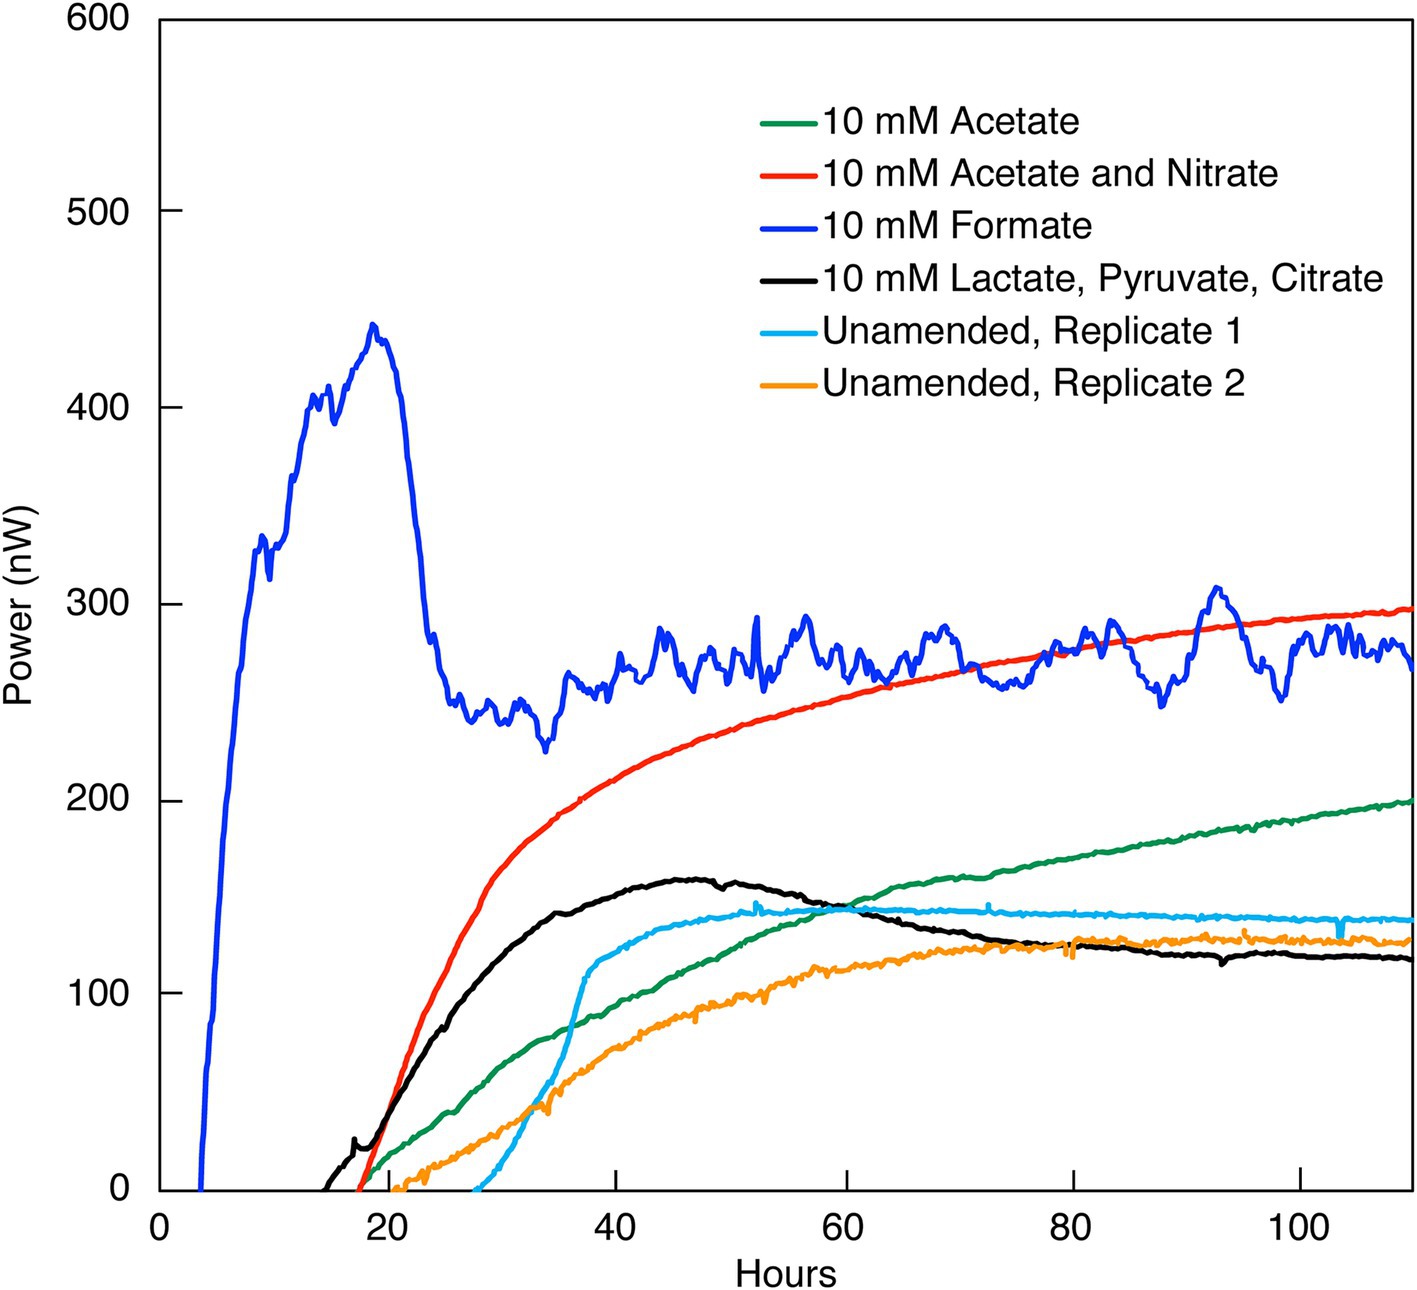
Figure 1. Heat flow (Power) from the indicated amendments to DeMMO 6 borehole fluid. The baseline heat flow signal has been corrected using the synchronization method.
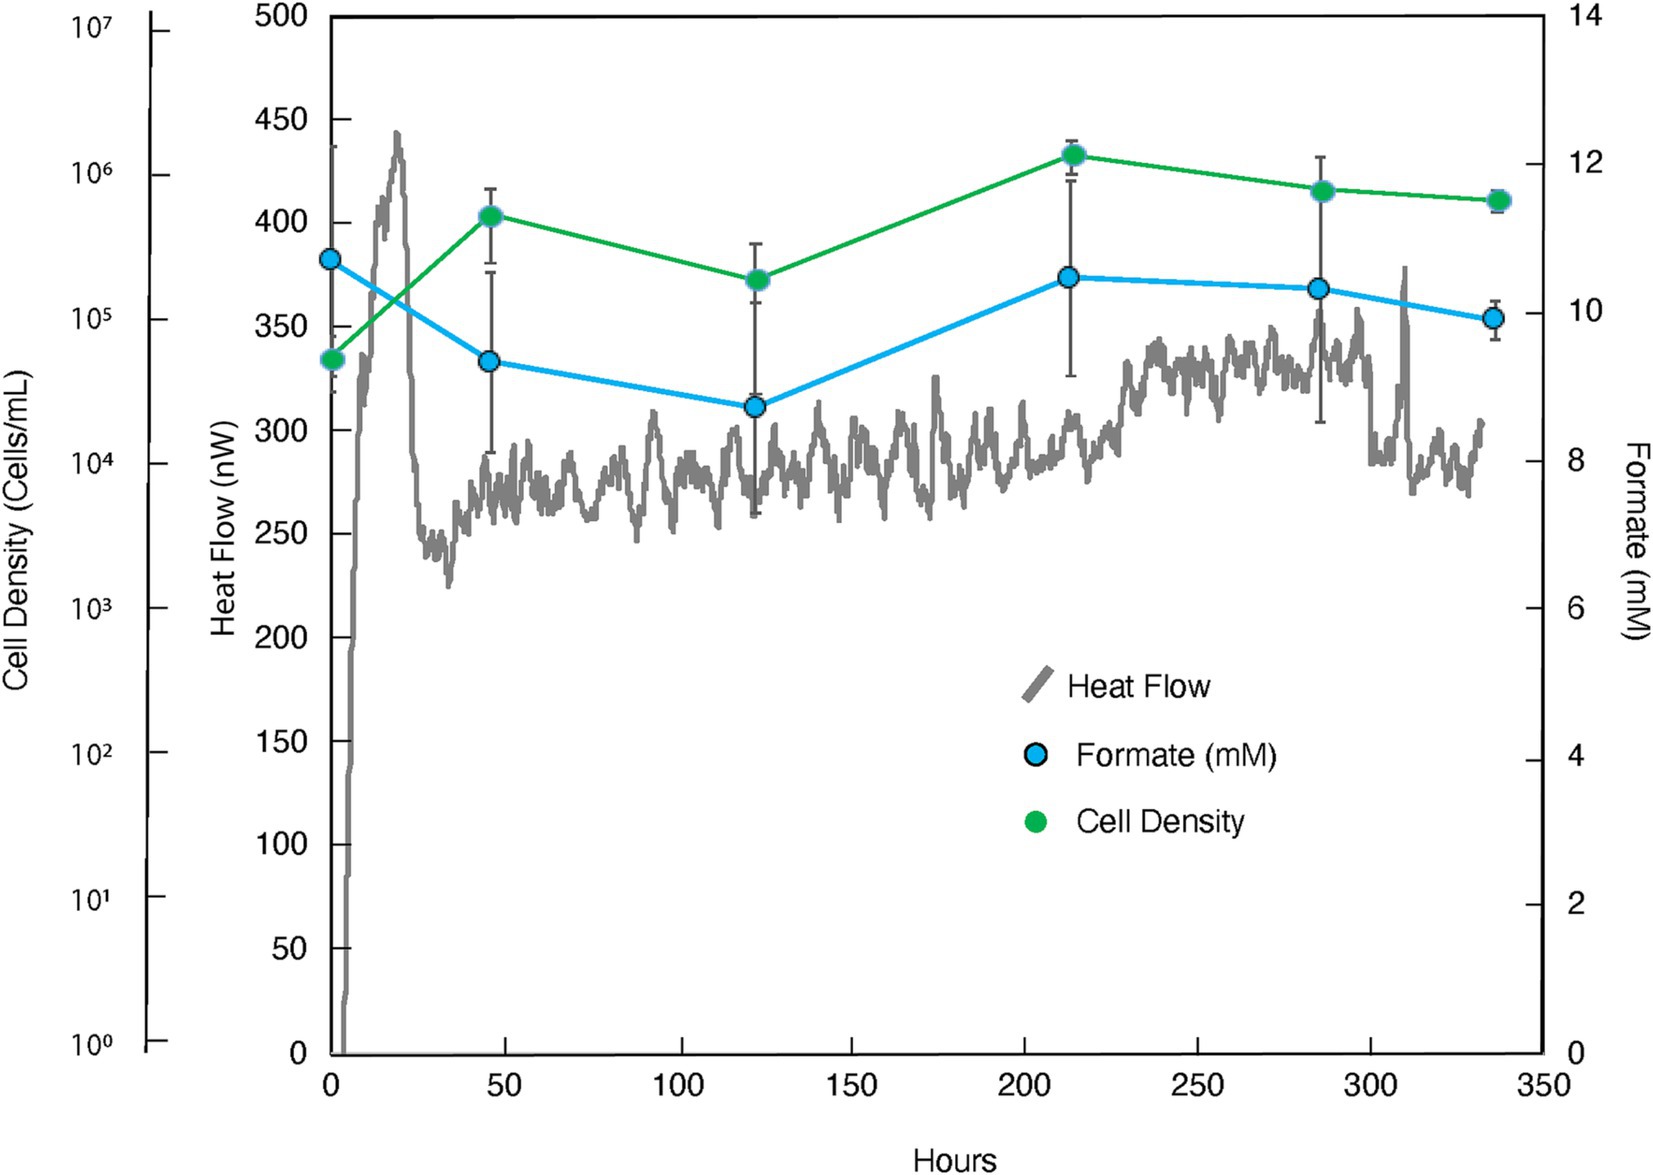
Figure 2. Heat flux (Power), cell density and formate concentration as a function of time for the amendment experiment in which formate (10 mM) was added to borehole fluids from DeMMO 6. The baseline heat flow signal has been corrected using the synchronization method.
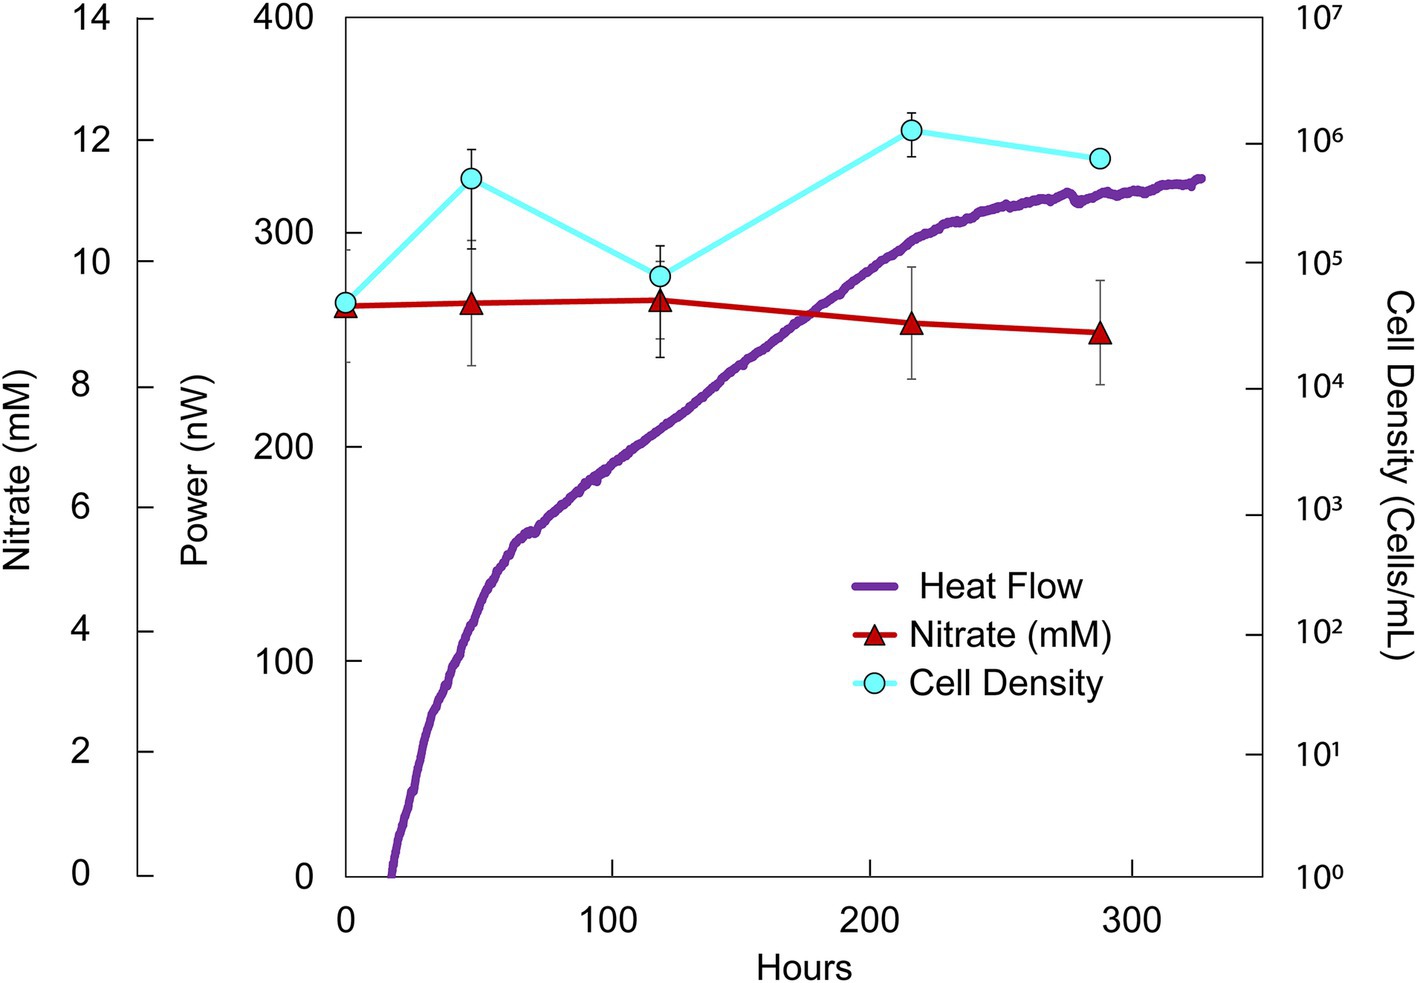
Figure 3. Heat flux (Power), cell density and nitrate concentration over time in DeMMO 6 fluids amended with nitrate (10 mM) and acetate (10 mM). The baseline heat flow signal has been corrected using the synchronization method.
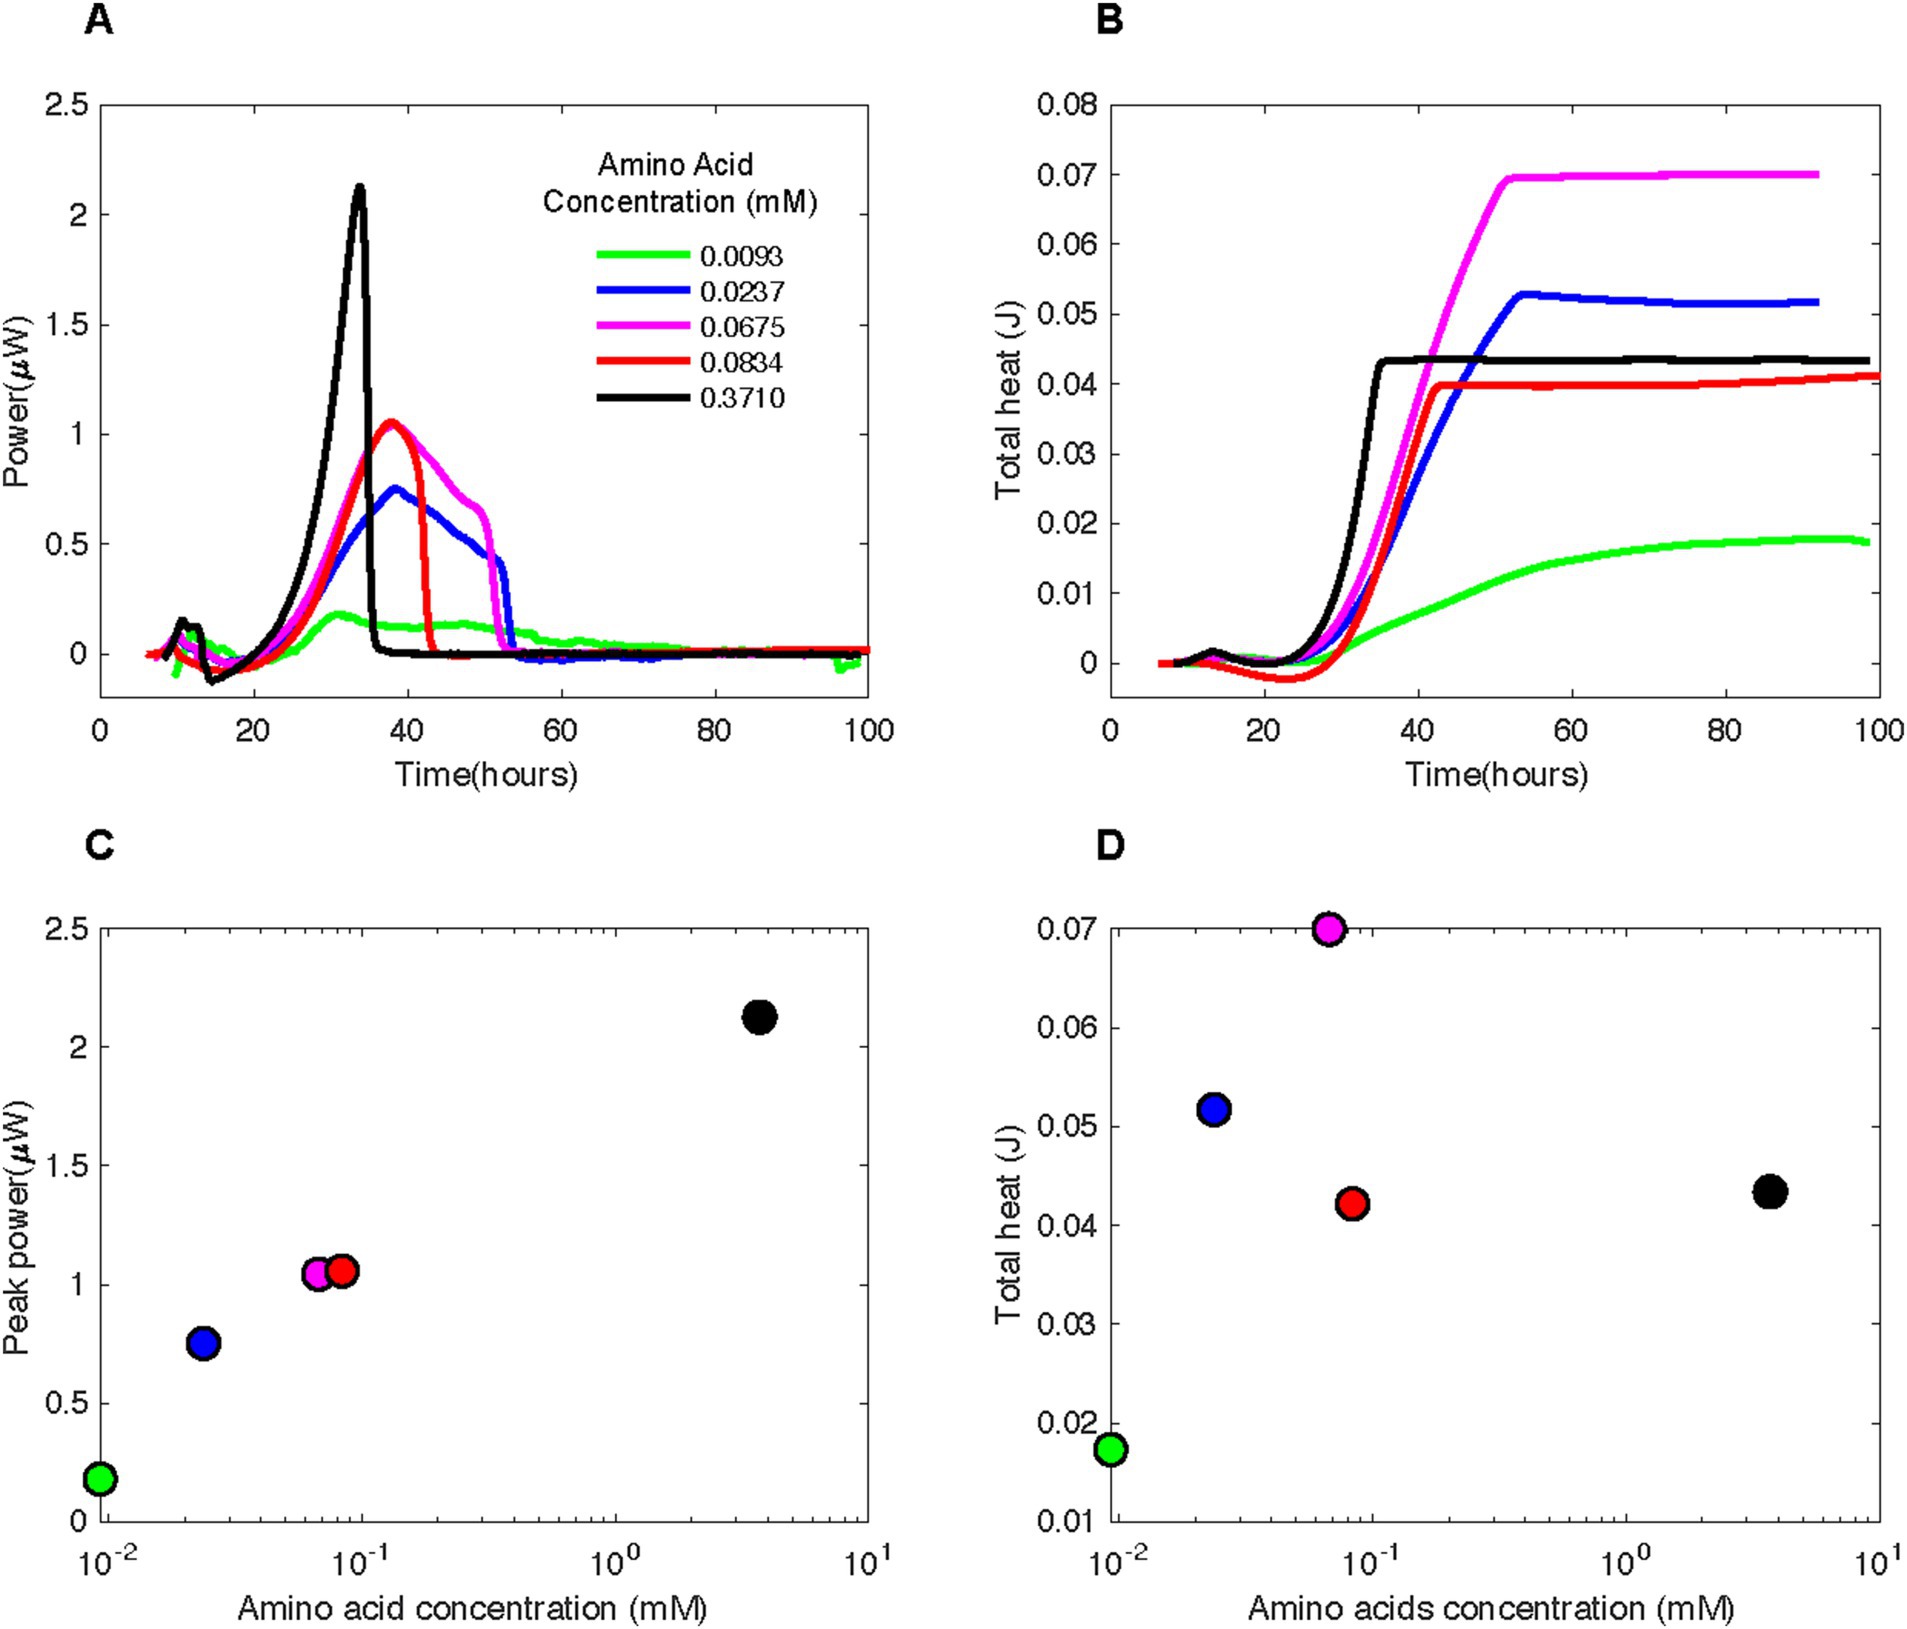
Figure 4. (A) Heat flux (Power) and (B) cumulative heat as a function of time and (C) peak power and (D) total heat as a function of amino acid concentrations associated with experiments in which various concentrations of casamino acids were added to borehole fluids from DeMMO 6. The baseline heat flow signal has been corrected using the power function method.
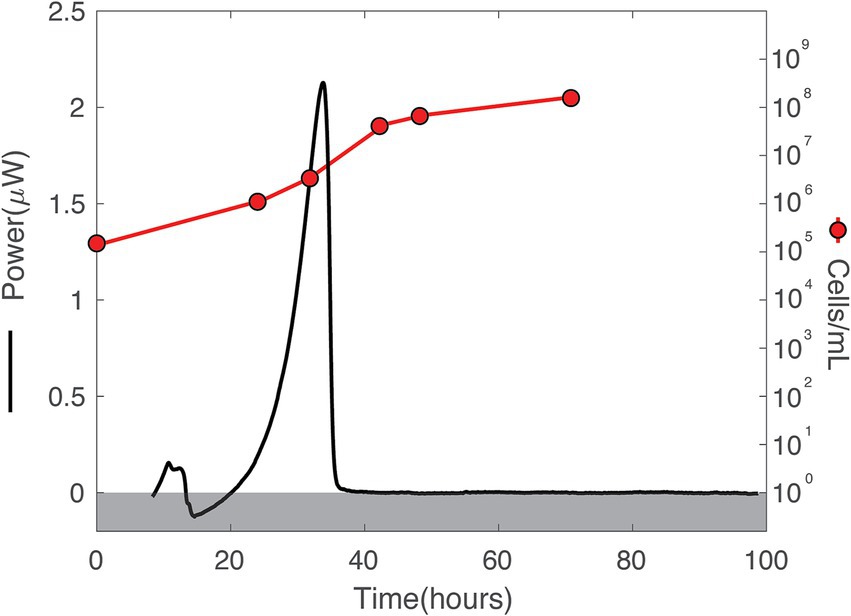
Figure 5. Heat flux (Power) and cell density over time in DeMMO 6 fluids amended with 0.3710 mM amino acids. The baseline heat flow signal has been corrected using the power function method. A gray box covers all data below 0 to facilitate ease of understanding for the cell/mL axis, which only starts above 0.
Amendments to the calorimetric samples were prepared as concentrated, anaerobic, sterile solutions. Borehole water samples and amendment solutions were combined aseptically in an anaerobic chamber, at a final concentration of 10 mM for all additions except the amino acid and ammonium additions. Casamino Acids (Amresco Bacterological Grade) were utilized for the amino acid addition experiments and amended into the borehole fluids as a sterile anerobic solution at varying percentages. These percentages were later converted into molarities using the average molecular weight for casamino acids, 539.583 g/mol, given by the manufacturer. It should be noted that all “amino acid” concentrations reported here are a combination of free amino acids and small peptides that result from the digestion of casein. Therefore, tryptophan is not present in this mixture, and the remaining amino acids are not present in equal abundances. Electron donor (ED) and acceptor (EA) additions were predominantly conducted individually, with the assumption that the amended ED or EA would be coupled with a redox partner from the borehole fluid. Exceptions to this method were made for the co-addition of acetate and nitrate, while three potential EDs were added simultaneously with lactate, citrate, and pyruvate. Following the conclusion of all calorimetric experiments, ampules were closely examined for cracks in the glass and gaps in the seal, to ensure that vial integrity was maintained throughout the experiment.
2.3 DNA and RNA processingWhile in the field, samples for genomic DNA and RNA extraction were collected onto 2–4 sterile replicate housing-encased 0.1 μm Supor filters per borehole. Based on cell enumeration from fluids and fluid rates, a minimum of 106 cells were captured onto each filter, with samples collected in <1 h (Table 2). Most filtration was completed within 40 min, and two filters contained 109 cells. Collected cells were immediately frozen at −80°C and kept at this temperature until extraction.
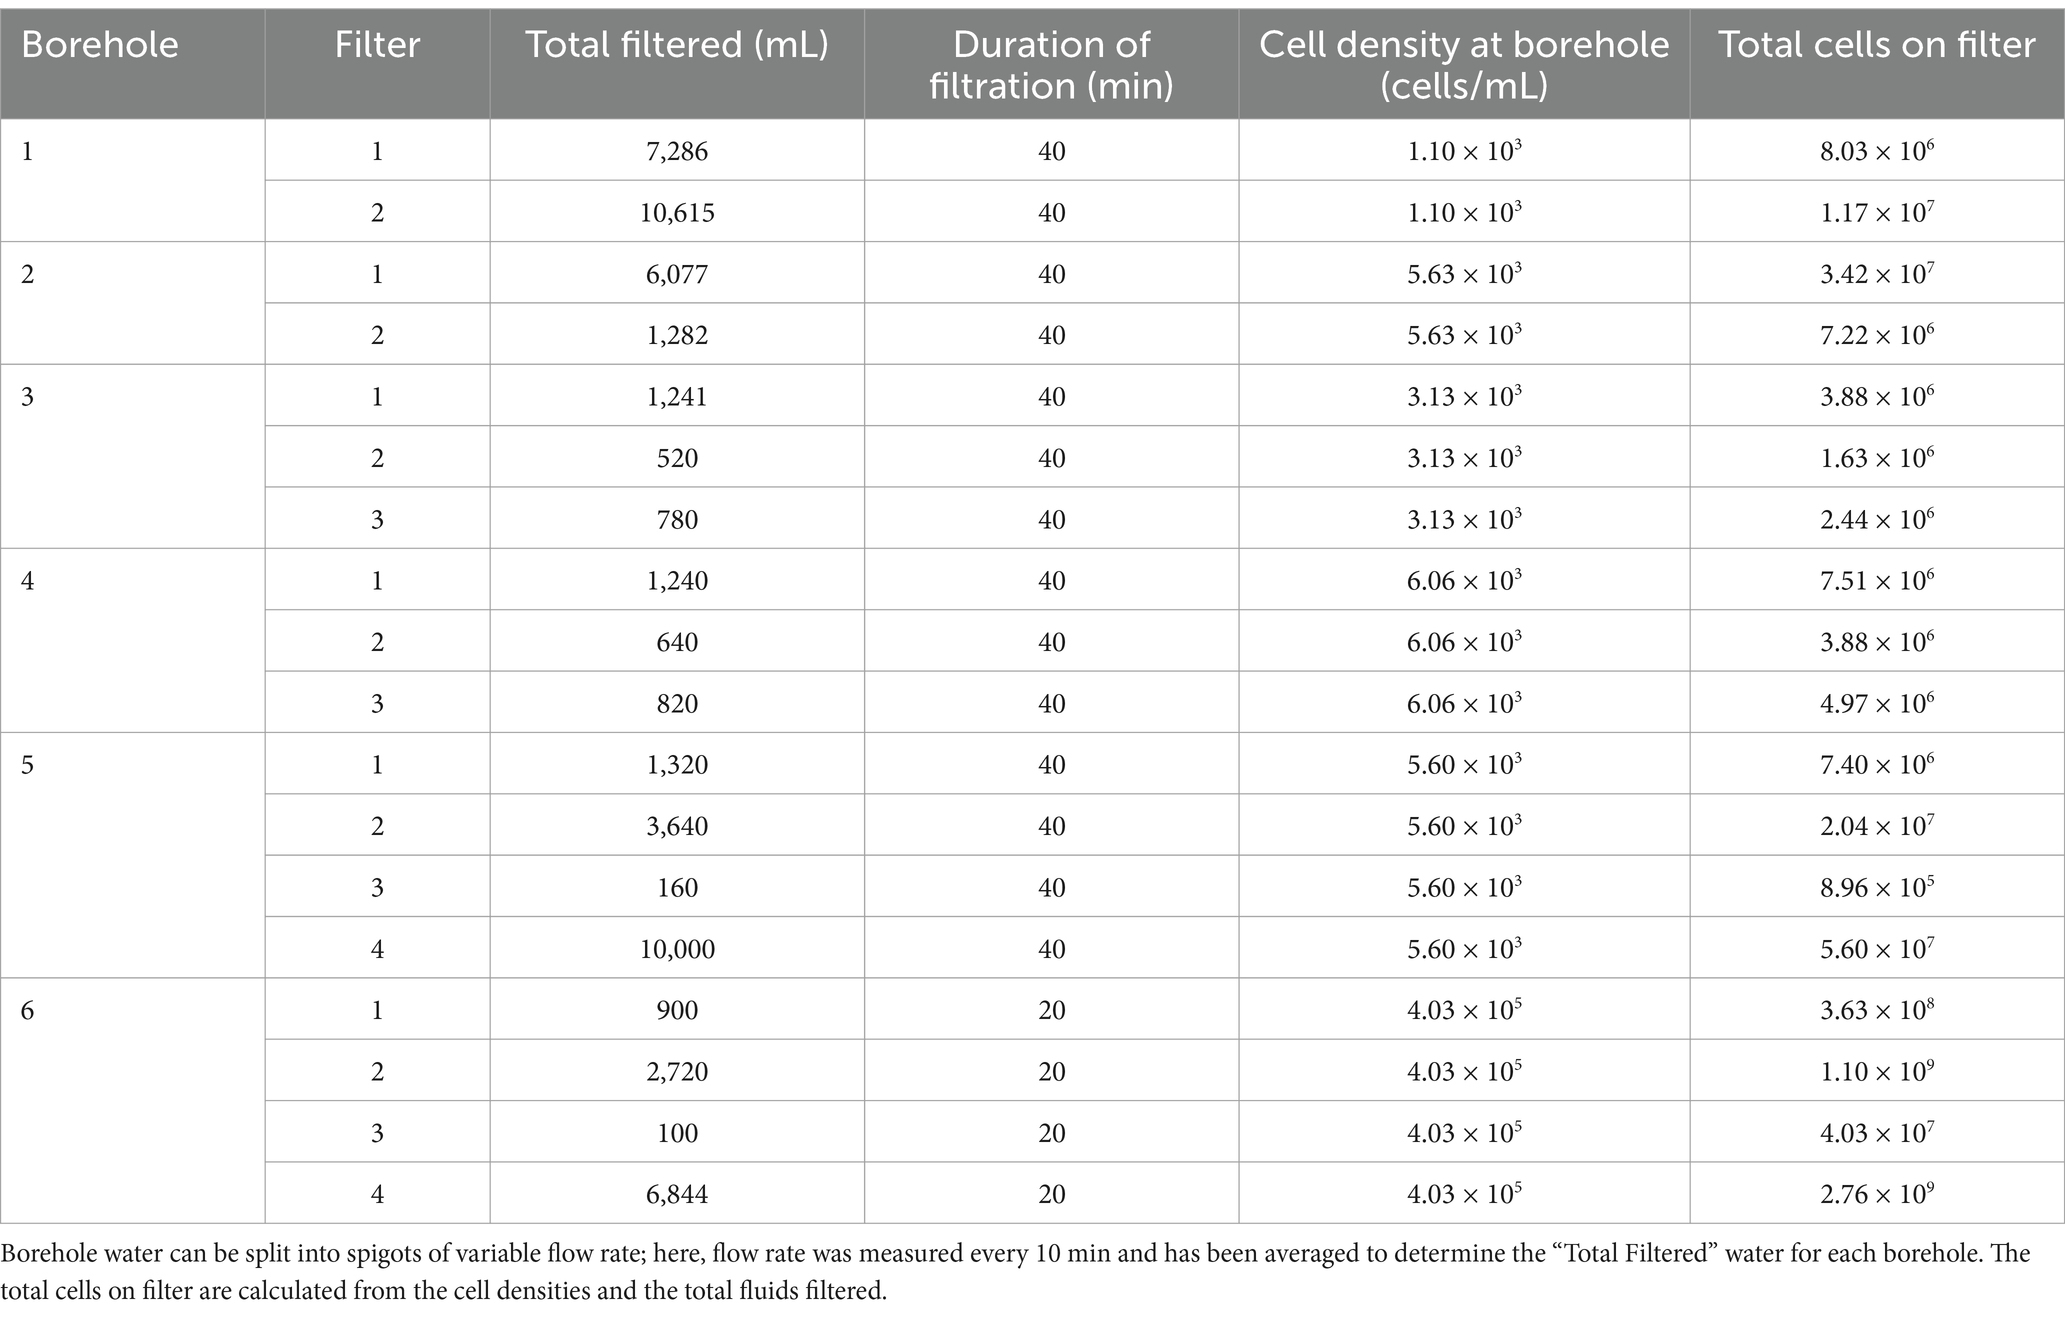
Table 2. Total cells collected on filters from the six DeMMO (Deep Mine Microbial Observatory) boreholes considered in this study.
Initial DNA and RNA extractions from the filters employed a modified version of the protocol in Momper et al. (2017), which was used for genomic DNA extraction from the same sample site. In short, filters were subjected to physical and chemical lysis through a combination of bead beating, freeze/thaw cycles, and sequential exposure to an extraction buffer (Tris and EDTA) and a TESC buffer. Following cell lysis, proteins, humic acids, and other contaminants were removed via 24:1 chloroform:isoalcohol precipitation. The resulting pellet was cleaned using 100% ethanol, prior to being dried and re-suspended in TE buffer. Following DNA and RNA extraction, eluents were divided in half, and in one aliquot, DNA was quantified on a Qubit 2.0 Flurometer (Invitrogen, Carlsbad, CA) using a Qubit dsDNA HS kit. In the other aliquot, RNasein (Promega, Madison, WI, United States) was added to prevent RNA degradation, and TURBO DNase (Invitrogen, Carlsbad, CA, United States) was utilized to remove genomic DNA. RNA was then quantified using a Qubit RNA HS kit. cDNA synthesis was accomplished with SuperScript III First-Strand Synthesis SuperMix (Invitrogen, Carlsbad, CA) using random hexamers, according to manufacturer protocols.
RNA was also extracted using a RNeasy PowerBiofilm Kit (Qiagen, Hilden, Germany), following manufacturer protocols, except that DNase 1 solution was not added to the reactions until after the protocol was completed, allowing for simultaneous DNA and RNA extraction. Once extracted, RNA resulting from this procedure was treated in the same manner as RNA resulting from the procedure noted above.
DNA for 16S rRNA gene community comparisons between the calorimetric experiments was extracted using a DNEasy Power Biofilm Kit (Qiagen, Hilden, Germany), following manufacturer protocols, and quantified with a Qubit dsDNA HS kit. 16S rRNA gene amplification utilized the 515F/926R primer pair (Parada et al., 2016) and GoTaq reaction mix (Promega, Madison, WI, United States), while in a Veriti 96 Well Thermal Cycler for the following steps: 95°C for 3 min, 30 cycles of 95°C for 45 s, 50°C for 45 s, and 72°C for 1 min 30 s. The presence and quality of PCR products was confirmed via gel electrophoresis. PCR products were shipped to Molecular Research DNA (Shallowater, TX, United States) for indexing, purification with Ampure XP beads, normalization and pooling prior to paired end sequencing of the 16S rRNA gene on an Illumina MiSeq platform. The resulting reads were pre-processed in the FASTq Processor (Molecular Research DNA) to remove barcodes, linker primers, and reverse primers. QIIME2, running in R 4.0.1, demultiplexed reads (Bolyen et al., 2019) and the Divisive Amplicon Denoising Algorithm 2 (DADA2) denoised reads (Callahan et al., 2016). This process produced Amplicon Sequence Variants (ASVs), which were compared to the sequences listed in the Ribosomal Database Project’s SILVA v138 Database (Quast et al., 2013; Yilmaz et al., 2014). Relative abundance and diversity plots were made in the phyloseq and ggplot2 packages, running in R (McMurdie and Holmes, 2013; Wickham, 2016).
2.4 Viral and prokaryotic quantificationProkaryotic cells were counted using a Zeiss Axiovision Epifluorescent Microscope. Cells were fixed with paraformaldehyde and stored at −20°C, then stained with acridine orange and collected onto a 0.22 μm black polycarbonate filter (Millipore, Burlington, MA). Viral particles were quantified following Haas et al., 2014. In brief, samples were fixed with paraformaldehyde, filtered onto a 0.02 μm Whatman Anodisc 25 filter, and stained with SYBR Gold. After dye incubation, the excess SYBR Gold was removed and the filter was mounted to a slide using a filtered ascorbic acid/phosphate buffered saline/glycerol mixture. Viral and prokaryotic cells were visualized using a cyan filter and the Image-Pro Plus 7.0 program. 25 micrographs were taken at random and the viral and prokaryotic quantities counted manually.
2.5 Parallel experimentsIncubation experiments identical to those carried out in the calorimeter were carried out in parallel in a darkened incubator to determine how the concentrations of cells, anions, organic acids and gases changed with time (samples cannot be removed from the calorimeter during an experiment without significant loss of data). Cell densities and gas concentrations were determined as described above. Anion concentrations were measured on a Metrohm Ion Chromatograph (Metrohm, Riverview, FL, United States) equipped with an anion separation column. Organic acid measurements were made on an Agilent 1,100 Series HPLC (Santa Clara, CA, United States) utilizing an Agilent Hi-Plex H column.
2.6 Thermodynamic calculationsStandard state enthalpies of reaction, ∆Hr0, were calculated at 28°C and 1 bar using the revised HKF equations of state (Helgeson et al., 1981; Tanger and Helgeson, 1988; Shock et al., 1992), the SUPCRT92 software package (Johnson et al., 1992) and thermodynamic data taken from a number of sources (Amend and Helgeson, 1997; Dick et al., 2006). For the reactions in which the identities of the amino acids were not known, i.e., when Casamino acids were used, a weighted average of ∆Hr0 for the 20 common naturally-occurring amino acids in the proportion that they are found in E. coli (Neidhardt, 2005) were used to estimate the enthalpies of amino acid oxidation reactions. This approximation was made since the enthalpy calculation requires knowing the defined proportion of amino acids in solution, but the relative amount of each amino acid in Casamino acids is not known. However, the amino acid composition of E. coli has been measured. Values of ∆Hr0 for the half reactions describing the full oxidation of carbon, but not other elements were combined with values of ∆Hr0 for half reactions describing the reduction of O2 to H2O, SO42− to HS− and NO3− to N2 to calculate values of ∆Hr0 for the oxidation of a nominal amino acid by these three EAs. The enthalpies of reaction were then used in combination with reaction stoichiometries (mol electron acceptor / mol amino acid) and the total heat produced in the calorimeter (0.0433 J) to determine the number of moles of reactants consumed and CO2 produced. These results are summarized in Table 3.
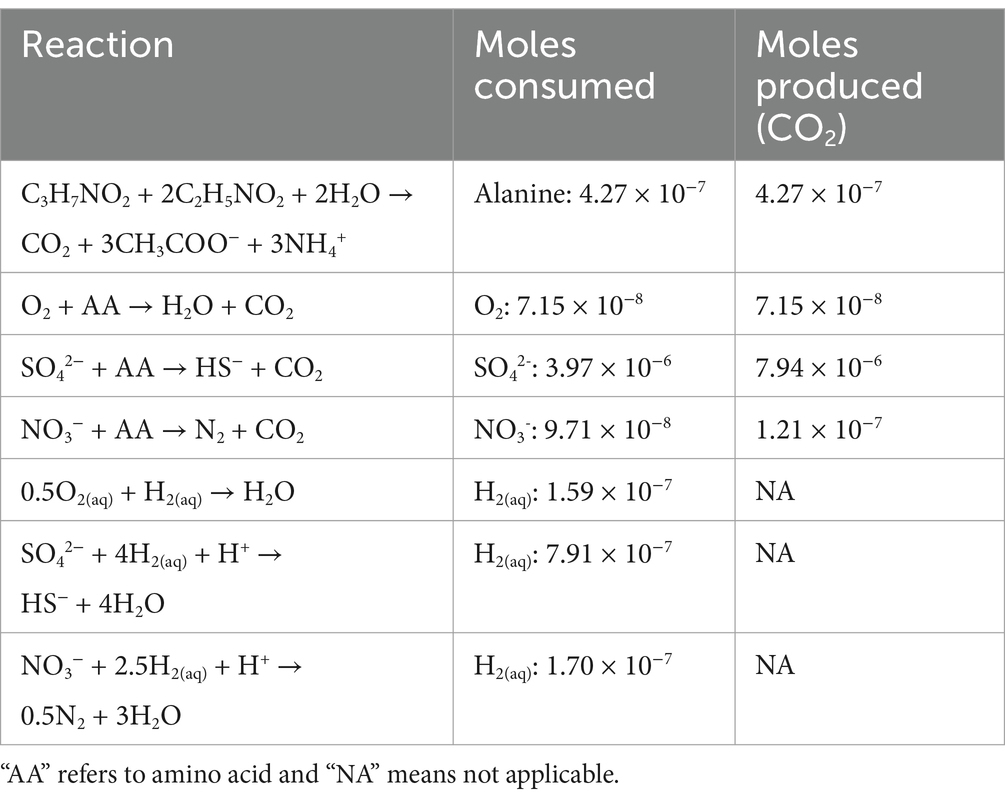
Table 3. Summary of reactions considered to be sources of heat in the calorimetry experiments carried out on SURF borehole fluids and the cumulative number of moles of specified reactants and CO2 in these reactions that would be consumed or produced to generate 0.0433 J of heat, the total amount of heat produced following amendment with 0.371 mM amino acids.
3 Results 3.1 Indications of microbial activity in unamended borehole fluidsHeat signal in unamended DeMMO 1–5 borehole fluids was below detection, at a limit of ~1.2 nW/mL and despite incubation for at least 150 h. None of the possible sources of signal interference that were tested (see Methods section) improved the replicability or detectability of heat flow measurements in these samples. Only DeMMO 6 borehole fluid produced a replicable power signal equilibrating at ~100 nW within 40 h (Figure 1) and was further interrogated, as discussed below.
Virus-to-prokaryote ratio (VPR) measurements summarized in Figure 6 correlate with the low heat signals measured on the calorimeter. It can be seen in this figure that VPR linearly scaled with cell density, but not with depth within the mine. The 6 DeMMO boreholes access 4 depths at SURF, with DeMMO 6 accessing a borehole containing ~2 orders of magnitude more cells per milliliter than the other DeMMO boreholes (Table 2). The average VPR across the samples was 2.03, with a high at DeMMO 5 (2.66) and low at DeMMO 6 (1.67). DeMMO 5 and 6 are at the same depth in the mine although access very different fluids (Osburn et al., 2019) while boreholes from 244 m deep had similar VPRs (2.25 and 2.06).
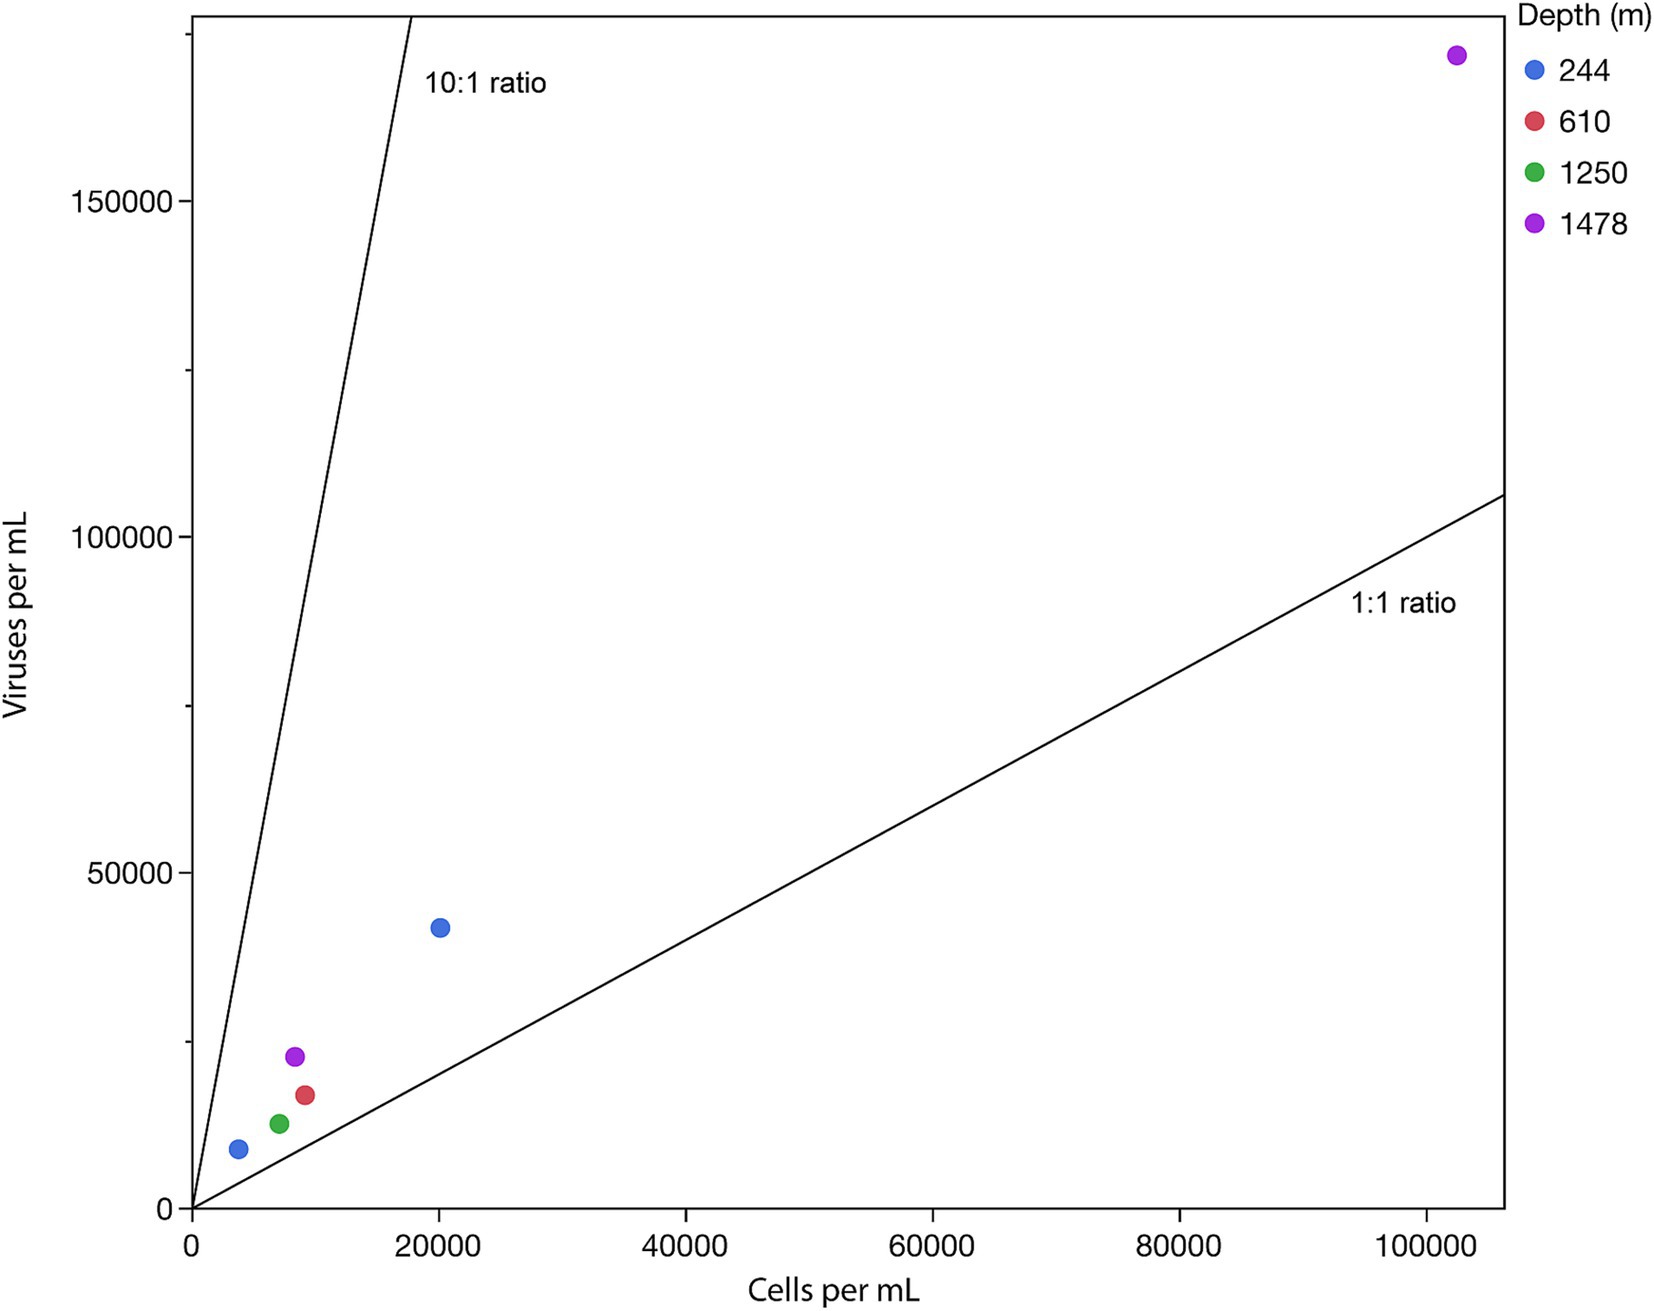
Figure 6. Virus-to-prokaryote ratio (VPR) in samples taken from DeMMO boreholes from the indicated depths below the local surface. The black diagonal lines provide a visual guide to specific VPR values with a base of 10.
mRNA, another proxy for active microbial functions, was extracted from all DeMMO boreholes, but was not detected at a sufficient level for functional interpretation. This result was noted despite the extraction of ample DNA from the same samples and consistently high mRNA recoveries in the positive controls (see Methods section).
3.2 DeMMO 6 amendments 3.2.1 Electron acceptors and donorsDeMMO 6 borehole fluid samples were amended with EAs and/or EDs/carbon sources to investigate the genomic potential and energetic potential of microorganisms previously described in DeMMO (Momper et al., 2017; Osburn et al., 2014) but exhibited low increases in heat flow relative to unamended samples (Figure 1). By ~50 h, all samples reached a heat flow signal that was maintained consistently for upwards of 300 h (only data through 100 h shown in Figure 1). Of the amendment experiments, formate (dark blue curve in Figure 1) and an acetate/nitrate mixture (orange curve) increased the heat flow above that for unamended borehole waters (light blue and yellow curves) by ~500 nW and ~ 125 nW, respectively. Fluid sample amended with only acetate (green curve) and fluid sample amended with a mixture of citrate, lactate, and pyruvate (black curve) produced no significant change with respect to unamended fluid samples (Figure 6). In borehole waters amended with a combination of citrate, lactate, and pyruvate, heat signal peaked at ~175 nW around 45 h. Cells density increased from 1.16 × 10⁴ cells/mL to 4.84 × 10⁵ cells/mL over a period of 240 h, although the community composition remained very consistent throughout the duration of the experiment (Figure 7; Supplementary Figure 2). At the beginning of the experiment (t0), no single genus accounted for >25% of the community, with the most abundant genera identified as Afipia, Devosia, Hydrogenophaga and Limnobacter. These same genera remained in high abundance at the end of the experiment, both within the calorimetric vials and within the parallel experiments.
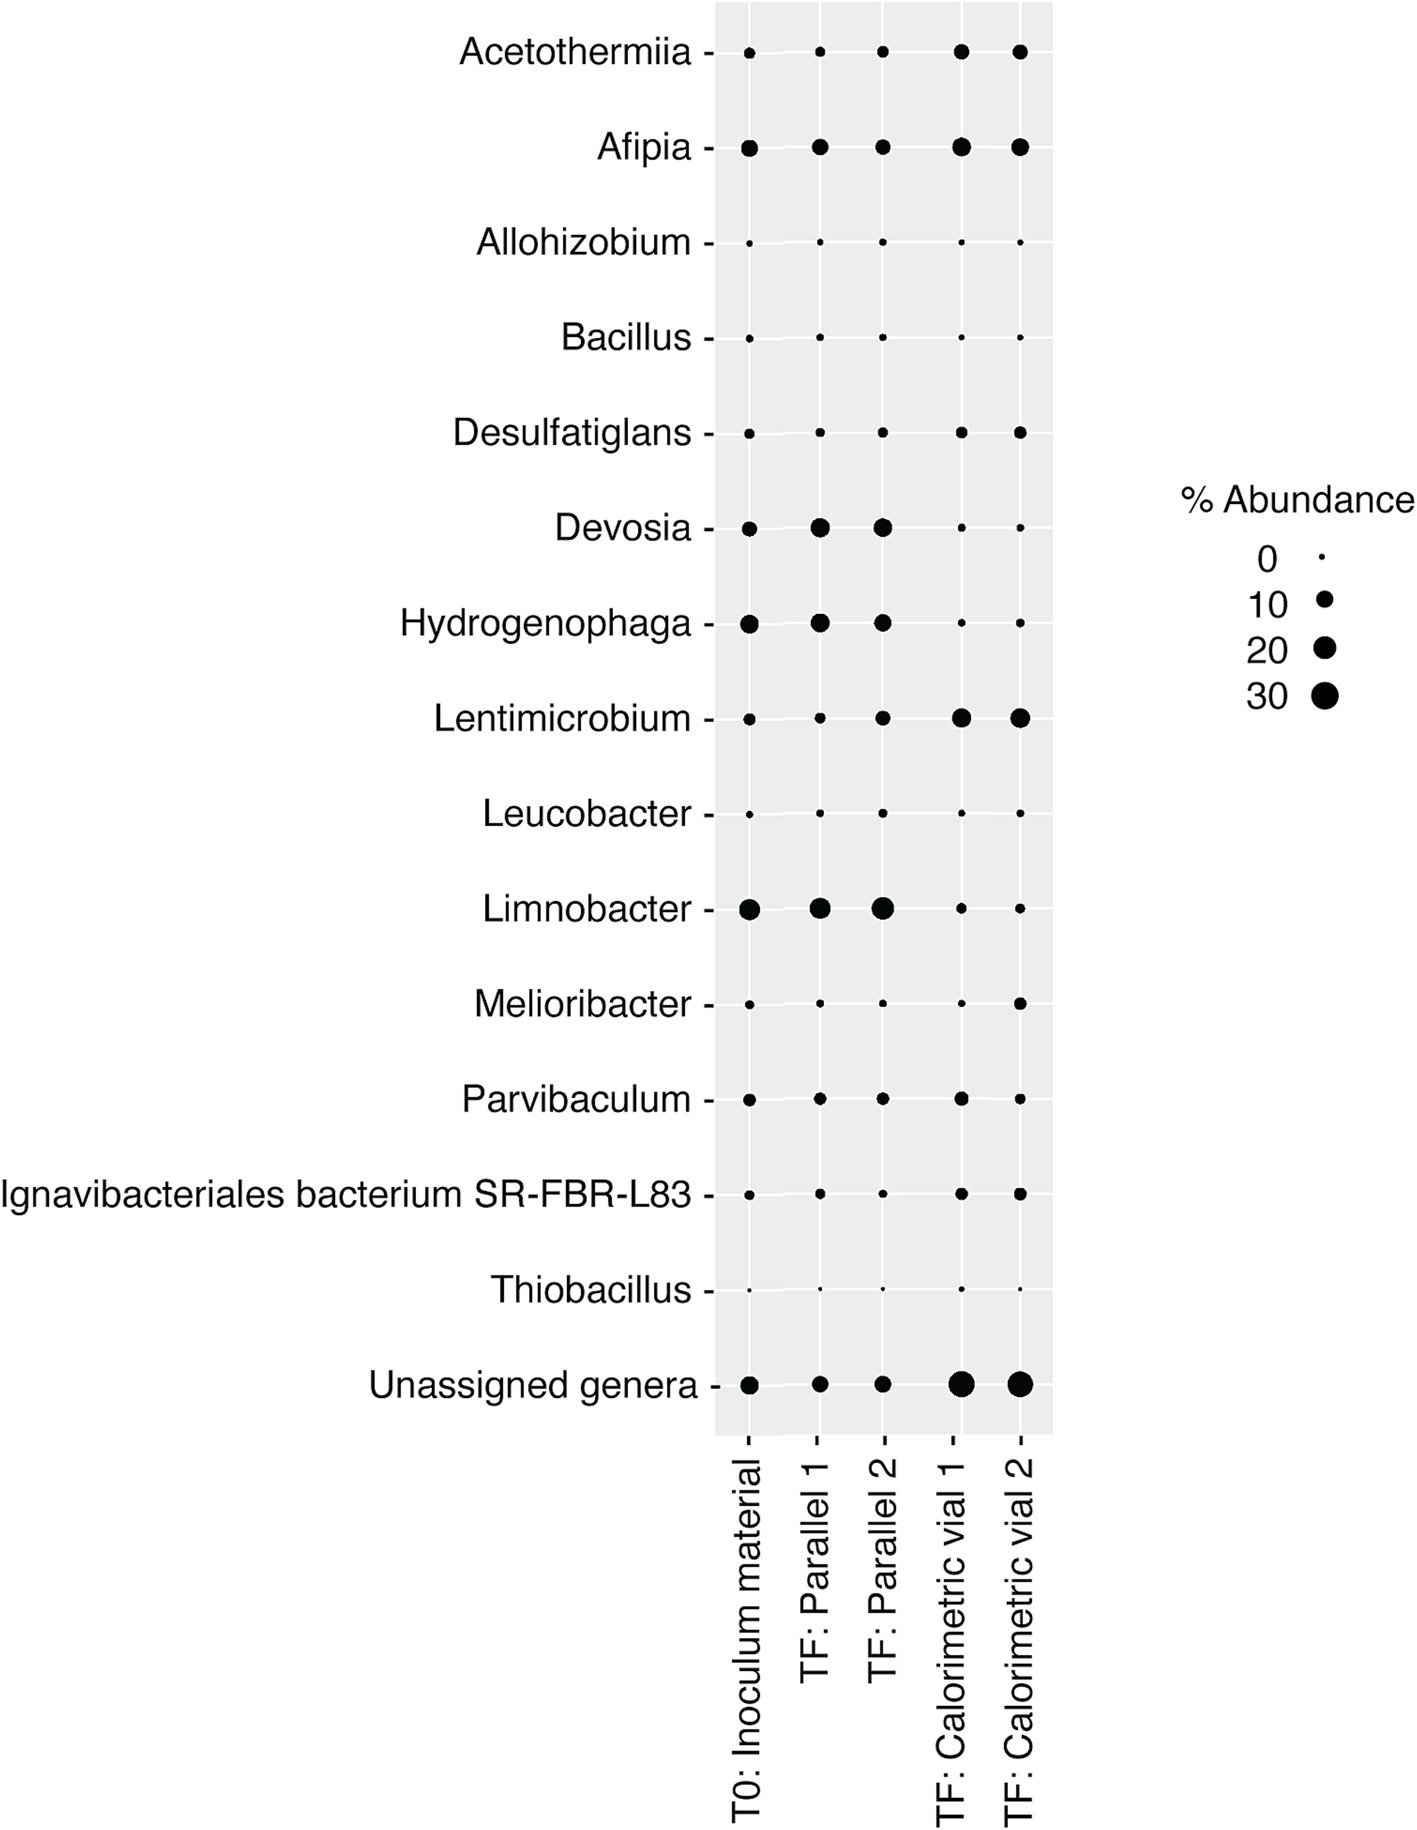
Figure 7. Relative abundance of microbial genera in DeMMO 6 borehole fluids before (t0) and after (tF) incubations with lactate, citrate, and pyruvate amendments. “Parallel 1” and “Parallel 2” refer to duplicate incubation experiments run outside of the calorimeter and “calorimetric vial 1” and “calorimetric vial 2” correspond to replicate incubations experiments run inside the calorimeter. “Unassigned genera” indicates taxa for which taxonomy could not be assigned at the genus level.
The addition of formate as potential ED and carbon source resulted in a more robust and oscillating heat signal, peaking at ~450 nW at ~20 h before sharply dropping to ~225 nW and tapering off at ~100 nW above this value for the duration of the experiment (336 h; Figure 2; replication in Supplementary Figure 3). Concurrently, cell densities per milliliter increased from 3.99 × 10⁴ to 4.18 × 10⁵ in the first 46 h and remained relatively constant throughout the duration of the experiment. A notable size increase in cell radius, as visualized microscopically, was also noted during this time (data not shown). It can be further seen that, within measurement uncertainty, apparent formate concentrations did not change.
The microbial community in the formate addition cultures remained markedly consistent, with almost no variation in structure between any replicates or time points (Figure 8). In both t0 replicates, the dominant community member was Leucobacter (~25% relative abundance), with all other community members present in less than 10% abundance. The community structure after 46 h, t1, looks very similar to the community at t0, with a slight increase in the abundance of Parvibaculum and a slight decrease in the abundance of Ignavibacteriales bacterium SR-FBR-L83. These trends stayed consistent after 336 h, tF, across all replicates within and outside of the calorimeter. Leucobacter continued to dominate the community at ~25% abundance, but a larger percentage of the community was composed of Parvibaculum (~10%).
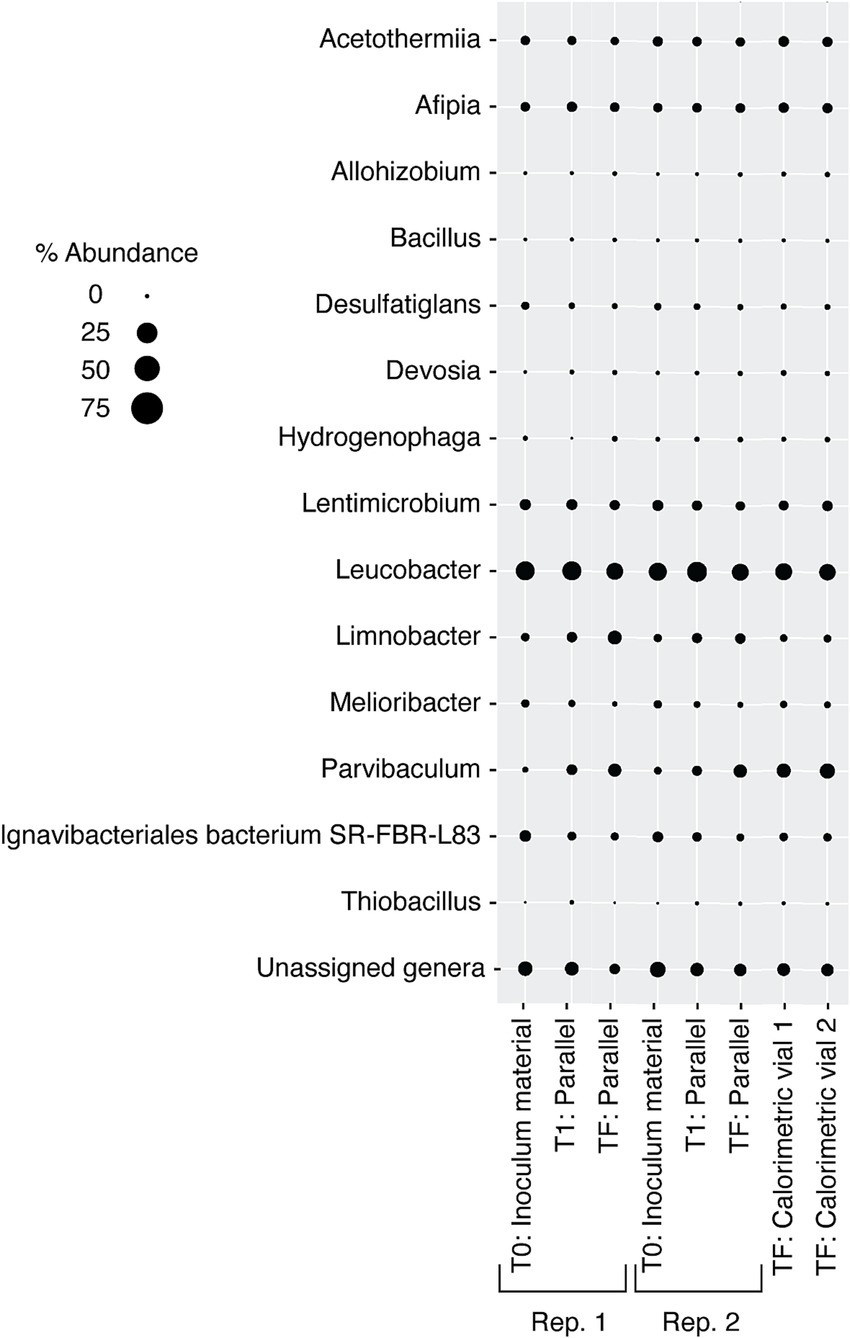
Figure 8. Relative abundance of microbial genera in DeMMO 6 fluids before (t0) and after (tF) and 46 h into (t1) incubation with formate. “Parallel” refers to duplicate incubation experiments run outside the calorimeter, and these parallel experiments were replicated (Rep. 1 and Rep. 2). Replicate experiments run inside the calorimeter are noted as “Calorimetric vial 1” and “Calorimetric vial 2”. “Unassigned genera” indicates taxa for which taxonomy could not be assigned at the genus level.
While formate additions resulted in an increase in cell density and a change in heat flow, acetate had a negligible effect on the community, even when combined with nitrate. Simultaneous addition of acetate and nitrate to borehole waters resulted in ~175 nW stronger heat signal than unamended groundwater within 100 h (Figure 3). Over the course of the experiment, nitrate and acetate concentrations remained unchanged at ~10 mM each, while cell densities increased variably from 4.74 × 10⁴ cells/mL to a maximal density of 1.20 × 10⁶ cells/ml at 216 h (Supplementary Figure 4; Figure 3). In all inorganic EA and organic ED amendment experiments, heat signals were < 500 nW, with the majority closer to ~100 nW at 100 h.
3.2.2 Amino acidsAll amino acid-amended borehole fluids produced a substantial and highly replicable heat flow signal whose maximal magnitude correlated with amino acid concentration. Amendments with 0.3710 mM casamino acids resulted in a maximal heat flow of ~2.25 μW at ~32.5 h (Figure 4C). Heat flow for the next highest concentration of amino acids, 0.0834 mM (red curve), peaked at ~1.1 μW, approximately 5 h after the 0.3710 mM amendment. The heat flow signal for 0.0675 mM (purple curve) reaches the same peak as that for 0.0834 mM amino acids, but tapers for twice as long. The maximal heat signal for the 0.0237 mM amendment (blue curve) is less than those for 0.0675 mM and 0.0834 mM, but the tapering ends at a similar time as it does for the 0.0675 mM experiment. Amendment with 0.0093 mM amino acids results in a much lower heat flow than those experiments with higher amino concentrations, maximally at ~0.2 μW heat flow.
In many of the amino-amended heat flow signals, a small peak occurs around 10 h, followed by a much larger peak around 30–40 h (Figure 4A). The sharpness of the large peak was directly correlated to amino acid concentration, with higher concentrations resulting in steeper peaks. From the maximal heat flow at the peak, all signals dropped off between ~35 and ~ 55 h, except in the case of 0.0093 mM amino acid amended fluids.
The total heat produced during an amino acid addition experiment was influenced by the length of time that the heat flow signal tapered after the steep drop-off following the peak (Figure 4B). For instance, the largest total heat signal, 0.07 J, was present for 0.0675 mM (Figure 4D) which had the same peak width as the 0.0237 mM experiment (Figure 4A). However, the sample with 0.0675 mM casamino acids had a larger maximal heat prior to the tapering period (~1.1 vs. ~0.75 μW). Little heat production occurred after 45 h in most amended samples.
Over the duration of the amino acid amended experiments, the community was dominated by two major taxa that are endemic to the SURF community: Hydrogenophaga and Limnobacter (Figure 9). In addition to these two taxa, Allorhizobium became a major part of the community in the experiments taking place inside the calorimeter. The addition of amino acids slowly changed the community over time, with Limnobacter dropping off in abundance from as much as ~75% to as little as ~5%. Hydrogenophaga was present at some abundance in all the collected DeMMO 6 groundwater, although it particularly thrived when exposed to more complex organic carbon sources, becoming as much as 75% of the community during amino acid addition. Figure 5 depicts the growth curves corresponding to these data, indicating a cell density increase in the community from 1.16 × 10⁵ cells/mL to 1.41 × 10⁸ cells/mL within 70 h. During this time, sulfate concentrations did not change within the margin of error, while nitrate and oxygen concentrations remained below the detection limit (Supplementary Figure 5). On average, carbon dioxide rose from 1.40 × 10⁻⁸ mol/mL to 2.66 × 10⁻⁷ mol/mL while hydrogen dropped from 1.03 × 10⁻⁶ mol/mL to 2.58 × 10⁻⁷ mol/mL.
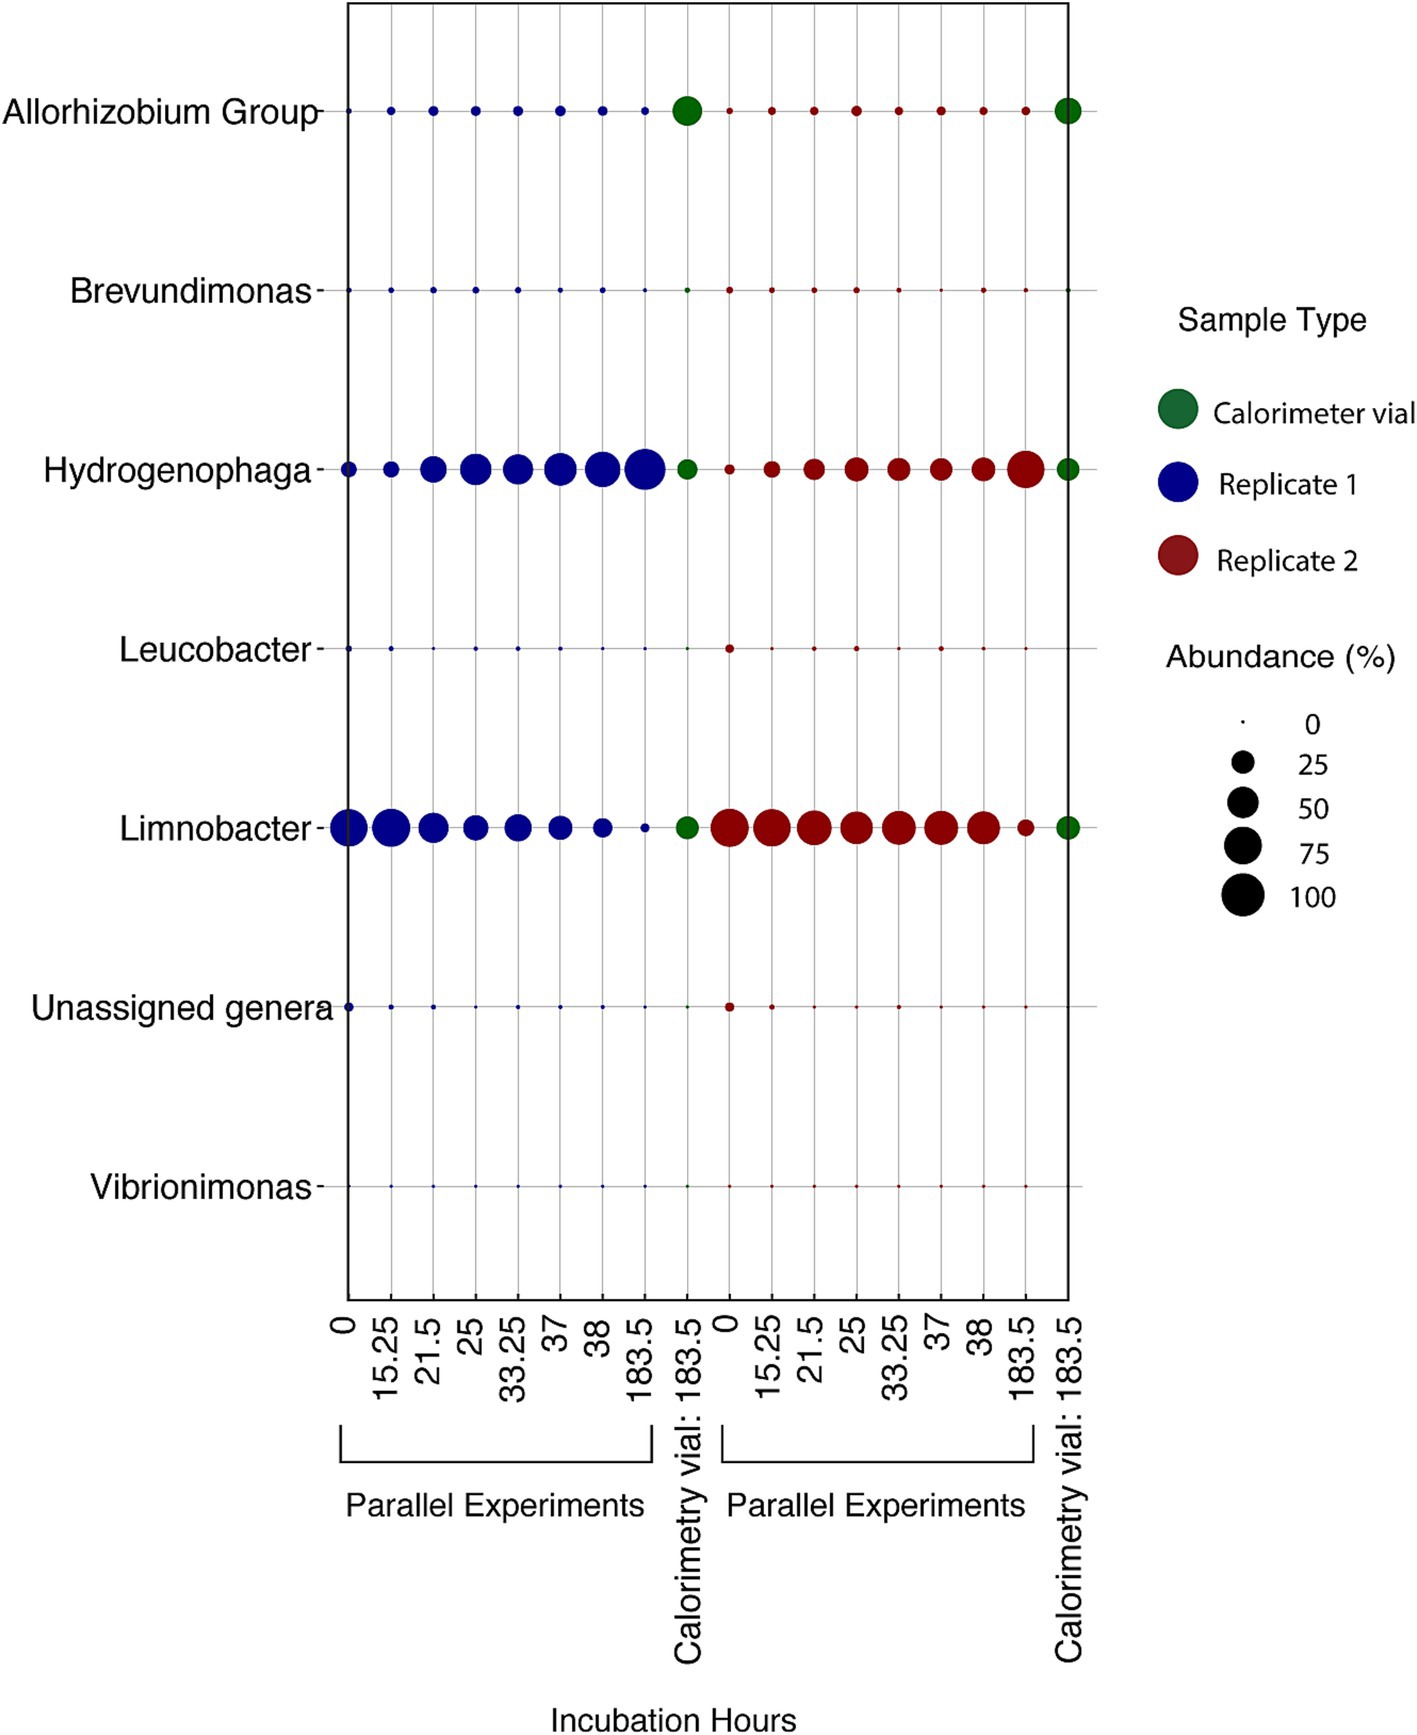
Figure 9. Relative abundance of microbial genera in DeMMO 6 fluids amended with 0.371 mM amino acids over various times throughout 183.5 h in two experiments incubated outside of the calorimeter (“parallel experiments”) and two replicates incubated inside of the calorimeter (“calorimetry vial”). Calorimetry vial samples were collected at 183.5 h. “Unassigned genera” indicates taxa for which taxonomy could not be assigned at the genus level.
To test whether the amino acid addition signal results from microbes splitting the ammonia group off the amino acids, amino acids were amended into DeMMO 6 fluids at 0.371 μM and 9.3 μM concentrations. Additionally, 1 M ammonium was added to samples at each of these amino acid concentrations. Only minimal differences were noted between samples amended with amino acids vs. samples amended with amino acids and ammonium (Supplementary Figure 6).
4 Discussion 4.1 In-situ activities are low throughout SURFThe investigation into microbial metabolic activity within the SURF borehole fluids from DeMMO 6 reveals a distinct response to nutrient amendments, as evidenced by measured variations in heat flow. Specifically, introducing small concentrations of amino acids (0.3710 mM) stimulated a metabolic reaction that led to the generation of approximately 2.2 μW within a span of 25 h. This indicates a pronounced microbial response to the added substrates, translating into an observable thermodynamic effect. Similarly, the addition of formate and a nitrate/acetate mixture induced significant variations in heat flow, underscoring a substantial metabolic shift compared to the baseline established by unamended borehole fluids. Contrarily, the addition of other substrates such as citrate, lactate, pyruvate, and acetate (in the absence of nitrate) did not manifest in a marked increase in heat flow, suggesting a selective metabolic responsiveness to nutrient types. Despite this apparent lack of response, the results pertaining to these substrates are consistent and exceed the calorimeter’s threshold of detection, validating their reliability. Additionally of interest, aging of samples in the laboratory did not result in differences in the maximum heat flow a sample could obtain, but did change the amount of time required for a sample to obtain this heat flow signal. This is evident when comparing the nitrate and acetate co-amendment data in Figures 1, 3, which represent data collected, respectively, within weeks of the sample being collected, and after 3 months. In contrast, unamended fluids from the remaining five DeMMO boreholes failed to yield replicable outcomes, likely attributable to diminished cell densities and inherently low microbial activity within those environments. DeMMO 6 may have increased cell densities and activities relative to the other 5 boreholes resulting from being capped with a steel manifold which inhibits flow. This differential response underscores the complexity of microbial communities’ metabolic dynamics and highlights the potential of specific substrates to activate or enhance microbial processes within subsurface ecosystems.
The SURF VPR is another indicator of low microbial activity at this site. Active microbial communities tend to be characterized by a standard ratio of viruses to prokaryotes of about 10:1 (Thingstad, 2000). This ratio is based on the notion that viruses cannot replicate unless their hosts are sufficiently active to utilize their replication machinery. Based on previous studies examining VPR across a variety of environments, the average VPR from SURF, 2.03, is very low. For instance, the average VPR in deep sea environments is 28.45 and for estuaries, it is 11.35 (Parikka et al., 2017). The lowest reported average values across an environment are from waterflow or rivers, at 9.38, although the lowest VPR yet reported (0.0001) was found in deep marine sediments (Yanagawa et al., 2014). These low VPR values may indicate a cost to phage activity, wherein low metabolic rates become necessary for survival in-situ (Thingstad et al., 2014). Regardless of the cause of low metabolic rates at SURF, the VPR present across the SURF boreholes is indicative of a dormant or near-dormant metabolic state in the site fluids. It is likely that cell densities and activities are higher in fissures in the source rock, where mineral-associated biofilms provide more hospitable conditions for microbial life (Casar et al., 2021a). However, in the fluids, the case for an inactive microbial community is also supported by the lack of extractable mRNA across all DeMMO boreholes. This trend is of particular interest given that most microbial modeling assumes that microbes are either dead or alive and active, when in fact a state of maintenance may be more applicable in energy-limited systems (Bradley et al., 2018). This study supports the notion of a population that is engaged in very low-energy maintenance activities and provides a variety of potential methods for assessing metabolic rate during dormancy.
The low heat flow rates noted in DeMMO borehole fluids are conspicuously less than those reported for bacteria grown in media but are consistent with environmental values estimated through modeling. Using a reaction transport model and Gibbs energy calculations, it can be determined that, extremely energy-limited cells can exist on 1.5×10⁻⁸ pW (Bradley et al., 2020). While the enthalpy-based measurements of power employed in this study do not indicate such low activity, heat flow also does not reach the levels described in more active communities. For context, a pure culture of Shewanella oneidensis MR-1 grown under oxygen limitation maximally produces a heat flow of ~24 μW (Robador et al., 2018), a value that is 48 times greater than the maximal heat flow resulting from the SURF borehole water even after amendment with high concentrations of organic acids and EAs. For DeMMO 6, unamended samples produced 100 nW for 5.2 × 10⁵ total cells, indicating that a single cell under those conditions uses around 0.19 pW. This value is in a similar range to that for a single cell in soil (1 pW to 10−5 pW), and in the basaltic crust (5.68 pW), and is well above the estimated range for a single cell in marine sediments (10−4 pW to 10−8 pW; Robador et al., 2016; Bay et al., 2021; Bradley et al., 2022; Zhao et al., 2021), which are based on Gibbs energies, not enthalpies, of reaction. The most straightforward explanation for why consistent heat signals could not be obtained for the other boreholes is that the cell density at those boreholes was too low to generate a replicable signal. The DeMMO 1–5 borehole fluids contain about to a 103 cells/mL. Assuming the 0.192 pW of power from DeMMO 6 holds true for the other boreholes, the heat flow for DeMMO 1, at 1.607 × 10³ cells/mL would be 0.31 nW. This value is below the detection limit of the calorimeter.
4.2 Energetically favorable or genomically encoded does not mean activeThis study tested some of the predictions made by previous papers predicting potential metabolisms at this site (Osburn et al., 2014; Momper et al., 2017; Momper et al., 2023). Nitrate reduction pathways are present at DeMMO 6 and the use of this EA is energetically favorable given the conditions present at this borehole. Although the addition of nitrate to DeMMO 6 borehole fluids did result in a larger heat flow signal than was present in unamended fluids and promoted cell replication, it failed to produce the large microbially-produced heat signal seen with amino acid addition. Sulfate reduction pathways are also both energetically favorable and commonly encoded at DeMMO 6, but sulfate is abundant at high concentrations (~45 mM) on site, and the supplementation of an additional 10 mM sulfate in calorimetric experiments did not impact heat flow in this study (Supplementary Figure 7).
It has been proposed that organic acids are being produced in the deep subsurface biosphere by fermentative bacteria, and that these organic acids are in turn utilized by organotrophs (Teske, 2005). Acetate has also been shown to stimulate growth in deep subsurface fluid communities from Finland (Miettinen et al., 2018), and genomic studies of other deep subsurface sites have reported abundant genes for heterotrophic processes (Nyyssönen et al., 2014; Nuppunen-Puputti et al., 2022). In the SURF system, acetate, as a proxy for organic matter, was demonstrated to be the most exergonic ED (Osburn et al., 2019). Additionally, genes for acetate and formate oxidation are abundant across the six DeMMO boreholes (Momper et al., 2023). In this study, acetate amendment had a greater impact when co-amended with nitrate, potentially indicating microbial denitrification on site is controlled by the availability of organic acids like acetate. Formate amendment resulted in greater overall heat flows than acetate amendment, although uniquely, this organic acid resulted in an oscillating heat flow indicating potential metabolic shifts. The increase in cell density but lack of concurrent change in community structure noted during this amendment could indicate that all community members are equally sensitive to formate, but another possibility is that the microbes in this community are not doubling so much as becoming more metabolically active and therefore easier to detect. A limit to this study is that all conditions were uniformly tested at a 10 mM concentration, which was selected after lower concentrations of acetate (~1 mM) failed to produce a measurable signal (data not shown). However, 10 mM concentrations of may have introduced inhibitory effects or altered microbial activity patterns. From the previous studies of the genomic potential at SURF, it is difficult to determine which of the many genes for the use of small organic molecules present at DeMMO 6 are actively being transcribed given the environmental conditions the community is experiencing (Momper et al., 2023). The data in this study indicate that organic acids appear to have a lesser impact on catabolic processes than amino acids.
4.3 Deep continental subsurface life is uniquely poised for amino acid metabolismThe amendment of even very low concentrations of casamino acids (0.0093 mM) resulted in an increase in heat flow, total heat, and cell density above that in unamended fluids. A higher amino acid concentration did not necessarily equate to greater total heat. Rather, samples with less amino acids produced a lower but more prolonged peak that produced more total heat. Among the microbial taxa changing most strongly in response to the amendment of amino acids were Hydrogenophaga and Limnobacter, which were present in-situ at the time of sampling and therefore unlikely to be contaminants. In fact, Hydrogenophaga was the dominant microbe in the original rock core removed to prepare the DeMMO 6 borehole (Momper et al., 2017), is commonly observed throughout gold mine and continental subsurface environments (Santini et al., 2002; Baker et al., 2003; Nuppunen-Puputti et al., 2022) and has been grown under anaerobic conditions (Duffn
留言 (0)