
記住我


Based on the scRNA-seq and IMC data, we comprehensively dissected and compared the TME of lymphoid tissues from NC, ND-AITL, and RR-AITL patients (Fig. 1A). The detailed clinical characteristics of these individuals were summarized in Supplementary Table 1. After quality control (see Methods), we got transcriptomic data for a total of 55,482 single cells, including 24,581 cells from NC, 17,610 cells from ND-AITL, and 13,291 cells from RR-AITL. Additionally, a total of 101,221 cells from ND-AITL and 102,299 cells from RR-AITL were collected within the IMC dataset, respectively (Fig. 1A).
Fig. 1: Comparison of the TME composition between ND-AITL and RR-AITL at the single-cell level.
A Overview of sample collection, computational analysis and experimental validation workflow. B UMAP plot of 55482 cells obtained from scRNA-seq profiles from 9 samples, colored by four main cell types. The cell counts and cell proportions for each cell type are labeled on the graph. C Dot plot depicting the expression of representative markers for four distinct cell types. Dot size is indicative of the proportion of cells within each cell type expressing these markers, and dot color represents the mean expression levels of these markers within each cell type. D MDS analysis demonstrates the inter- and intragroup differences among different ROIs. The dots were color-coded to indicate groups, with red representing the RR-AITL group and blue representing the ND-AITL group. The size of the dots was proportional to the number of cells within the ROIs. E The heatmap illustrates the protein levels of classical marker genes within individual cell. For the sake of clarity, a random sample of 5000 cells was selected for visualization. F The UMAP plot illustrates the identified cell types within the IMC dataset. G The cell types were visually represented in the images, with different colors denoting distinct cell types. One representative ROI was shown for each sample. The upper panel comprises four images from ND-AITL, while the lower panel displays three images from RR-AITL.
We integrated the transcriptomic data of single cells and performed unsupervised clustering, resulting in 26 clusters (Supplementary Fig. S1A–C). Based on the expression of well-established gene markers, four cell types were identified, including T/NK, B cells, myeloid, and stromal (Fig. 1B, C, Supplementary Fig. S1D). To further validate the accuracy of cell type annotations, we applied the SingleR method to perform unbiased cell type recognition. Results showed a high consistency between the cell type definitions based on these two methods (Supplementary Fig. S1E). Besides, the correlations of top five highly expressed genes in each cluster also validated the robustness of cell categories (Supplementary Fig. S1F, Supplementary Table 2). Furthermore, we found that the cellular components among three normal samples were identically consistent, whereas the samples from AITL patients showed a relatively higher inter-tumoral heterogeneity presented in the UMAP visualization (Supplementary Fig. S1G). Nonetheless, the percentage of these four main cell types identified in the scRNA-seq data had no obvious differences between ND-AITL and RR-AITL patients (Supplementary Fig. S1H), provoking us to further dissect and identify the detailed cellular and molecular plasticity in RR patients.
Besides, we employed IMC to comprehensively evaluate the cellular heterogeneity and spatial organization of the TME. Based on prior knowledge [6], we developed an IMC panel of three distinct categories of biomarkers, including cell types, immune status, and cellular state. This panel comprised 35 proteins specific to AITL histology (Supplementary Fig. S2A). These proteins enabled the identification of major cell types present in the AITL TME, including T cells, Tfh cells, macrophage, dendritic cells (DCs), fDCs, endothelial cells (Endo), B cells, and fibroblast (Fibro). Then we applied the panel to four ND-AITL and three RR-AITL samples, including eight and seven regions of interest (ROIs), respectively. The detailed clinical characteristics of these individuals were summarized in Supplementary Table 1.
We conducted single-cell segmentation and quality control to obtain high-quality spatial data at the single-cell level (see Methods, Supplementary Fig. S2B). Furthermore, we performed multidimensional scaling (MDS) analysis on the average expression of different markers in each ROI. The results showed a clear separation between ROIs from ND-AITL and RR-AITL (Fig. 1D). After batch correction and unsupervised clustering, we obtained 54 clusters of 16 distinct cell types (Supplementary Fig. S2C–F, Supplementary Table 3). The majority of these cell types were clearly separated based on the expression levels of their unique markers (Fig. 1E, F, Supplementary Fig. S2G). Similar to the previous IMC study [16], we also observed that some clusters co-expressed markers of different cell types simultaneously, such as fDC_near_myeloid. This phenomenon might be explained by the spatial co-localization of different cell types. The cellular composition varied between the RR group and the ND group across different ROIs and samples (Fig. 1G, Supplementary Fig. S2H). Taken together, these findings suggested the disparities in cellular proportions and states between RR-AITL and ND-AITL.
Malignant Tfh cells showed increased proliferation capacity in RR-AITL patientsOur initial emphasis was placed on delineating the distinct cellular states of malignant cells within the RR-AITL samples compared to ND-AITL samples. Hence, we re-clustered the T/NK populations to further investigate the cellular components of NC, ND-AITL, and RR-AITL. Ten clusters were identified, including T_C0~T_C9 (Fig. 2A). Based on the expression level of canonical markers, six subtypes were annotated (Fig. 2A, Supplementary Fig. S3A, B, Supplementary Table 4), including naïve T cells (Tnaive, including T_C0, T_C5, T_C7, and T_C8), CD4+ effector memory T cells (CD4+ Tem, T_C1), regulatory T cells (Treg, T_C6), follicular helper T (Tfh, including T_C2 and T_C4), CD8+ T (T_C3), and NK cells (T_C9). Tfh cells were further confirmed by analyzing the expression level of 7 antigens proposed by 2016 WHO classification for Tfh lymphomas diagnosis, including CXCL13, MME (CD10), ICOS, PDCD1 (CD279), BCL6, SH2D1A (SAP), and CXCR5 [17] (Supplementary Fig. S3A).
Fig. 2: Differences in the cellular states of malignant Tfh cells between ND-AITL and RR-AITL.
A UMAP visualization of various T/NK cell clusters (left) and subtypes (right). B Boxplot showing enrichment scores of AITL signature and stemness inferred by CytoTRACE across different T cells clusters. The boxplot represents the mean value and the error bar represents the standard error value. C Principal component analysis (PCA) of the clusters according to the mean transcription factor activity of each cluster. D Volcano plot of gene expression changes of Tfh cells between ND-AITL and RR-AITL. Upregulated (red) and downregulated (blue) genes in RR-AITL are highlighted. E Violin plot showing expression levels of CXCL13 in Tfh cells from ND-AITL and RR-AITL samples (upper panel). Violin plot showing enrichment score of AITL signatures in Tfh cells from ND-AITL and RR-AITL samples (bottom panel). P values were determined by two-sided unpaired Wilcoxon test. The boxplot represents the mean value and the error bar represents the standard error value. F GSEA plot showing the hallmarks that are significantly enriched in RR-AITL and ND-AITL, respectively. G Boxplot showing enrichment score of proliferation signature and PI3K/AKT pathway. P values were determined by two-sided unpaired Wilcoxon test. H Boxplot showing intensities of pAKT in IMC data. P values were determined by two-sided unpaired Wilcoxon test. I The IMC images showing the protein activity of pAKT within malignant Tfh cells. The colors represent protein activity levels, ranging from lower (blue) to higher (red). J, K Immunofluorescence analysis for ND-AITL and RR-AITL samples stained by an-ti-DAPI (blue), anti-CXCL13 (green), anti-pAKT (red) antibodies. Scale bar, 100 μm.
We found that Tfh cell clusters (T_C2 and T_C4) exhibit the lowest proportion of cells derived from NC samples (8.4% and 8.6%, respectively), and they showed the highest scores of AITL signature, stemness, and proliferation among all the T/NK clusters (Fig. 2B, Supplementary Fig. S3C, D), indicating the malignant phenotype of Tfh cells in AITL. Our findings revealed that a large number of transcription factors were specifically activated in T_C2 and T_C4 compared to other T cell clusters (Supplementary Fig. S3E). We performed principal component analysis (PCA) based on the activity of transcription factors (TFs) in single cells (see Methods), and observed that T_C2 and T_C4 clusters were separated from other T/NK clusters on the first two principal components (PCs), implying a distinct pattern of transcription regulation in malignant Tfh cells (Fig. 2C). In addition, we evaluated the activity of metabolism pathways among various T/NK clusters and found that Tfh clusters T_C2 and T_C4 had higher activity in a majority of metabolism pathways compared to other non-malignant clusters (Supplementary Fig. S3F). Overall, the analysis of transcriptional regulation and biological characteristics at the single-cell level provides evidence suggesting the involvement of Tfh in the pathogenesis of AITL, which is in agreement with prior knowledge of AITL.
Furthermore, we identified the significantly differently expressed genes between Tfh cells from ND- and RR- AITL (Fig. 2D, Supplementary Table 5). Notably, the classical Tfh markers CXCL13 and MME (CD10) were markedly downregulated in RR-AITL in comparison to ND-AITL (Fig. 2D, E). Immunohistochemistry (IHC) staining revealed that the proportion of CD10 and CXCL13 positive patients in the RR-AITL group was lower compared to the ND-AITL group, with a particularly notable decrease in CXCL13 positivity (Supplementary Fig. S3G). By exploring the expression of seven canonical AITL markers, we observed that the percentage of cells expressing these markers was significantly lower in the RR-AITL group compared to the ND-AITL group (Supplementary Fig. S3H). The enrichment score of AITL signature was also significantly lower in Tfh cells from RR-AITL (Wilcoxon rank sum test P < 2.2e-16; Fig. 2E). These results implied that the Tfh phenotype may lost in RR-AITL patients, which is similar to the erosion of chronic lymphocytic leukemia (CLL) cell identity observed by Rendeiro et al. [18].
As an essential transcriptional factor promoting tumor cell proliferation and stemness [19], SOX4 was markedly upregulated in RR-AITL (Fig. 2D). Moreover, the genes highly expressed in malignant Tfh cells from RR-AITL showed enrichment of proliferation-related hallmarks such as E2F targets (Normalized Enrichment Score (NES) = 2.03, P < 2.2e-16) and G2M checkpoint (NES = 1.56, P = 0.0018) (Fig. 2F, Supplementary Fig. S3I, Supplementary Table 6). Additionally, the proliferation signature score in malignant Tfh cells from RR-AITL was found to be higher compared to that in ND-AITL. This observation may be attributed to the significantly activated PI3K/AKT pathway in malignant Tfh cells from RR-AITL (Fig. 2G, Supplementary Fig. S3I). Protein levels of pAKT, as measured by IMC, were also found to be elevated in Tfh cells from RR-AITL patients in comparison to those from ND-AITL patients (Fig. 2H, I, Supplementary Fig. S3J). The immunofluorescence analysis further validated the loss of AITL phenotype and elevated pAKT level in RR-AITL (Fig. 2J, K).
Notably, pathways related to immune response such as IFN-γ and TNF-α signaling were significantly downregulated within malignant Tfh cells from RR-AITL compared to those from ND-AITL (Fig. 2F, Supplementary Fig. S3I, Supplementary Table 6), indicating the escape of immune surveillance.
Transcriptional factor YY1 is involved in the proliferation and immune evasion in RR-AITLTo elucidate the core TFs that govern the proliferation and modulating the immune response of RR-AITL, we compared the regulatory activity and expression level of TFs between RR-AITL and ND-AITL (see Methods). Our findings revealed significant upregulation in the activity and expression of four TFs, including YY1, REST, RUNX3, and ZNF91, in RR-AITL compared to ND-AITL (Fig. 3A, B, Supplementary Fig. S4A, Supplementary Table 7). Furthermore, YY1 and REST protein were found to be more abundant in malignant Tfh cells of RR-AITL compared to those in ND-AITL (Fig. 3C, Supplementary Fig. S4B). To comprehensively investigate the expression level of YY1, we compared the YY1 expression in Tfh cells and other T/NK subtypes derived from three different sample sources (Supplementary Fig. S4C). Results showed that malignant Tfh cells had significantly higher YY1 expression levels compared to other T cell types (including Tfh cells in NC samples). The proportion of YY1-expressing cells was also substantially higher in RR-AITL (Supplementary Fig. S4D). Additionally, malignant Tfh cells had significantly higher YY1 activity compared to other T/NK cell types including Tfh cells in NC samples (Fig. 3B, Supplementary Fig. S4E). The upregulation of YY1 in RR-AITL was validated by IMC dataset and immunofluorescence (Fig. 3D, F, Supplementary Fig. S4F). Meanwhile, the immunoreactive score (IRS) derived from IHC was significantly higher in RR-AITL, further supporting the activation of YY1 in RR-AITL (Supplementary Fig. S4G, H). These results collectively demonstrate the specific activation of YY1 in malignant Tfh cells from RR-AITL.
Fig. 3: The distinct transcriptional regulatory mechanisms of malignant Tfh cells in RR-AITL.
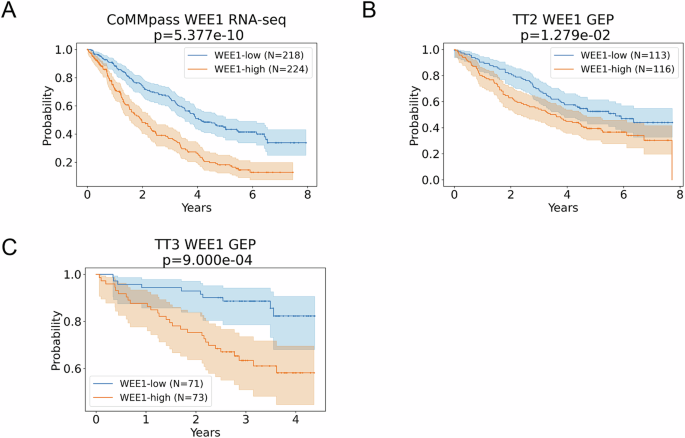
A Dot plot shows TFs that significantly activated in Tfh cells from RR-AITL compared to ND-AITL. Y axis represents -log10 transformation of adjusted P values of the activity of TFs inferred by pySCENIC, x axis represents -log10 transformation of adjusted P values of the expression of TFs. B Density plot shows the activity of YY1 across Tfh from NC (yellow), ND-AITL (blue) and RR-AITL (red). The vertical line represents the median of YY1 activity. C The intensities of YY1 between Tfh cells from ND-AITL and RR-AITL. The y axis represents the protein levels of YY1 in IMC dataset. D The protein activity of YY1 within malignant Tfh cells shown on IMC images. The colors represent protein activity levels, ranging from lower (blue) to higher (red). E, F Immunofluorescence analysis for ND-AITL (E) and RR-AITL (F) samples stained by anti-DAPI (blue) and anti-YY1(red) antibodies. Scale bar, 100 μm. G The spearman correlation between activity of YY1 and the enrichment score of pathways in malignant Tfh cells. Each data point represents an individual cell. H The functional enrichment analysis of YY1 target genes inferred by pySCENIC. The spearman correlation between YY1 expression and enrichment scores of proliferation (I), G2M checkpoint (J), TNFα signaling via NFκB (K) in GSE51521 dataset. Each data point represents individual sample. L Overall survival of AITL patients in our in-house cohort through Kaplan–Meier analysis. All patients were categorized into two groups based on the median YY1 expression level estimated by IHC. The significance was evaluated by the log-rank test. M Kaplan–Meier analysis was performed to assess overall survival in PTCL patients within the GSE58445 dataset. Only samples with available follow-up data were included in the analysis. Patients were stratified into four quartiles based on YY1 expression levels. For further comparison, the top 25% and bottom 25% of patients were specifically analyzed. The statistical significance of survival differences between these two groups was evaluated using the log-rank test.
In addition, we found that YY1 activity was positively correlated with proliferation-related pathways (e.g., cell cycle and G2M checkpoint) and negatively correlated with immune responses pathways (e.g., TNFα signaling, IL6/JAK/STAT3 signaling and regulation of inflammatory response) (Fig. 3G). In line with the aforementioned findings, YY1 target genes predicted by pySCENIC showed significant enrichment in proliferation-related hallmarks, including Myc targets, E2F targets, G2M checkpoint, and the PI3K/AKT/mTOR signaling pathway (Fig. 3H). By analyzing the overlap between PI3K/AKT/mTOR signaling pathway genes and YY1 target genes, we found that ~34% of the genes in the PI3K/AKT/mTOR signaling pathway were directly regulated by YY1 (Supplementary Fig. S4I). Furthermore, the expression levels of these YY1 target genes showed significant positive correlations with YY1 activity (Supplementary Fig. S4J). Moreover, we identified an enrichment of proliferation-related pathways in malignant Tfh cells exhibiting higher YY1 activity, while immune response pathways were enriched in those with lower YY1 activity (Supplementary Fig. S4K). By using a publicly available bulk RNA-seq dataset, we further validated the significantly positive correlation between YY1 expression and proliferation-related signatures (Fig. 3I, J). Meanwhile, we also observed a significant negative correlation with TNFα signaling in this dataset (Fig. 3K).
To elucidate the downstream mechanisms by which YY1 facilitates malignant Tfh proliferation, we investigated to recognize potential target genes. Based on intersection of known and predicted targets genes of YY1 (see Methods), four genes were identified, including CBX5, PCBP1, SMC3, and RAC1 (Supplementary Fig. S4L, M, Supplementary Table 8). Additionally, the expression level of YY1 was positively correlated with the expression of these genes in bulk RNA-seq data (Supplementary Fig. S4N). A large number of studies have shown that these genes are involved in cellular proliferation processes [20,21,22,23]. Notably, RAC1 is a member of the Rho family of GTPases and regulates multiple signaling pathways, such as NFκB and PI3K/AKT [24], implying that YY1 may activate PI3K/AKT pathway through an RAC1-dependent mechanism.
In addition, our in-house cohort containing 46 tumor tissue samples from AITL patients were collected and analyzed using immunohistochemistry to determine YY1 protein levels. The evaluation revealed a significant association between elevated YY1 expression and a poorer prognosis in AITL patients (P = 0.010; Fig. 3L). We further investigated the association between YY1 and prognosis in a public PTCL dataset. We found that PTCL patients with higher YY1 expression also had significantly poor prognosis (P = 0.009; Fig. 3M), indicating that YY1 may play an important role in tumor progression of PTCL patients.
The depletion of cytotoxic CD8+ T cells in RR-AITL compared to ND-AITLThrough a sophisticated interplay of signaling pathways, tumor cells actively remodel the TME to evade immune surveillance and support tumor progression. Considering the pivotal role of T cells in targeting and eliminating tumors within the TME, our study delves deeper into the cellular states of T cells in RR-AITL. We observed marked heterogeneity in the T/NK populations among NC, ND-, and RR-AITL (Fig. 4A). We analyzed the differential enrichment of T/NK subpopulations in these three groups (Fig. 4B, Supplementary Table 9). Tfh cells were significantly overrepresented in both ND-AITL and RR-AITL compared to NC. Besides, we observed a relative depletion of CD4+ Tem and CD8+ T cells in both ND-AITL and RR-AITL compared to NC. Moreover, the comparative results between ND-AITL and RR-AITL showed that Tregs were enriched in the RR group compared to the ND group with an odds ratio of 1.795 (P = 1.487e-13); while the CD8+ T cells had a significantly lower enrichment in RR group with an odds ratio of 0.831 (P = 7.967e-06) (Fig. 4B). The alterations in intergroup proportions of Tregs and CD8+ T cells were further validated by immunofluorescence staining (Fig. 4C). We also observed the diminishment of CD8+ T cells within the IMC dataset for RR-AITL (Fig. 4D, E, Supplementary Fig. S5A). Given the immune inhibitory role of Tregs and anti-tumor capabilities of CD8+ T cells and CD4+ Tem [25,26,27], these results indicated the immunosuppressive microenvironment in RR-AITL.
Fig. 4: The exclusion and dysfunction of CD8+ T cells in RR-AITL.
A T/NK cells from NC, ND-AITL and RR-AITL illustrated in UMAP plots, respectively. B Group preference of T cells subtypes, with color encoded by odds ratio estimated by one-sided Fisher’s exact test. *P value < 0.05, **P value < 0.01,***P value < 0.001. The orange color represents enrichment of subpopulation in the sample, while green color represents depletion of subpopulation in the sample. C Immunofluorescence analysis for ND-AITL (left) and RR-AITL (right) samples stained by anti-DAPI (blue), anti-CD8 (green), anti-FOXP3(red) antibodies. Scale bar, 100 μm. D The percentage of selected cell types within IMC dataset between ND-AITL and RR-AITL. E The representative markers for Tfh cells (ICOS; green) and CD8+ T cells (CD8α; red) stained in each ROI. F Enrichment scores of pathways related to T cell migration capacity in CD8+ T cells from ND-AITL and RR-AITL samples. P values were determined by two-sided unpaired Wilcoxon test. G Enrichment scores of cytotoxic and exhausted signatures of CD8+ T cells from ND-AITL and RR-AITL samples. ***P value < 0.001. P values were determined by two-sided unpaired Wilcoxon test. H Violin plots depict the intensities of immune checkpoint molecules in CD8+ T cells between seven and eight ROIs from RR-AITL and ND-AITL, respectively. P values were determined by two-sided unpaired Wilcoxon test. I Violin plots showing the intensities of PD-L1 in malignant Tfh cells across seven and eight ROIs in RR-AITL and ND-AITL, respectively. P values were determined by two-sided unpaired Wilcoxon test. J The spearman correlation between YY1 expression and the percentage of CD8+ T cells estimated by CIBERSORTx in GSE51521 dataset. Each data point represents individual sample.
Furthermore, we found that T cell migration-related pathways were more enriched in CD8+ T of ND-AITL compared to RR-AITL (Fig. 4F, Supplementary Fig. S5B), which may explain the relatively higher CD8+ T abundance in ND-AITL. Besides, we investigated the cellular states of CD8+ T cells and observed a significant reduction in their cytotoxic capacity in RR-AITL as compared to ND-AITL (Wilcoxon rank sum test, P = 8.984e-6). Conversely, CD8+ T cells exhibited a greater degree of exhaustion in RR-AITL compared with ND-AITL (Wilcoxon rank sum test, P = 2.376e-3; Fig. 4G) where the exhaustive markers, including PD-1, TIGIT and CD152 (encoded by CTLA4), were elevated in CD8+ T cells from RR-AITL (Fig. 4H), as observed in the IMC dataset. Meanwhile, malignant Tfh cells in RR-AITL had higher intensities of PD-L1 compared to ND-AITL (Fig. 4I). Besides, YY1 expression negatively correlates with the percentage of CD8+ T cells (Fig. 4J), suggesting a potential role for YY1 in excluding CD8+ T cells.
B cells in RR-AITL are in an intermediate state of malignant transformation to B-cell-lymphomaUnder physiological conditions, the interaction between Tfh and B cells is a central event in the formation of the germinal center (GC). Accompanying the malignant transformation of Tfh cells in AITL, B cells in AITL may exhibit Epstein-Barr virus (EBV) infection, undergo clonal expansion, and display specific genetic mutations, such as TET2 [6]. The crosstalk between Tfh and B cells promotes AITL progression [14]. Hence, we next attempted to elucidate the role of B cells in AITL progression by comparing the expression profiles of B cells from RR-AITL and ND-AITL patients. The 469 upregulated genes and 126 downregulated genes were identified in RR-AITL (Fig. 5A, Supplementary Table 10). Notably, RGS13, a canonical marker of GCB cells, is highly expressed in RR-AITL. Previous studies showed that RGS13 contributes to reduced responsiveness to chemokines in GCB cells and B lymphoma [28, 29]. In contrast, the markers for plasma cells, such as MZB1, IGHG2 and JCHAIN, were highly expressed in ND-AITL. Functional enrichment analysis showed that genes upregulated in RR-AITL were enriched in VEGFA-VEGFR2 signaling pathway and Fc-gamma receptor signaling pathway. B cell-derived vascular endothelial growth factor A can partly contribute to the proliferative HEVs, a key histologic feature of AITL [11, 30] (Supplementary Fig. S6A). Fc-gamma receptors on B lymphocytes negatively regulate B cell receptor (BCR)-dependent activation [31]. Notably, genes highly expressed in B cells from RR-AITL were enriched in B cell lymphoma, especially in diffuse large B-cell lymphoma (DLBCL) cell lines, including SUDHL4, NUDHL1, KARPAS422, SUDHL6 and RL, suggesting the propensity for malignant transforming of B cells in RR-AITL (Fig. 5B).
Fig. 5: Integrative analysis for B cells from ND-AITL, RR-AITL and DLBCL.
A Volcano plot of expression changes between B cells from ND-AITL and RR-AITL samples. Upregulated genes in RR-AITL (red) and ND-AITL (blue) are highlighted. B The enrichment analysis of upregulated genes in B cells from RR-AITL compared to ND-AITL. The Cancer Cell Line Encyclopedia gene set is derived from Enrichr website. C The UMAP plot illustrates B cells colored according to sample classification, including B cells from ND-AITL (green), RR-AITL (orange), and DLBCL (blue). D Barplot showing the fraction of B cells from ND-AITL (green), RR-AITL (orange) and DLBCL (blue) samples in each cluster. E The violin plot showing IGKC fraction in ND-AITL (green), RR-AITL (orange) and DLBCL (blue) samples. The IGKC fraction, IGKC/(IGKC + IGLC2), was calculated for each B cell. F The trajectory plots showing the pseudotime (left) and group (right) of each cell. G Density plot (upper panel) of cell number along the pseudotime from ND-AITL (green), RR-AITL (orange) and DLBCL patients (blue). Heatmap (bottom panel) showing gene expression alterations along the pseudotime. H The plot showing expression of MYC, TCL1A, STMN1, VPREB3, CD24 and PCNA along the pseudotime. Line indicates smoothed mean expression of genes in the state across pseudotime. I The protein levels of cMyc in B cells. P values were determined by two-sided unpaired Wilcoxon test. J The IMC images showing the protein activity of cMyc within B cells. The colors represent protein activity levels, ranging from lower (blue) to higher (red).
We further integrated the scRNA-seq data of B cells from ND-AITL, RR-AITL, and DLBCL to explore the alterations of cellular state of B cells (see Methods, Fig. 5C). After unsupervised clustering, 13 clusters were identified, including B_C0~B_C12 (Supplementary Fig. S6B). According to the relative fraction of B cells from ND-AITL, RR-AITL and DLBCL in each cluster (Fig. 5D), we classified these clusters into three groups: ND (B_C3, B_C5 and B_C10), RR (B_C8, B_C9 and B_12), and DLBCL (B_C1, B_C7, B_C6, B_C11, B_C4, B_C2 and B_C0). Based on the average expression of top 30 highly expressed genes in each cluster, we calculated the Pearson correlation between these B cell clusters. Hierarchical clustering showed that the RR clusters had higher similarity with the DLBCL clusters (Supplementary Fig. S6C). We also evaluated the activity of metabolic pathways of each B cell cluster (Supplementary Fig. S6D). Results showed that B-cell clusters of ND-AITL had relatively lower metabolic activity, and DLBCL B-cell clusters had the highest metabolic activity across multiple pathways. Notably, B-cell clusters of RR-AITL showed significantly high activity of pathways which were also activated in DLBCL, such as glycerophospholipid metabolism and inositol phosphate metabolism [32, 33]. According to a previously established method that identifies malignant B cells based on the expression of immunoglobulin κ constant (IGKC) and immunoglobulin λ constant 2 (IGLC2) [34], we calculated the IGKC fraction for each B cell (see Methods, Fig. 5E). Results showed that ND-AITL patients contained both κ- and λ-expressing B cells, indicating the normal status of B cells. In contrast, the majority of B cells from RR-AITL and DLBCL homogeneously expressed the κ light chain, suggesting the propensity for malignant transformation of B cells in RR-AITL.
Furthermore, pseudotime analysis was used to uncover the potential developmental trajectory of B cells (Fig. 5F). We found that B cell clusters from various groups were distributed differentially along the trajectory, with ND-AITL clusters located at the early branch, RR-AITL clusters located at early/middle branches, and DLBCL clusters located at the end of the trajectory (Fig. 5F, Supplementary Fig. S6E). This observation implied the potential evolution trajectory of B cells from ND-AITL, RR-AITL to malignant B-cell lymphoma. The density plot of cells along the pseudotime also showed that most of the B-cells from ND-AITL located at the beginning of the pseudotime, and a majority of B cells from RR-AITL located between the ND-AITL and DLBCL, implying that B cells in RR-AITL might represent an intermediate state during the process of malignant transformation (Fig. 5G, upper panel). Next, we identified gene modules that had differential expression along with the single-cell trajectory, including module-1 specifically expressed in ND-AITL, module-2 and module-3 highly activated in RR-AITL, and module-4 expressed in DLBCL (Fig.
留言 (0)