OSA is characterized by the complete or partial collapse of the upper airway for at least 10 s during sleep, leading to complete cessation (apnea) or decreased airflow (hypoventilation). Excessive daytime drowsiness is a prominent symptom of OSA (1, 2). Epidemiological data indicate that OSA affects approximately 17% of females and 34% of males aged 30 to 70 in the United States (3). Without any treatment in time, OSA will result in serious health complications such as cardiovascular diseases (4, 5), hypertension (6) and diabetes mellitus (DM) (7). Therefore, identifying precise and novel biomarkers for the early detection of OSA is crucial.
OSA is widely recognized as a significant complication correlated with obesity (8). Obesity is typified by the accumulation of visceral adipose tissues (VAT). Conventional metrics, such as body mass index (BMI), can only provide a general assessment on obesity and fail to distinguish visceral from subcutaneous fat. In recent developments, Bello-Chavolla et al. (9) introduced a novel visceral adiposity score, termed METS-VF, which is markedly superior to traditional obesity indexes in estimating VAT. METS-VF, encompassing variables such as WHtR, BMI, HDL-C, FPG, TG, gender, and age, can offer a comprehensive assessment on VAT and its metabolic implications, which can not only evaluate the glycolipid metabolism and distribution of body fat, but also incorporate gender and age-specific variations in VAT. Recent research has highlighted the superiority of METS-VF compared to traditional obesity indexes in predicting and assessing the risk of metabolic diseases, such as hyperuricemia, hypertension, DM, and chronic kidney dysfunction (CKD) (10–14). To date, however, no published studies have explored the correlation between METS-VF and the prevalence of OSA.
In this study, the data from the NHANES database were analyzed to explore the correlation between METS-VF and the prevalence of OSA in a nationally representative sample.
Methods Research populationNHANES, conducted by NCHS (15), is a comprehensive study designed to assess the correlation between nutrition, health promotion, and disease prevention. The survey shall be conducted every 2 years by taking physical examinations, interviews, and various sections covering dietary, demographic, examination, and laboratory data.
A total of 44,960 subjects were included in the NHANES database during the period from 2013 to 2020. By rigorous exclusion and inclusion criteria, 8,284 American adults from NHANES 2013–2020 were identified as samples. Specifically, 17,306 individuals under 20 years old, 5,798 individuals missing OSA data, and 12,207 individuals missing METS-VF were excluded from the study (as shown in Figure 1).
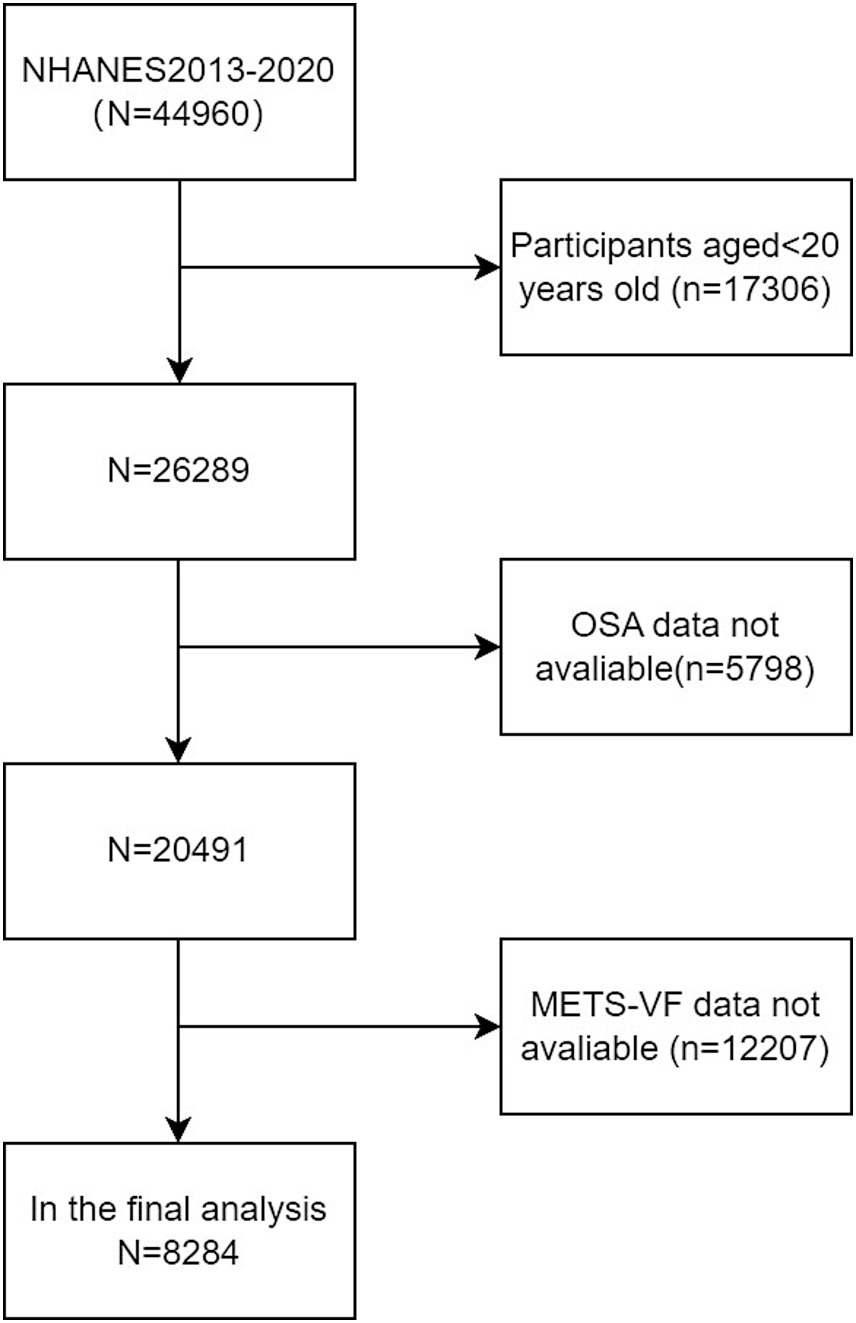
Figure 1. Flowchart of the sample selection from the 2013–2020 NHANES.
Assessment of OSAConsistent with prior research, high-risk for OSA was defined when an individual affirmed a positive response to at least one of the three questions of NHANES (16): (1) Daylight sleepy, characterized by excessive drowsiness while awake, despite sleeping for at least 7 h per night, reported between 16 to 30 times; (2) Stopped breathing, with episodes occurring three or more times per week; (3) Snoring: snoring on three or more occasions per week.
Measurement of covariatesThe demographics and lifestyle data came from the household interview questionnaires administered by highly trained medical personnel. Anthropometric indexes and biochemical parameters were obtained through medical examinations and subsequent laboratory assessments in the Mobile Examination Centre (MEC). According to previous studies (17, 18), potential confounding factors correlated with OSA and METS-VF were incorporated into the final analysis. These factors included demographic variables (age, height, race, blood pressure, gender, waist circumference, educational attainment, weight, and physical activities). Questionnaire surveys included alcohol consumption, hypertension, lipid-lowering drugs (LLDs) and DM. TC, UA, HbA1c, albumin, LDL-C, ALT, TG, GGT, AST, creatinine, and HDL-C were collected in blood samples. Less than 3% of values missed in total. Multiple imputation was performed for missing values. Self-reported race was categorized into the following five races: non-Hispanic Black, non-Hispanic White, other Hispanic, Mexican Americans, and other races. Educational level was divided into two levels: high school or above, less than high school. Alcohol consumption was assessed by using a question: “In 1 year, have you had at least 12 drinks of any type of alcoholic beverage?” Participants who answered ‘yes’ were identified as alcohol drinkers. Participants having diabetes mellitus were identified by having any of the following conditions: Have been told by a doctor or health professional having diabetes mellitus, HbA1c ≥ 6.5%, fasting plasma glucose≥7.0 mmoL/L, two-hour OGTT blood glucose≥11.1 mmoL/L, and use of diabetes mellitus medication or insulin. Hypertension in participants was defined based on any of the following: ever been told by a doctor or a health professional that had hypertension, mean systolic blood pressure ≥ 140 mmHg, and mean diastolic blood pressure ≥ 90 mmHg. Detailed measurements and data acquisition for each variable can be accessed at www.cdc.gov/nchs/nhanes.
Calculation formula of METS-VFThe metabolic score for IR (METS-IR) was calculated with the following formula: METS-IR = Ln [TG (mg/dL) +2 × FPG (mg/dL)] × BMI (kg/m2) / Ln [HDL-C (mg/dL)] (19);
METS-VF was calculated with the following formula: METS-VF = 3.239 × [Ln (WHtR)]3 + 0.011 × [Ln (METS-IR)]3 + 0.319 × gender (male = 1, female = 0) +4.466 + 0.594 × [Ln (Age) (year)] (9).
Statistical analysisMETS-VF values were categorized into quartiles (Q1: ≤6.27; Q2: 6.27–6.69; Q3: 6.69–7.00; Q4: ≥7.00). Categorical characteristics were expressed as proportions, whereas continuous variables were summarized by standard errors and means. Differences among quartile groups were assessed with chi-square tests or Kruskal-Wallis H test. Bonferroni test was adopted for the intergroup comparison. Variables demonstrating clinical and statistical significance in the univariate analyses (p < 0.05) were incorporated into the multivariate analyses. Multiple logistic regression models were employed to explore ORs and 95% CIs between OSA and METS-VF. The analysis incorporated three models: Model 1 (unadjusted), Model 2 (adjusted for age, race, and gender), and Model 3 (fully adjusted for drinking, educational level, TC, moderate physical activities, DM, albumin, SBP, DBP, ALT, AST, creatinine, GGT, LLDs and uric acid). Potential modifications of the correlation by covariates were explored with interaction tests and subgroup analyses. Additionally, whether the correlation between METS-VF and OSA was linear was determined through restricted cubic spline (RCS) analysis. Finally, the robustness of the findings were assessed through three sensitivity analyses: (1) Excluding subjects taking lipid-lowering drugs potentially affecting METS-VF, (2) taking “stopped breathing” as the dependent variable, and (3) taking “snoring” as the dependent variable. Data analyses were performed with R software (version 3.4.3) and Free Statistics software (version 1.9.2), with a significance threshold at p < 0.05 for all statistical tests.
Results Baseline characteristics of subjectsA total of 8,284 subjects aged between 20 and 80 years old were included in this study, with a prevalence of OSA of 50.4%. Demographic characteristics, stratified by METS-VF quartiles, are presented in Table 1. Subjects in the highest METS-VF quartile exhibited a higher prevalence of DM, OSA, hypertension and elevated ALT, weight, uric acid, BMI, TG, SBP, waist circumference, and FPG, compared to those in the lowest quartile. Conversely, subjects in the highest quartile showed lower levels of HDL-C and albumin (p < 0.01) (as presented in Table 1). As illustrated in Figure 2, the prevalence of OSA increased across quartiles: 32.8% in Q1, 49.8% in Q2, 56.9% in Q3, and 62.1% in Q4, along with a rise in OSA symptoms such as daytime sleepiness, stopped breathing, and snoring.
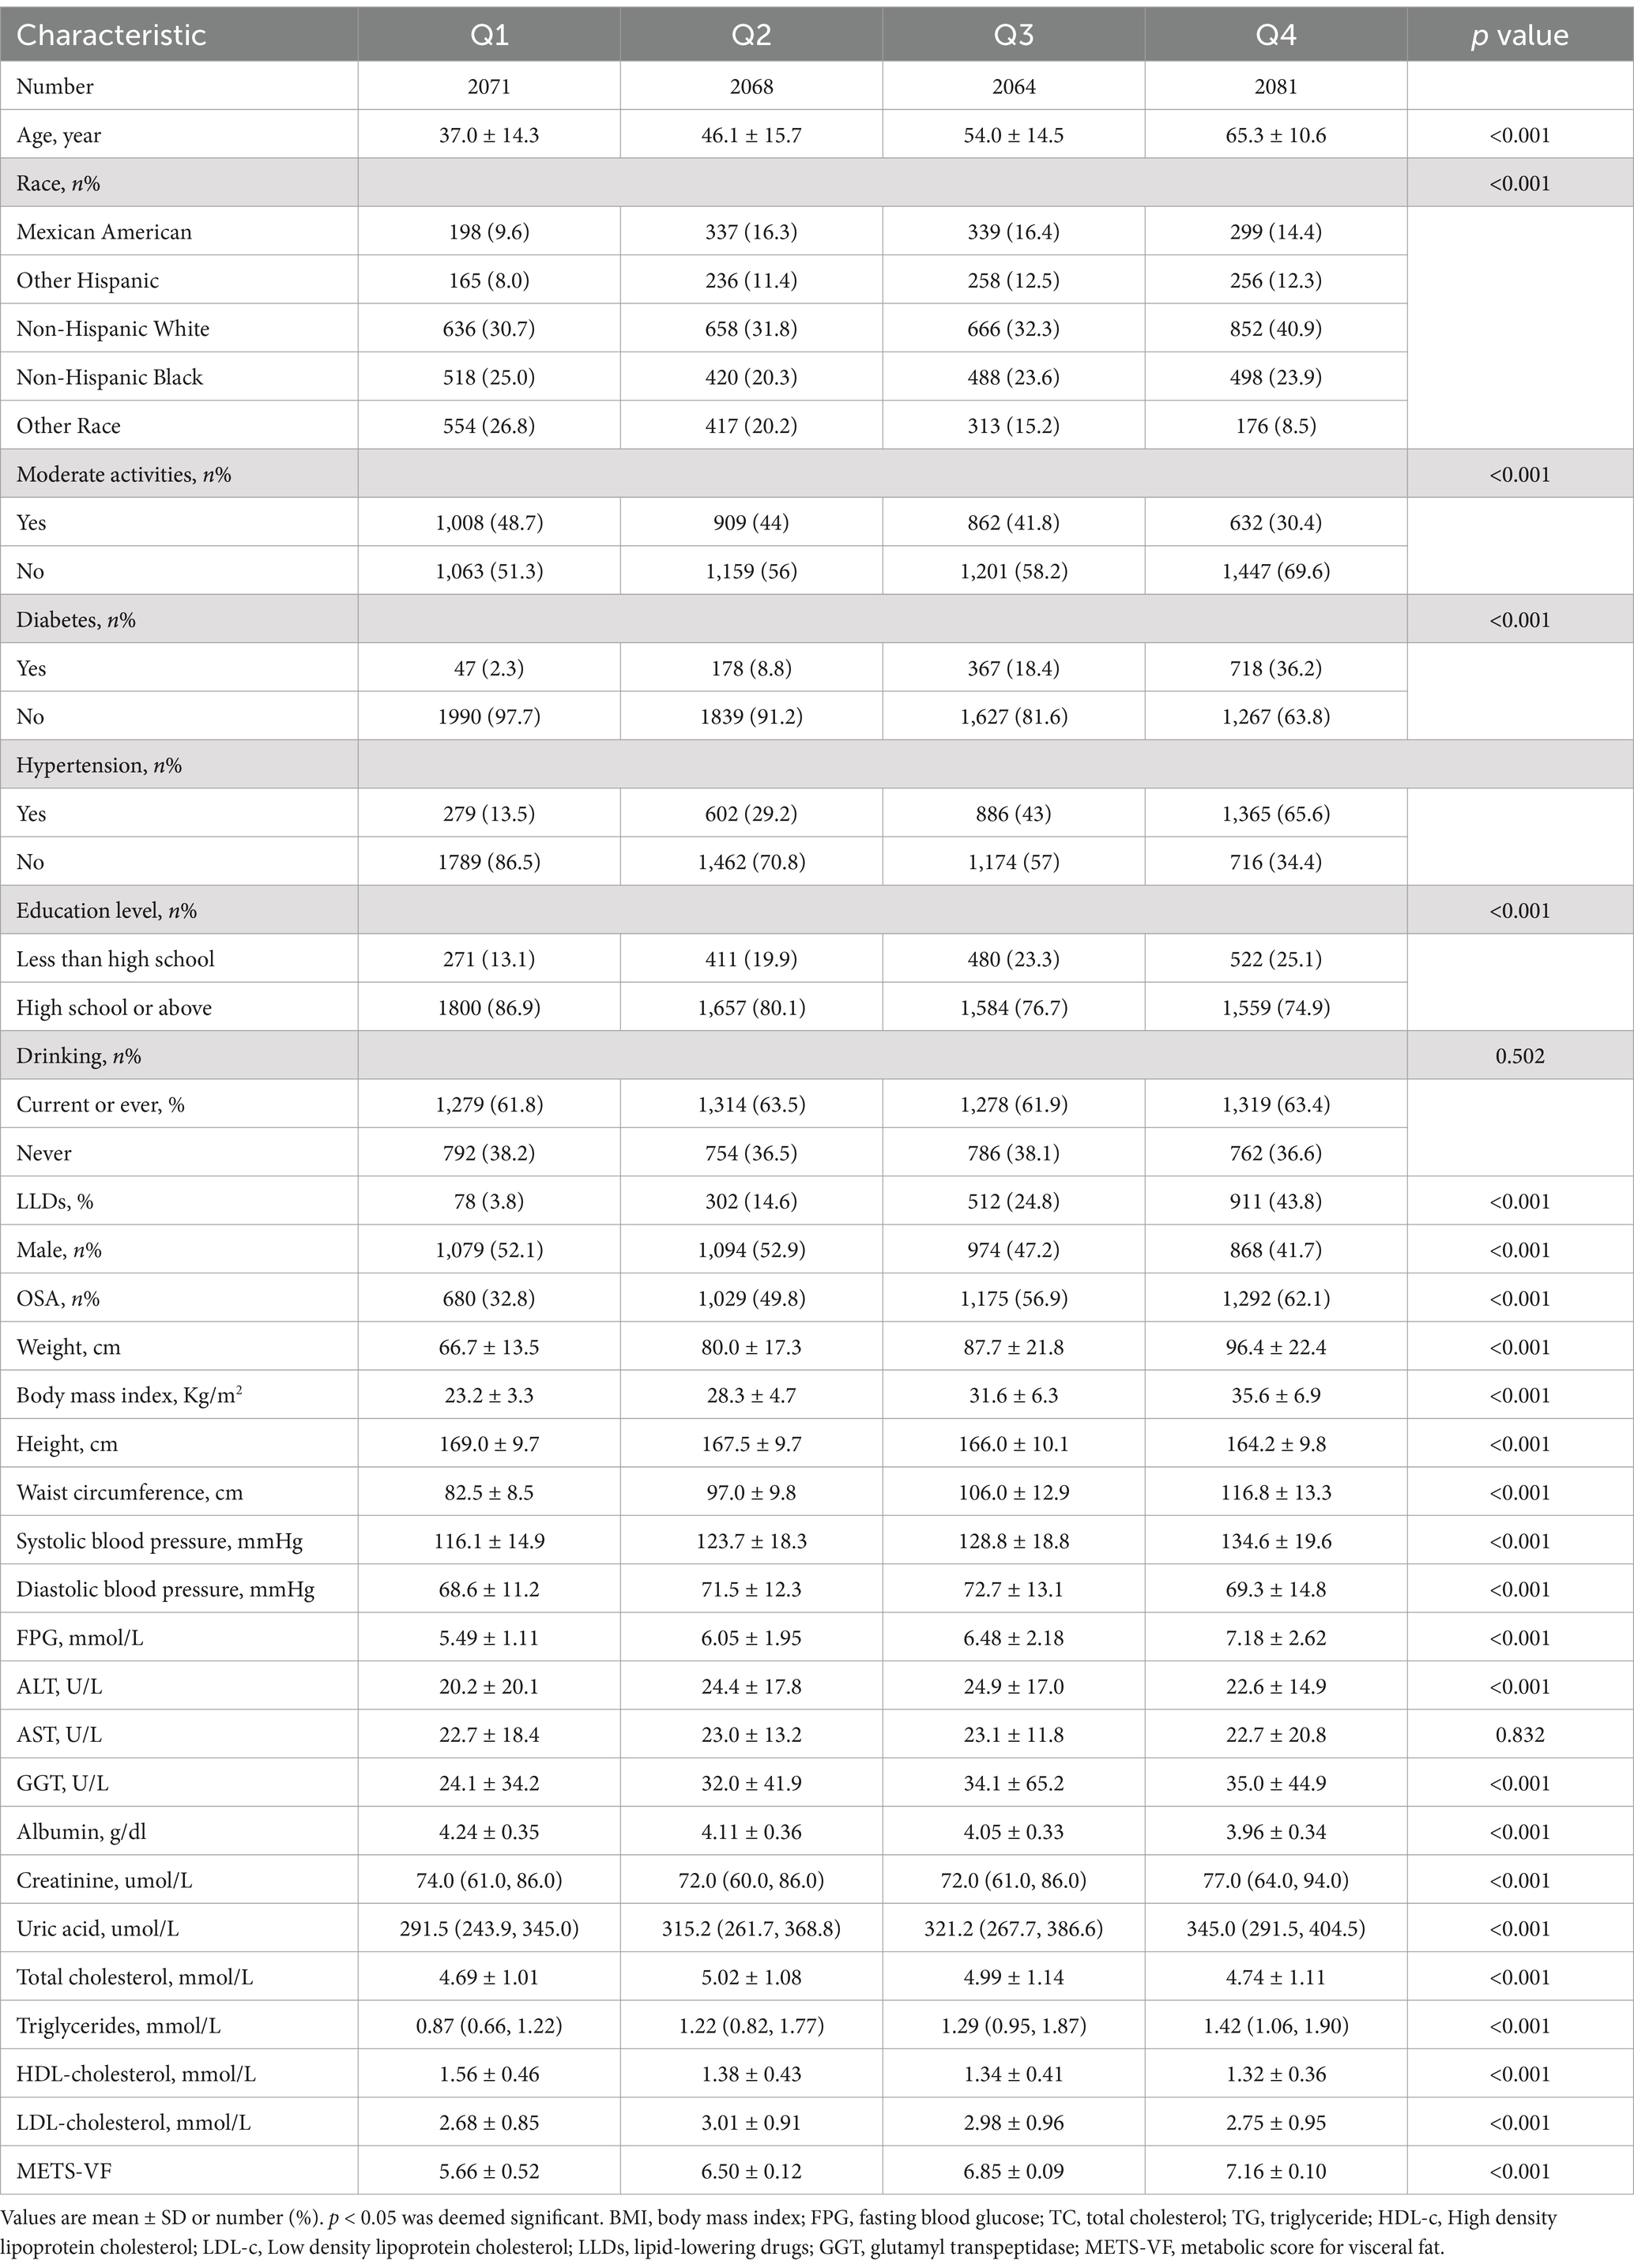
Table 1. Weighted characteristics of the study population based on METS-VF quartiles.
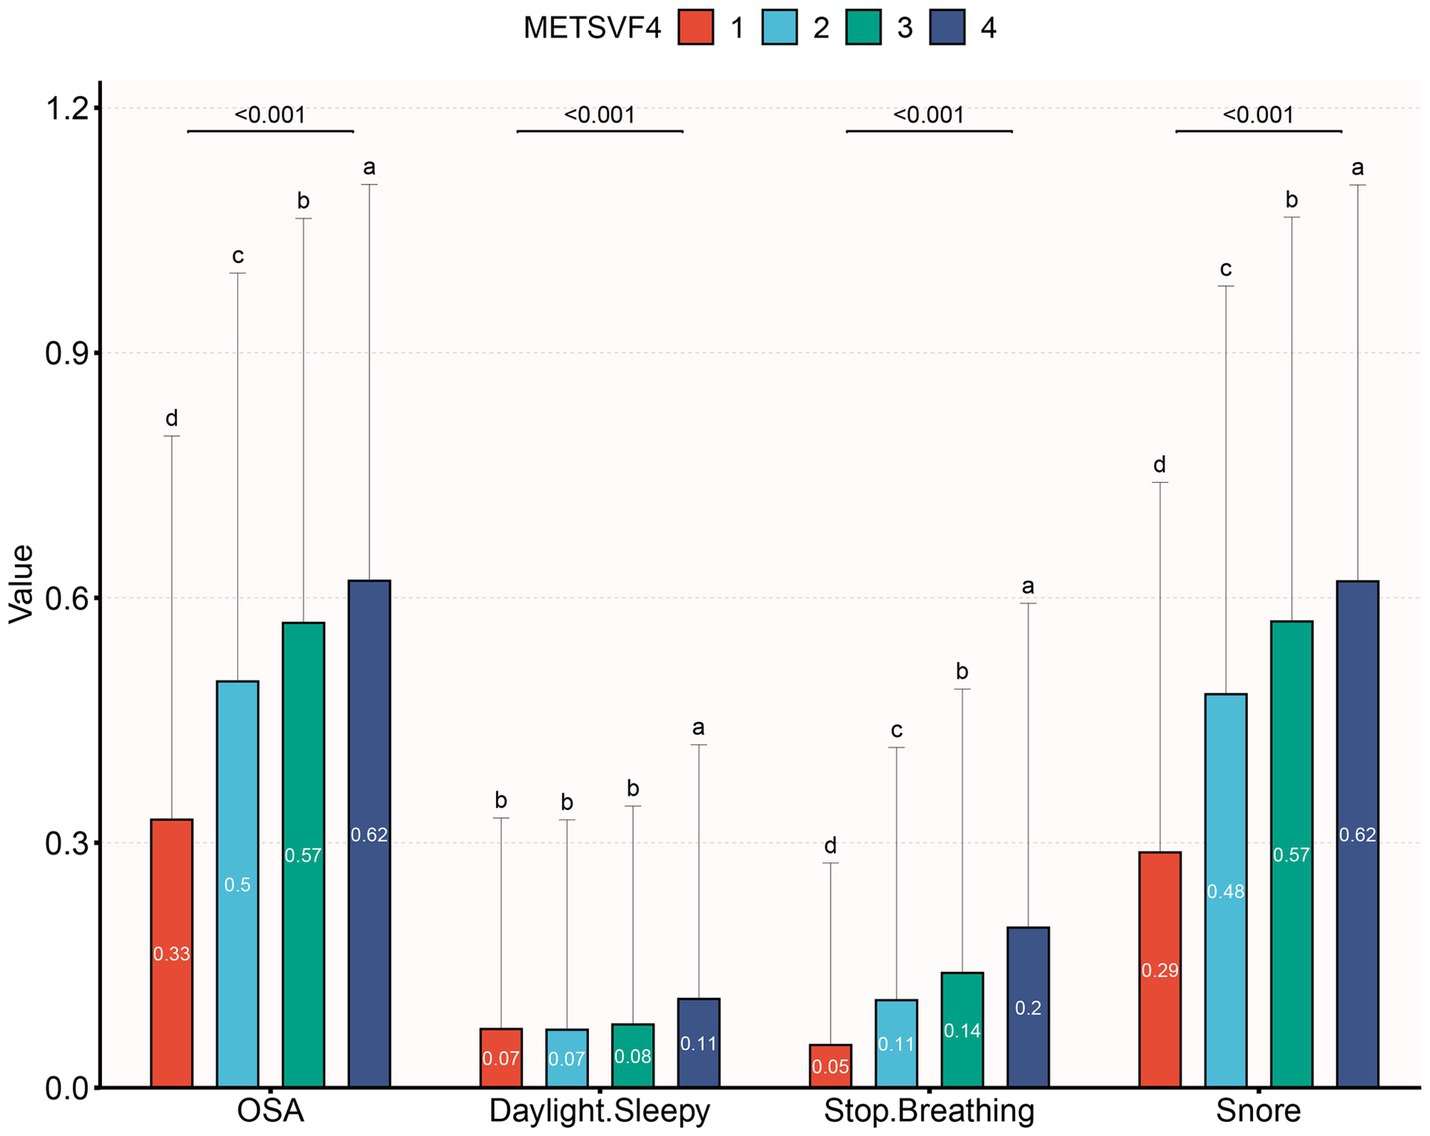
Figure 2. The prevalence of OSA and OSA symptom across quartiles of METS-VF.
Correlation between METS-VF and metabolic parametersSpearman’s correlation analysis (as presented in Table 2) revealed that METS-VF was positively correlated with FPG, DBP, TG, uric acid, SBP, uric acid and LDL-C, and negatively correlated with HDL-C (all p < 0.05).

Table 2. Spearman’s correlation of METS-VF levels with clinical and biochemical parameters.
Logistical correlation between METS-VF and OSAIn order to explore the correlation between OSA and METS-VF, three multiple regression models were developed (as presented in Table 3). Model 1, the unadjusted model, indicated a statistically significant positive correlation between OSA and METS-VF, which remained evident after adjusting for all covariates in Model 3 (OR = 2.436, 95% CI: 2.065, 2.874, p < 0.001). According to the sensitivity analysis, METS-VF was categorized into quartiles, showing that in the fully adjusted Model 3, subjects in the second, third, and fourth quartiles had a statistically significant increase in the risk of having OSA by 0.945, 1.601, and 2.481, respectively, compared to those in the lowest quartile. To further explore the correlation between METS-VF and OSA, restricted cubic spline smoothing curve fitting with Model 3 was conducted. The results depicted in Figure 3 revealed a linear correlation between METS-VF and OSA, without threshold effects.

Table 3. Association between METS-VF and OSA in logistic regression analysis.

Figure 3. Restricted cubic spline fitting for the association between METS-VF index levels and OSA.
Subgroup analysisThrough comprehensive subgroup analyses and interaction tests, the robustness of the correlation between METS-VF and OSA was evaluated, to identify potential population variations (as shown in Figure 4). The results consistently demonstrated a notable correlation between METS-VF and OSA within various subgroups. It is particularly noteworthy that there were significant interaction effects between METS-VF and age, gender and race (all interaction p < 0.05). The correlation between METS-VF and OSA was more pronounced in subjects who were female, younger, and Mexican Americans.
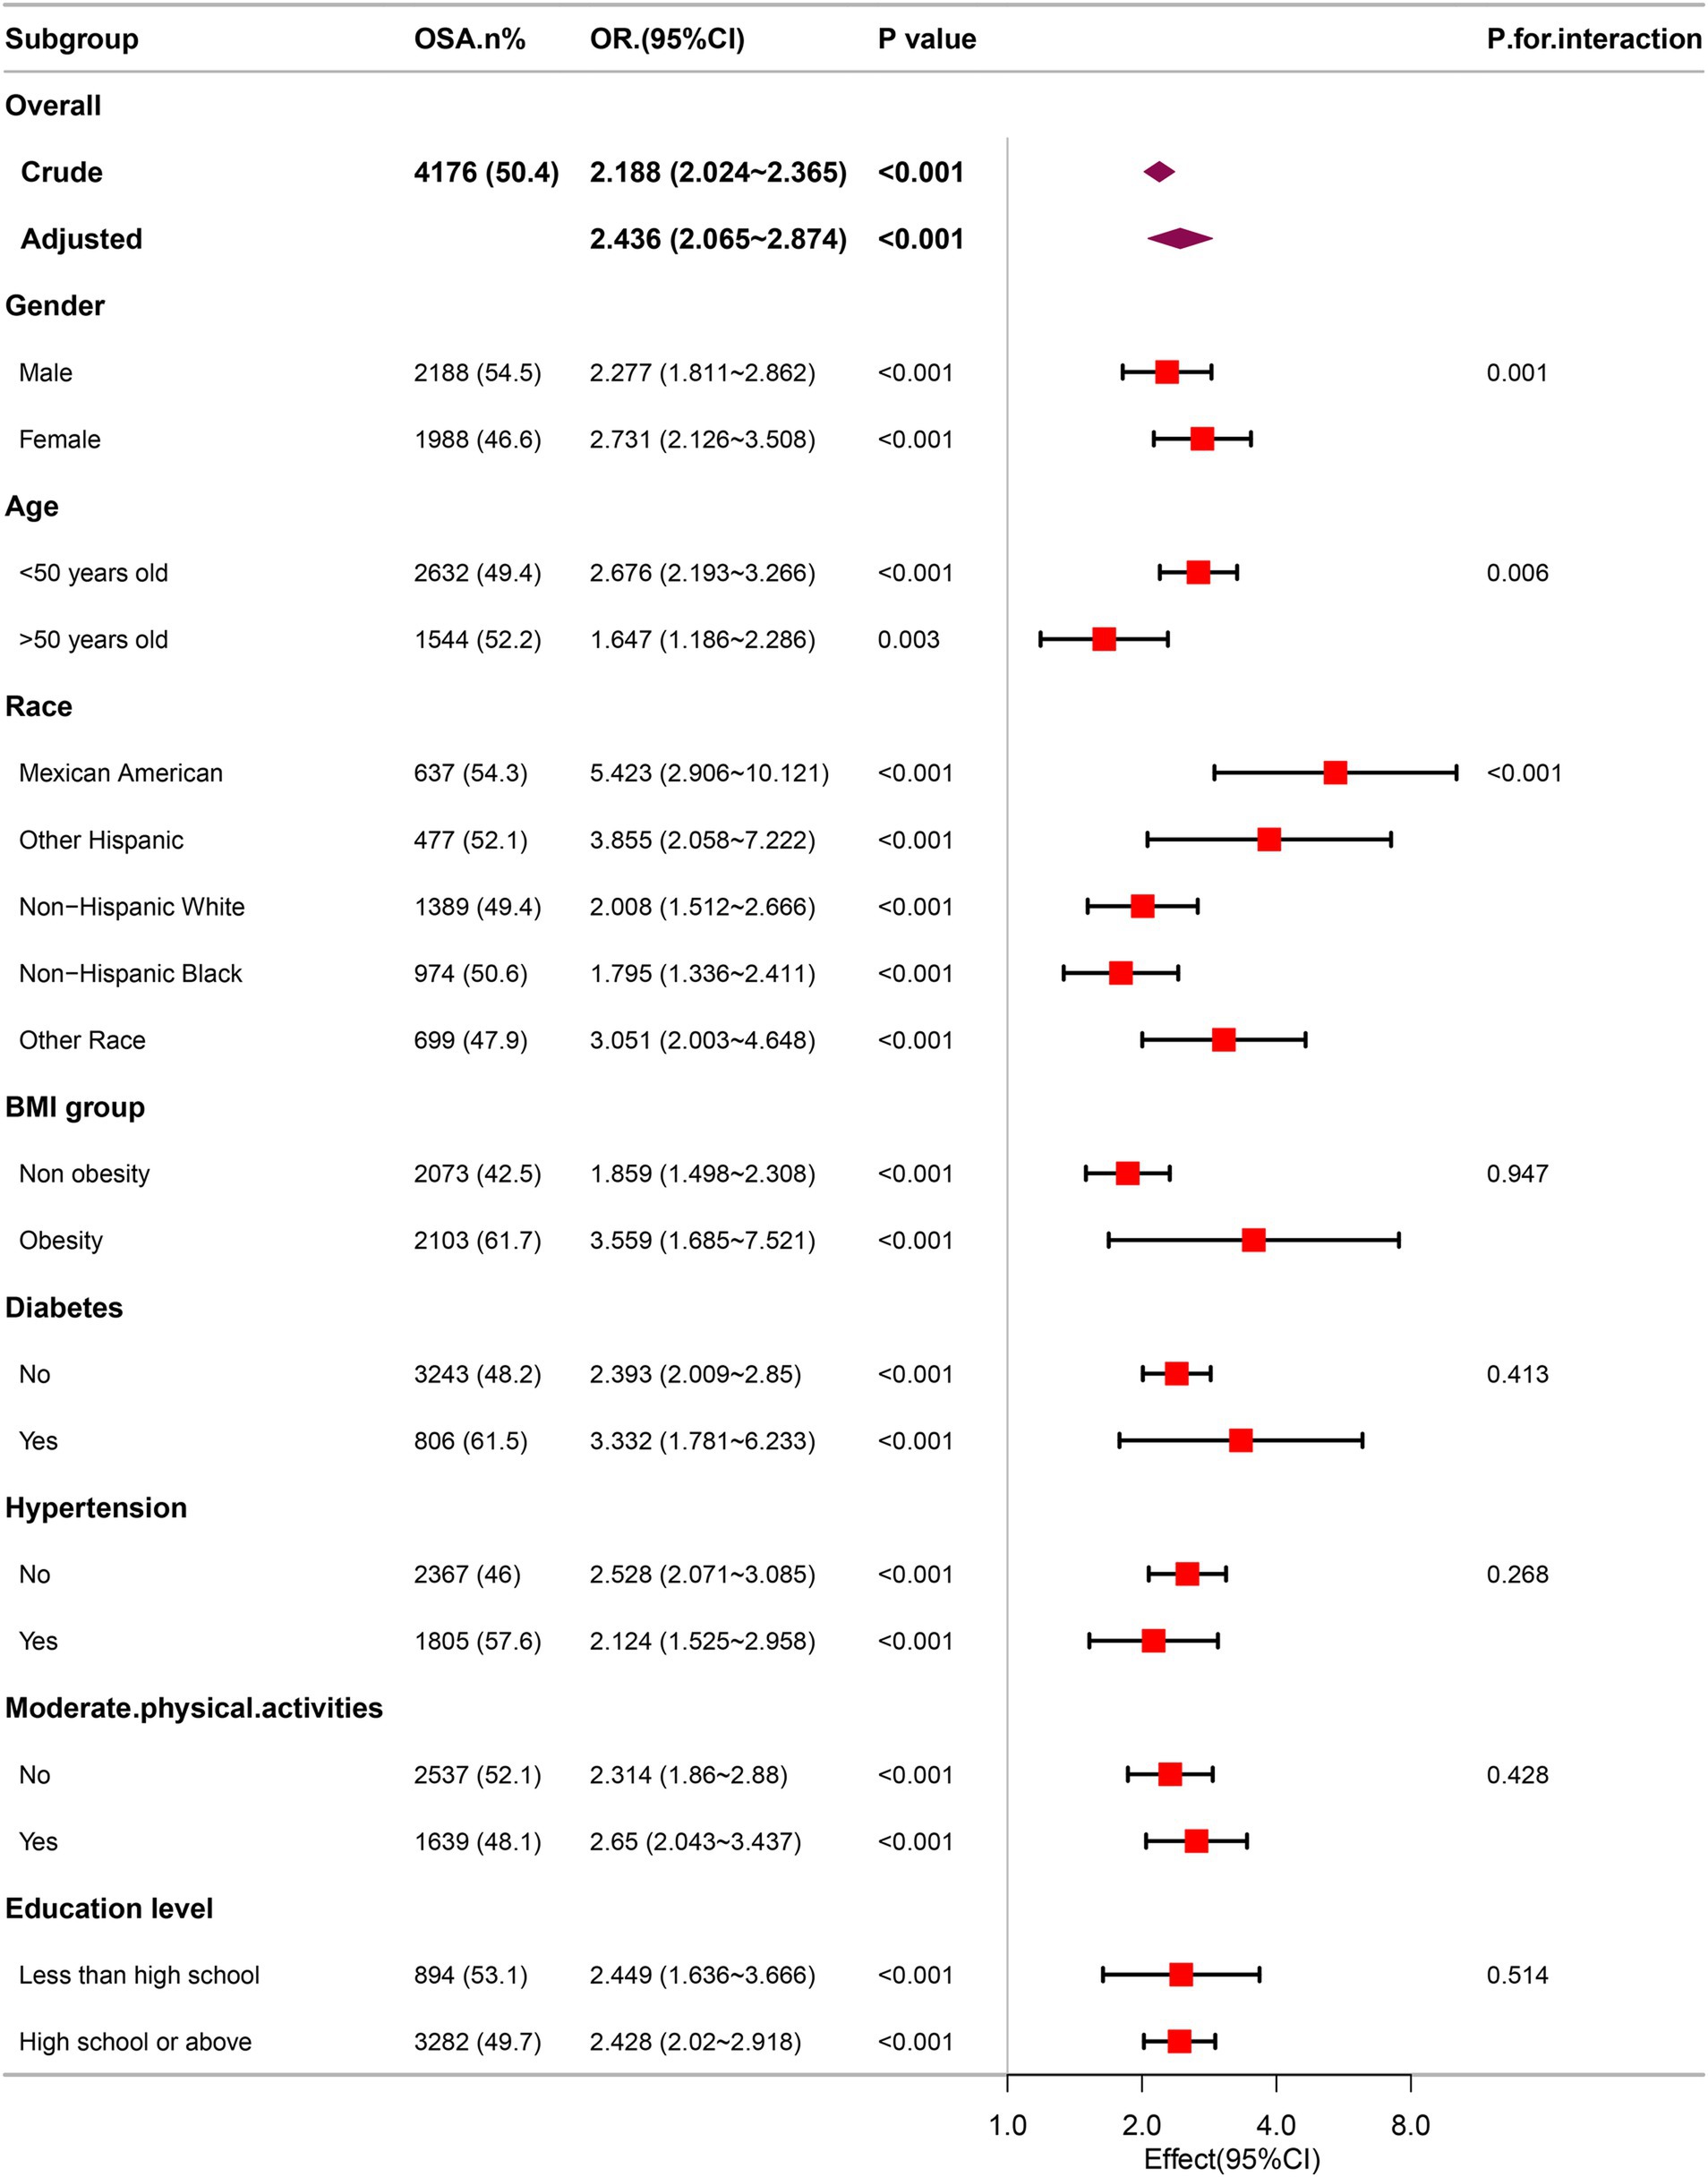
Figure 4. Association between METS-VF and the risk of OSA in various subgroups.
Sensitivity analysesThe results of the sensitivity analysis are presented in Table 4. Sleep-related outcomes were taken as dependent variables in the adjusted Model 3, finding that METS-VF was correlated to stopped breathing (OR, 2.283; 95% CI, 1.697, 3.070) and snoring (OR, 2.716; 95% CI, 2.273, 3.246). After excluding subjects who received lipid-lowering drugs, the correlation between METS-VF and OSA remained stable (OR, 2.493; 95% CI, 2.091, 2.974).
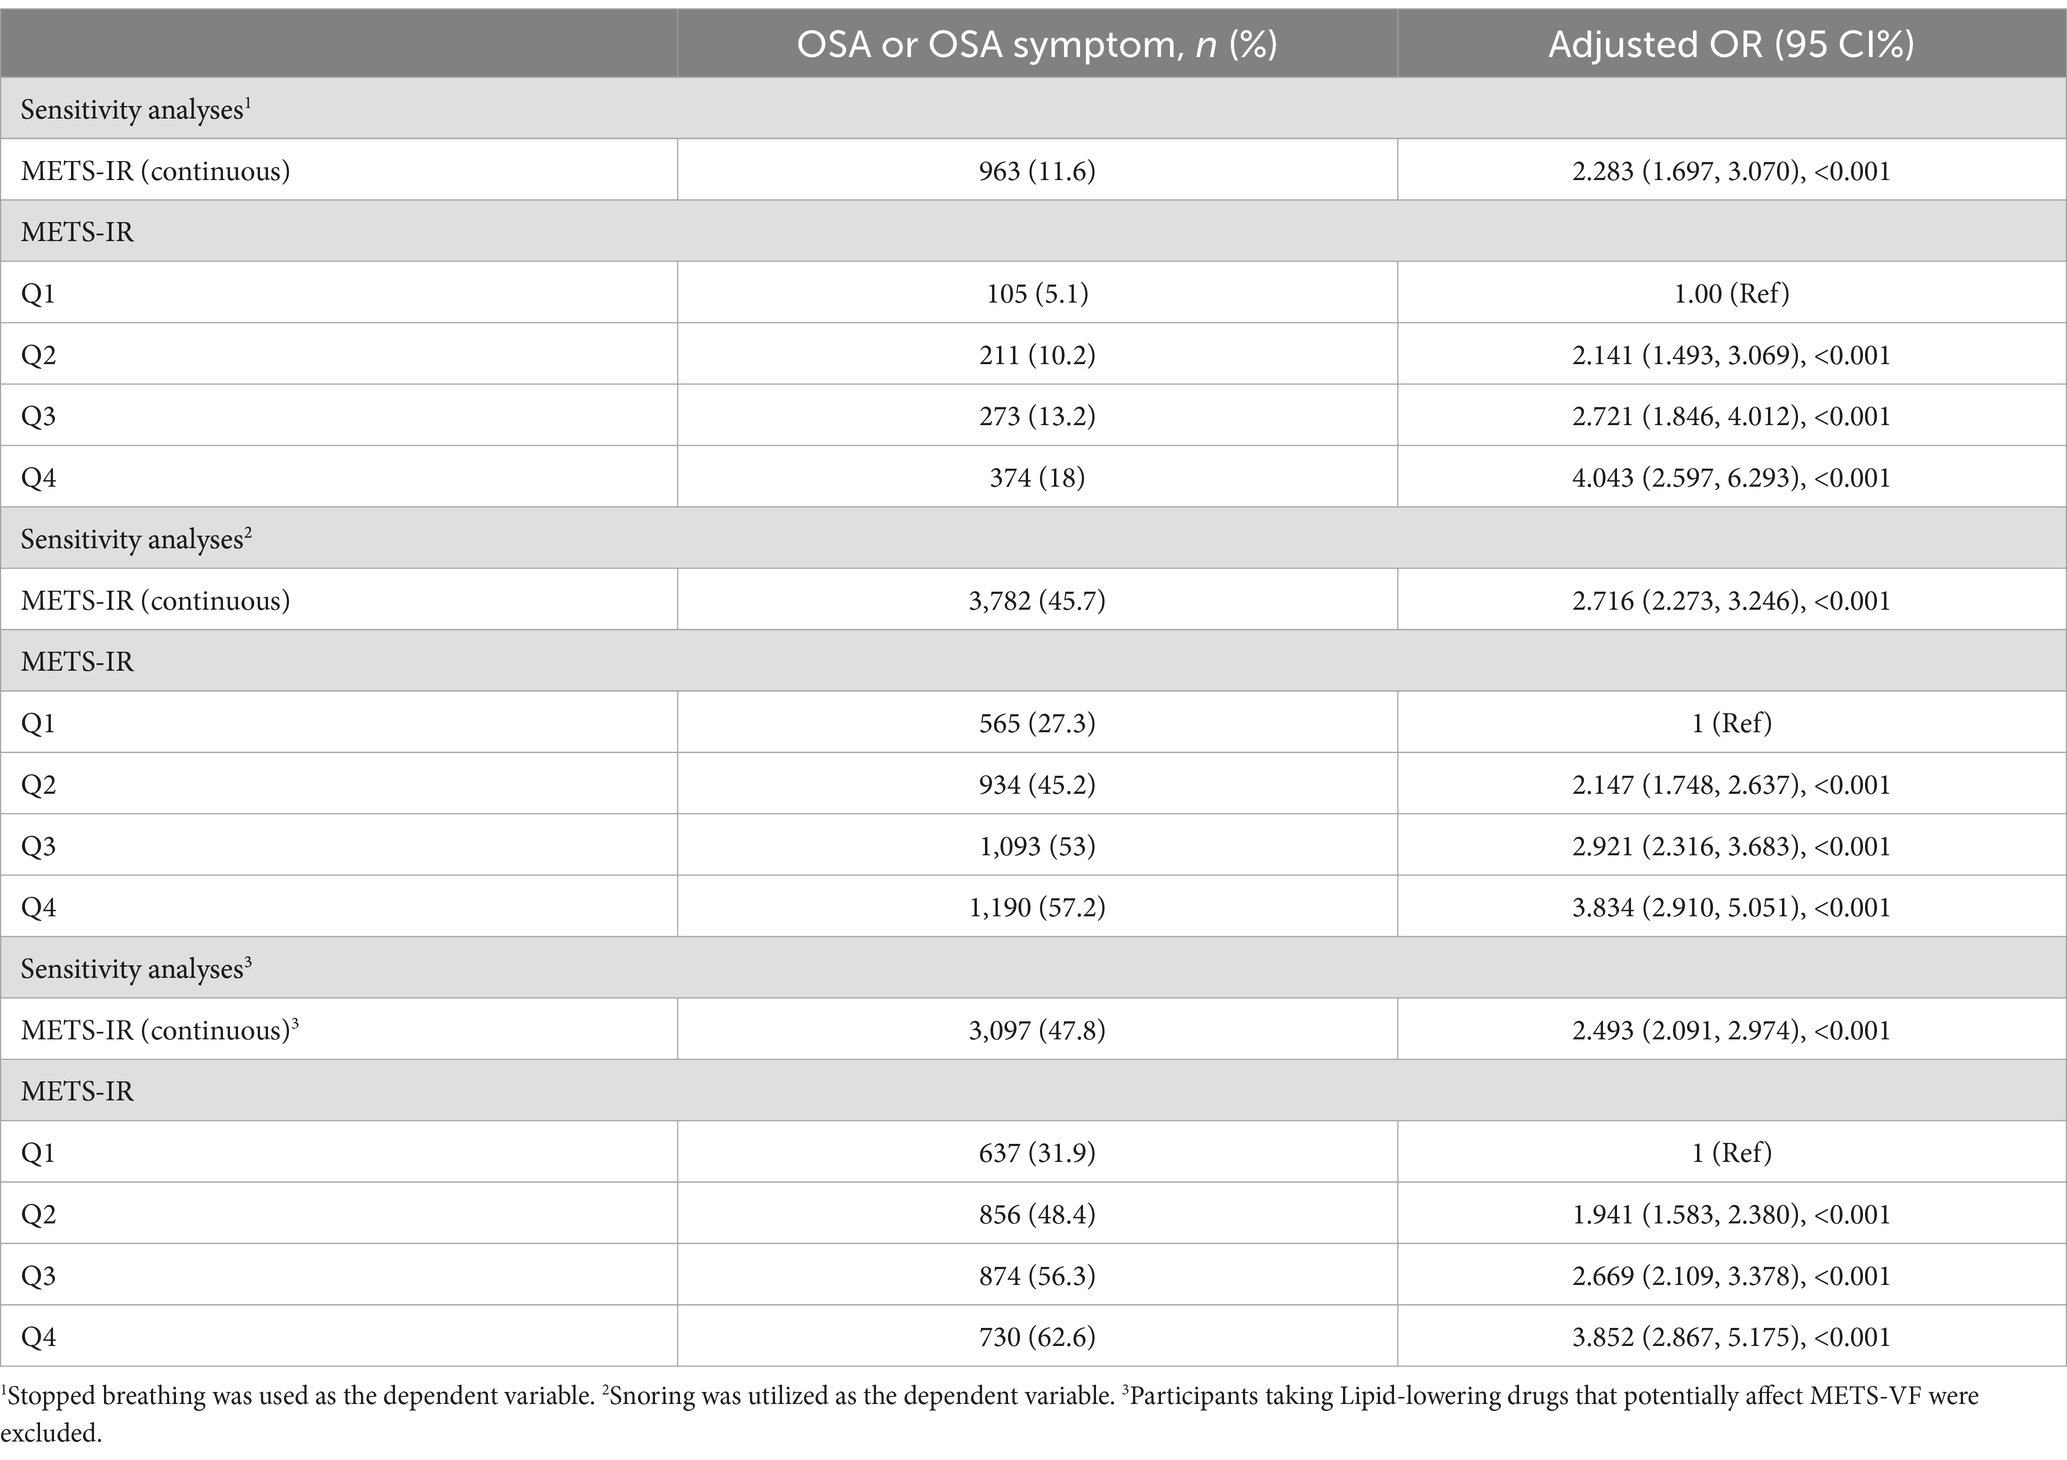
Table 4. Sensitivity analyses.
DiscussionThis cross-sectional study encompassing 8,284 representative adults identified a notable positive correlation between METS-VF and the probability of having OSA. This correlation was particularly pronounced among subjects who were female, younger and Mexican Americans. Notably, linear correlation was identified between OSA and METS-VF, without threshold effects.
METS-VF, a novel estimator of VAT recently developed by Bello Chavolla OY et al. (9) has been meticulously developed and validated, as documented in prior literature. Due to the computational simplicity and high accuracy of METS-VF in predicting visceral obesity, increasing researchers have explored and validated its superior efficacy in assessing and predicting the risk of having the diseases correlated with visceral obesity. In the study, Yu et al. demonstrated that METS-VF can exhibit a robust predictive capacity for CKD compared to other markers of central adiposity (10). Additionally, compared to other obesity evaluation indexes, METS-VF can exhibit both applicability and reliability as a predictor of DM and hypertension within Chinese population (11, 12). A study involving 36,876 subjects identified a positive correlation between asthma and METS-VF (20). For non-obese females, METS-VF has been proven to be beneficial in guiding the management and prevention of hyperuricemia (13). Numerous studies have corroborated the strong correlation between these diseases and OSA (21–23). These findings provide indirect evidence of the robust diagnostic capability of METS-VF for identifying OSA. This study revealed a significant linear positive correlation between METS-VF and the probability of having OSA in a nationally representative sample for the first time.
The correlation between OSA and obesity is characterized by a complex interdependence (8). Notably, obesity, particularly the accumulation of excess abdominal fat, is a major risk factor for the exacerbation and development of OSA. Abdominal obesity can not only elevate intra-abdominal pressure and reduce lung volume, thereby heightening the risk of upper airway collapse (24), but it is also correlated with an increase in visceral fat, secreting various inflammatory and adipose-derived factors, leading to oxidative stress and systemic inflammation. These processes affect muscle activities in the upper respiratory tract, promote the proliferation of adipose tissues around the upper respiratory tract, and thus increase the risk of having OSA (25, 26). In addition, irregular sleep patterns and frequent awakenings correlated with OSA can disrupt hormonal regulation, leading to increased hunger and a preference for high-calorie foods (27–29). Additionally, evidence indicates that OSA can alter the lipid profile (30), which can exacerbate lipid abnormalities by enhancing inflammatory responses. And OSA itself can exacerbate lipid abnormalities by increasing IR and inflammatory responses, thereby creating a negative feedback loop (31, 32). Furthermore, aging is correlated with the accumulation of senescent adipocytes in adipose tissues, leading to disruptions in lipid metabolism, glucose metabolism, immune regulation and endocrine function, within adipose tissues (33, 34). METS-VF can incorporate the aforementioned parameters (WHtR, age, lipid profile, and insulin resistance) to evaluate the metabolic status of visceral fat, which may can partially indicate the risk of having OSA.
Subgroup analyses in this study have uncovered a novel finding that elevated METS-VF was significantly correlated with an increased prevalence of OSA in individuals under 50 years old. This increased risk may be correlated with age-related physiological and metabolic changes, including alterations in lipid distribution and related metabolic markers (35, 36). Older adults are more prone to have hypertension, cardiovascular diseases, and DM, which can affect both metabolic indexes and sleep quality, which may consequently attenuate the correlation between METS-VF and OSA. Notably, Hai Deng et al. (8) have elucidated this phenomenon by proposing that the divergent effects of adipose tissue distribution in older adults may account for this discrepancy. Furthermore, it was identified that gender influences the correlation between METS-VF and OSA. Females typically exhibit a higher proportion of body fat compared to males and experience a reduction in estrogen levels after menopause, which may increase the risk of having OSA during menopause (37, 38).
This study carries important implications for clinical practice, particularly given the increasing annual prevalence of cardiovascular and cerebrovascular diseases correlated with OSA (39). OSA has emerged as a notable health issue impacting public well-being. Nevertheless, the diagnosis of OSA is frequently a lengthy, resource-intensive, and costly process for patients. Therefore, there is a pressing clinical necessity to pinpoint a convenient and effective diagnostic approach for OSA. METS-VF, a cost-efficient and readily measurable metric, satisfactorily fulfills these clinical needs. The results of this study provide important insights for healthcare professionals in efficiently evaluating the risk of having OSA in patients.
The study’s primary strength is its distinction as the first cross-sectional analysis to explore the correlation between METS-VF and OSA, supported by a sufficiently large and representative sample size. However, it is crucial to acknowledge the limitations inherent in this study. Firstly, the establishment of a causal relationship between METS-VF and OSA was not feasible through cross-sectional studies. As discussed above, a bidirectional relationship may exist. Secondly, its reliance on data solely from US adults, which may impede the generalizability of the results to other populations. Thirdly, there are numerous potential influencing factors for OSA and METS-VF. Although as many relevant covariates as possible have been incorporated into the models, it is still challenging to completely exclude the influence of other potential covariates, such as diet and genetic factors. Fourthly, in this study, the risk of having OSA was assessed through three questions, which suggests a high risk of having OSA rather than a confirmed diagnosis, and also lead to recall bias. Ideally, diagnosing OSA requires overnight polysomnography or polygraphy. Future research should incorporate prospective cohort studies and richer datasets to overcome these limitations and should also aim at uncovering the underlying mechanisms linking these conditions.
ConclusionThis study revealed a notable correlation between elevated METS-VF and OSA. METS-VF can function as an independent predictor of OSA, aiding in early detection and diagnosis to mitigate the risks correlated with the conditions.
Data availability statementPublicly available datasets were analyzed in this study. This data can be found here: NHANES, http://www.cdc.gov/nhanes.
Ethics statementThe studies involving humans were approved by National Center for Health Statistics Ethics Review Board. The studies were conducted in accordance with the local legislation and institutional requirements. The participants provided their written informed consent to participate in this study.
Author contributionsXX: Conceptualization, Investigation, Writing – original draft. JX: Conceptualization, Investigation, Writing – original draft. MZ: Conceptualization, Investigation, Writing – original draft, Writing – review & editing.
FundingThe author(s) declare that no financial support was received for the research, authorship, and/or publication of this article.
Conflict of interestThe authors declare that the research was conducted in the absence of any commercial or financial relationships that could be construed as a potential conflict of interest.
Publisher’s noteAll claims expressed in this article are solely those of the authors and do not necessarily represent those of their affiliated organizations, or those of the publisher, the editors and the reviewers. Any product that may be evaluated in this article, or claim that may be made by its manufacturer, is not guaranteed or endorsed by the publisher.
References1. Gottlieb, DJ, and Punjabi, NM. Diagnosis and Management of Obstructive Sleep Apnea: a review. JAMA. (2020) 323:1389–400. doi: 10.1001/jama.2020.3514
Crossref Full Text | Google Scholar
3. Peppard, PE, Young, T, Barnet, JH, Palta, M, Hagen, EW, and Hla, KM. Increased prevalence of sleep-disordered breathing in adults. Am J Epidemiol. (2013) 177:1006–14. doi: 10.1093/aje/kws342
PubMed Abstract | Crossref Full Text | Google Scholar
4. Mitra, AK, Bhuiyan, AR, and Jones, EA. Association and risk factors for obstructive sleep apnea and cardiovascular diseases: a systematic review. Diseases. (2021) 9:1–15. doi: 10.3390/diseases9040088
PubMed Abstract | Crossref Full Text | Google Scholar
5. Yang, W, Cai, X, Hu, J, Wen, W, Mulalibieke, H, Yao, X, et al. The metabolic score for insulin resistance (METS-IR) predicts cardiovascular disease and its subtypes in patients with hypertension and obstructive sleep apnea. Clin Epidemiol. (2023) 15:177–89. doi: 10.2147/CLEP.S395938
PubMed Abstract | Crossref Full Text | Google Scholar
6. Brown, J, Yazdi, F, Jodari-Karimi, M, Owen, JG, and Reisin, E. Obstructive sleep apnea and hypertension: updates to a critical relationship. Curr Hypertens Rep. (2022) 24:173–84. doi: 10.1007/s11906-022-01181-w
PubMed Abstract | Crossref Full Text | Google Scholar
8. Deng, H, Duan, X, Huang, J, Zheng, M, Lao, M, Weng, F, et al. Association of adiposity with risk of obstructive sleep apnea: a population-based study. BMC Public Health. (2023) 23:1835. doi: 10.1186/s12889-023-16695-4
PubMed Abstract | Crossref Full Text | Google Scholar
9. Bello-Chavolla, OY, Antonio-Villa, NE, Vargas-Vazquez, A, Viveros-Ruiz, TL, Almeda-Valdes, P, Gomez-Velasco, D, et al. Metabolic score for visceral fat (METS-VF), a novel estimator of intra-abdominal fat content and cardio-metabolic health. Clin Nutr. (2020) 39:1613–21. doi: 10.1016/j.clnu.2019.07.012
PubMed Abstract | Crossref Full Text | Google Scholar
10. Yu, P, Meng, X, Kan, R, Wang, Z, and Yu, X. Association between metabolic scores for visceral fat and chronic kidney disease: a cross-sectional study. Front Endocrinol. (2022) 13:1052736. doi: 10.3389/fendo.2022.1052736
PubMed Abstract | Crossref Full Text | Google Scholar
11. Antonio-Villa, NE, Bello-Chavolla, OY, Vargas-Vazquez, A, Mehta, R, and Aguilar-Salinas, CAG. Metabolic Syndrome Study. The combination of insulin resistance and visceral adipose tissue estimation improves the performance of metabolic syndrome as a predictor of type 2 diabetes. Diabet Med. (2020) 37:1192–201. doi: 10.1111/dme.14274
Crossref Full Text | Google Scholar
12. Feng, Y, Yang, X, Li, Y, Wu, Y, Han, M, Qie, R, et al. Metabolic score for visceral fat: a reliable indicator of visceral obesity for predicting risk for hypertension. Nutrition. (2022) 93:111443. doi: 10.1016/j.nut.2021.111443
PubMed Abstract | Crossref Full Text | Google Scholar
13. Liu, XZ, Chen, DS, Xu, X, Li, HH, Liu, LY, Zhou, L, et al. Longitudinal associations between metabolic score for visceral fat and hyperuricemia in non-obese adults. Nutr Metab Cardiovasc Dis. (2020) 30:1751–7. doi: 10.1016/j.numecd.2020.06.001
PubMed Abstract | Crossref Full Text | Google Scholar
14. Cai, XT, Zhu, Q, Liu, SS, Wang, MR, Wu, T, Hong, J, et al. Associations between the metabolic score for insulin resistance index and the risk of type 2 diabetes mellitus among non-obese adults: insights from a population-based cohort study. Int J Gen Med. (2021) 14:7729–40. doi: 10.2147/IJGM.S336990
PubMed Abstract | Crossref Full Text | Google Scholar
15. Johnson, CL, Dohrmann, SM, Burt, VL, and Mohadjer, LK. National health and nutrition examination survey: sample design, 2011-2014. Vital Health Stat. (2014) 2:1–33.
16. Cavallino, V, Rankin, E, Popescu, A, Gopang, M, Hale, L, and Meliker, JR. Antimony and sleep health outcomes: NHANES 2009-2016. Sleep Health. (2022) 8:373–9. doi: 10.1016/j.sleh.2022.05.005
PubMed Abstract | Crossref Full Text | Google Scholar
17. Cai, S, Li, S, Zhou, Y, Song, J, and Peng, J. The association between sedentary behavior and obstructive sleep apnea: a cross-sectional study from the NHANES (2007-2008 to 2015-2020). BMC Oral Health. (2024) 24:224. doi: 10.1186/s12903-024-03960-0
PubMed Abstract | Crossref Full Text | Google Scholar
18. Wang, Z, Shao, X, Xu, W, Xue, B, Zhong, S, and Yang, Q. The relationship between weight-adjusted-waist index and diabetic kidney disease in patients with type 2 diabetes mellitus. Front Endocrinol. (2024) 15:1345411. doi: 10.3389/fendo.2024.1345411
PubMed Abstract | Crossref Full Text | Google Scholar
19. Li, C, and Xu, J. Negative correlation between metabolic score for insulin resistance index and testosterone in male adults. Diabetol Metab Syndr. (2024) 16:113. doi: 10.1186/s13098-024-01353-5
PubMed Abstract | Crossref Full Text | Google Scholar
20. Liu, Q, Han, X, Chen, Y, Gao, Y, Yang, W, and Huang, L. Asthma prevalence is increased in patients with high metabolism scores for visceral fat: study reports from the US. Front Endocrinol. (2023) 14:1162158. doi: 10.3389/fendo.2023.1162158
PubMed Abstract | Crossref Full Text | Google Scholar
21. Kim, T, and Kang, J. Relationship between obstructive sleep apnea, insulin resistance, and metabolic syndrome: a nationwide population-based survey. Endocr J. (2023) 70:107–19. doi: 10.1507/endocrj.EJ22-0280
PubMed Abstract | Crossref Full Text | Google Scholar
22. Lu, N, and Yin, F. Relationship between hyperuricemia-waist phenotype and obstructive sleep apnea in type 2 diabetes mellitus. Diabetes Metab Syndr Obes. (2023) 16:1505–13. doi: 10.2147/DMSO.S408637
PubMed Abstract | Crossref Full Text | Google Scholar
23. Wang, C, Shi, M, Lin, C, Wang, J, Xie, L, and Li, Y. Association between the triglyceride glucose index and obstructive sleep apnea and its symptoms: results from the NHANES. Lipids Health Dis. (2024) 23:133. doi: 10.1186/s12944-024-02125-w
PubMed Abstract | Crossref Full Text | Google Scholar
24. Harada, Y, Oga, T, Chihara, Y, Azuma, M, Murase, K, Toyama, Y, et al. Differences in associations between visceral fat accumulation and obstructive sleep apnea by sex. Ann Am Thorac Soc. (2014) 11:383–91. doi: 10.1513/AnnalsATS.201306-182OC
PubMed Abstract | Crossref Full Text | Google Scholar
25. Senaratna, CV, Perret, JL, Lodge, CJ, Lowe, AJ, Campbell, BE, Matheson, MC, et al. Prevalence of obstructive sleep apnea in the general population: a systematic review. Sleep Med Rev. (2017) 34:70–81. doi: 10.1016/j.smrv.2016.07.002
Crossref Full Text | Google Scholar
26. Veasey, SC, and Rosen, IM. Obstructive Sleep Apnea in Adults. Reply N Engl J Med. (2019) 381:e7. doi: 10.1056/NEJMc1906527
Crossref Full Text | Google Scholar
28. St-Onge, MP, and Shechter, A. Sleep disturbances, body fat distribution, food intake and/or energy expenditure: pathophysiological aspects. Horm Mol Biol Clin Investig. (2014) 17:29–37. doi: 10.1515/hmbci-2013-0066
PubMed Abstract | Crossref Full Text | Google Scholar
29. Spruyt, K, Sans Capdevila, O, Serpero, LD, Kheirandish-Gozal, L, and Gozal, D. Dietary and physical activity patterns in children with obstructive sleep apnea. J Pediatr. (2010) 156:724–30. doi: 10.1016/j.jpeds.2009.11.010
Crossref Full Text | Google Scholar
30. Behnoush, AH, Khalaji, A, Ghondaghsaz, E, Masrour, M, Shokri Varniab, Z, Khalaji, S, et al. Triglyceride-glucose index and obstructive sleep apnea: a systematic review and meta-analysis. Lipids Health Dis. (2024) 23:4. doi: 10.1186/s12944-024-02005-3
Crossref Full Text | Google Scholar
31. Giampa, SQC, Lorenzi-Filho, G, and Drager, LF. Obstructive sleep apnea and metabolic syndrome. Obesity (Silver Spring). (2023) 31:900–11. doi: 10.1002/oby.23679
Crossref Full Text | Google Scholar
32. Meszaros, M, and Bikov, A. Obstructive sleep Apnoea and lipid metabolism: the summary of evidence and future perspectives in the pathophysiology of OSA-associated Dyslipidaemia. Biomedicines. (2022) 10:2754–85. doi: 10.3390/biomedicines10112754
PubMed Abstract | Crossref Full Text | Google Scholar
33. Liu, Z, Wu, KKL, Jiang, X, Xu, A, and Cheng, KKY. The role of adipose tissue senescence in obesity- and ageing-related metabolic disorders. Clin Sci (Lond). (2020) 134:315–30. doi: 10.1042/CS20190966
PubMed Abstract | Crossref Full Text | Google Scholar
34. Gao, Z, Daquinag, AC, Fussell, C, Zhao, Z, Dai, Y, Rivera, A, et al. Age-associated telomere attrition in adipocyte progenitors predisposes to metabolic disease. Nat Metab. (2020) 2:1482–97. doi: 10.1038/s42255-020-00320-4
PubMed Abstract | Crossref Full Text | Google Scholar
35. Rea, IM, Gibson, DS, McGilligan, V, McNerlan, SE, Alexander, HD, and Ross, OA. Age and age-related diseases: role of inflammation triggers and cytokines. Front Immunol. (2018) 9:586. doi: 10.3389/fimmu.2018.00586
PubMed Abstract | Crossref Full Text | Google Scholar
36. Egawa, J, Pearn, ML, Lemkuil, BP, Patel, PM, and Head, BP. Membrane lipid rafts and neurobiology: age-related changes in membrane lipids and loss of neuronal function. J Physiol. (2016) 594:4565–79. doi: 10.1113/JP270590
PubMed Abstract | Crossref Full Text | Google Scholar
37. Colafella, KMM, and Denton, KM. Sex-specific differences in hypertension and associated cardiovascular disease. Nat Rev Nephrol. (2018) 14:185–201. doi: 10.1038/nrneph.2017.189
Crossref Full Text | Google Scholar
38. Goyal, A, Meena, R, Gupta, S, Kar, A, Ali, R, Bohra, A, et al. Sex-specific differences in presenting symptoms of obstructive sleep apnea. Lung India. (2024) 41:115–20. doi: 10.4103/lungindia.lungindia_235_22
留言 (0)